R E G U L A R A R T I C L E
Open Access
Tampering with Twitter’s Sample API
Jürgen Pfeffer
1,2*, Katja Mayer
1and Fred Morstatter
3*Correspondence: juergen.pfeff[email protected] 1Bavarian School of Public Policy,
Technical University of Munich, Munich, Germany
2Institute for Software Research,
Carnegie Mellon University, Pittsburgh, USA
Full list of author information is available at the end of the article
Abstract
Social media data is widely analyzed in computational social science. Twitter, one of the largest social media platforms, is used for research, journalism, business, and government to analyze human behavior at scale. Twitter offers data via three different Application Programming Interfaces (APIs). One of which, Twitter’s Sample API, provides a freely available 1% and a costly 10% sample of all Tweets. These data are supposedly random samples of all platform activity. However, we demonstrate that, due to the nature of Twitter’s sampling mechanism, it is possible to deliberately influence these samples, the extent and content of any topic, and consequently to manipulate the analyses of researchers, journalists, as well as market and political analysts trusting these data sources. Our analysis also reveals that technical artifacts can accidentally skew Twitter’s samples. Samples should therefore not be regarded as random. Our findings illustrate the critical limitations and general issues of big data sampling, especially in the context of proprietary data and undisclosed details about data handling.
Keywords: Twitter Data; Sampling; Manipulation; Experiments
1 Introduction
Social media are perceived as central platforms for opinion formation, public participa-tion and triggering political and societal change [1,2]. Therefore, social media data is of great importance not only to social researchers but also to decision makers [3] in the con-text of political opinion formation [4], crisis management [5,6], information quality [7], geopolitical events [8] or security concerns [9]. However, analyzing social media data to describe human behavior is complicated by several challenging factors, first and foremost related to the representation of human populations and human behavior, as well as by methodological issues [10–12].
In sharing its data, Twitter has become one of the most important data suppliers, pro-viding a main source of data for social media analysis to journalists, policy makers and businesses alike. Twitter allows data access via three different Application Programming Interfaces (APIs): Filter API, Sample API, and REST API (Representational State Trans-fer API). For studying trends and emerging topics, Twitter’s Sample API provides 1% of all Tweets worldwide. Most academic researchers rely on one of these freely avail-able data sources, whereas social analytics industries and government entities buy in to get elevated access, e.g. to 10% of the overall Twitter data, also known as the Deca-hose.
Almost all of Twitter (and other social media) analyses depend on access to samples. Twitter does not reveal in detail how data sampling is handled. The API has to be regarded as an unavoidable “black box” [13,14], which is sitting between the researcher and the data source. Consequently, the use of Twitter data is regarded as highly problematic, especially in the social sciences [15–17]. Because sampling is so prevalent, we need to question its validity [10,18] and better understand platform mechanisms and possible biases in the resulting data [19–22].
Our work builds on a body of literature that opens up and reverse engineers this black box. The goal is to improve the integrity of social media research. In this paper we will prove that the sampling mechanism of Twitter’s Sample API is highly vulnerable to ma-nipulation and is prone to creating sampling artifacts that can jeopardize representative-ness of accessible data. Therefore, the samples from the Sample API cannot be regarded as random. They have the potential to damage the validity of scientific research.
Contributions and Findings.In the following we will demonstrate how a flaw in the sam-pling mechanism underpinning Twitter’s Sample API can be used to skew the analysis cre-ating bias by design and making the sampling vulnerable to attacks. The findings of our research challenge the credibility of using Twitter’s Sample API for both academic and non-academic purposes. The main contributions of this article are the following:
1 We showcase that it is very easy to tamper with the data in Twitter’s 1% and 10% Sample API.
2 We illustrate how this tampering can be used to manipulate the extent and content/sentiment of a topic in the Sample API data.
3 We show that groups of users are already over-represented in the Sample API. 4 We discuss the implications of our findings on sampling challenges and provide
arguments why open/shared data needs open algorithms in order to give researchers and practitioners a fair chance to know and assess the data.
The remainder of this article is structured as follows: after reporting on related work in Sect.2, we proceed to describe our experimental setup in Sect.3. Section4covers the experimental results and discusses the potential scale of such attacks. The goal of Sect.5
is to derive expected behavior that we would observe in a random system and to develop thresholds for outlier detection. These metrics are then used in Sect.6to identify groups of over-represented accounts in Twitter’s Sample API, so that in Sect.7we can propose potential solutions for the demonstrated issues. Section8concludes the paper with a dis-cussion of our findings and aligns them with pressing issues of social media research.
2 Related work
source has helped to early detect promoted campaigns [32]. Among many other works, the 1% Sample was used to find how gender and social rank relate to people’s propensity to curse and the choice of curse words [34]. Recently, misinformation networks were studied using the 1% Sample data [35].
As researchers, journalists, but also companies and policy consultants use Twitter in their daily work, we are interested in biases because they jeopardize data quality and hence reliability and validity of these analyses. We can build on a broad body of literature elabo-rating the challenges and biases of social media data—for an overview see [10,11,36]. By and large, social media biases can be arranged into two groups,bias by designandbias by purpose.
Bias by designresults from built-in characteristics of the platform [11]. Some platforms are more attractive to specific sociodemographic groups than others [37] and specific ser-vices of platforms can appeal differently to certain groups, e.g. geo-referencing [38]. The neglect of cultural differences driving the way users interact with a site distort results [39]. Bias that results from the architecture of the technical infrastructure is harder to diagnose. Platform effects, e.g. changes in the graphical user interface, can heavily influence user be-havior [40]. Lazer et al. [41] revealed that Google does not store the search term typed by the user but the search term selected based on suggestions, which has tremendous im-plications for the analysis of human behavior based on those data. Our work focuses on issues resulting from sampling [42,43] of Twitter data. Since Twitter does not reveal how data sampling is performed, the use of Twitter data is generally regarded as highly prob-lematic, especially in the social sciences [42,44–46]. Several studies discuss working, com-positions and possible biases of data [47,48] and a “reverse-engineered” model has been developed for the Sample API, which indicates that the sampling is based on a millisec-ond time window and that the timestamp at which the Tweet arrived at Twitter’s servers is coded into the Tweet’s ID [42,43]. Although it has been shown that Twitter creates non-representative samples with non-transparent and highly fluctuating sample rates of the overall Twitter activity [49], this has had no effect on its popularity amongst researchers [50]. It was suggested in the past that Sample API data can be used to estimate the quality of Streaming API data [51]. Social scientists have elaborated on sampling techniques and theories for ages, while the discussion of sampling and, in particular, of representativeness in the context of big data has remained marginal until now [36,41,52–54].
Bias by purposeincludes all forms of approaches to manipulate data on a platform or the analysis that is based on data from a platform. We face a variety of biases in social media data, such as targeted user collaboration to skew contents of a site [55], changing statistics on site like trends and follower counts in an attempt to skew the perception of real users on the site [56]. The most studied phenomenon in this category are bots [57–59]. Detection of bots can use content of Tweets [60] or profile information, e.g. usernames [61]. Chu et al. [62] try to classify users as bots, humans, or cyborgs based upon the user’s behav-ioral patterns. In [63], the authors use a network of 60 honeypots to tempt bots to follow them. Each of these honeypots focuses on gaining attraction by tweeting trending topics and links as well as regular tweets and tweets mentioning other honeypots. They then engineered several features to detect these accounts.
in-tentional and uninin-tentional tampering with the allegedly random samples that Twitter is providing. We will show how the sample data can be manipulated, so that samples cannot be regarded as random anymore.
3 Experiments
We apply a two-fold approach to provide evidence for Twitter’s tampered samples. First, as described in this and the next section, we test the blackboxed sampling procedure of the Twitter Sample API by inducing tweets into the feed in that way that they appear later in the sample with high certainty. Second, by finding ways to identify over-representation in the sample, we describe typical account groups that might inhibit the integrity of the sampling procedure in Sects.5and6. With this two-fold approach we can exemplify the potential exploitation of the system architecture, which can lead to a biased interpretation. In the following, we reveal details about the sampling procedure which is used by Twit-ter to provide data via the Sample API. The approach of TwitTwit-ter to decide whether a Tweet is in the Sample API or not is solely based on timestamps. This mechanism was shown to be a potential weakness [43]. Building on this insight, we show that by timing the sending of a Tweet accordingly, it is possible to influence with high accuracy what goes into the sample and, hence, manipulate Twitter’s Sample API samples. Here, we demonstrate that the millisecond sample criteria is vulnerable as the Tweet processing time delay can be learned so that (for the 1% Sample API) the 10 millisecond selection time window can be hit with 80 times higher chance than random. We use this approach to showcase manipu-lation of the composition of the sample and present the results of short-term experiments that manipulated global dynamics of the 2016 US Presidential Election related hashtags.
For this article we focus on the freely available 1% Sample API. However, our findings are transferable to the 10% academic Sample data as both APIs are based on the same sampling logic and have overlapping sampling windows.
3.1 Twitter’s data samples
To collect Twitter data, researchers typically use the freely available API endpoints for public data. There are three different APIs to collect Twitter data. The Representational State Transfer (REST) API provides information about individual user accounts or popular topics and allows for sending or liking Tweets as well as following accounts. The Stream-ing APIs are used for real-time collection of Tweets and come in two flavors. First, the Filter API extracts Tweets based upon a user’s query containing keywords, user accounts, or geographic areas. The Filter API is used for studying Twitter content based on a pre-defined set of topics, user accounts, or locations. In contrary, the Sample API delivers a purportedly random 1% sample of all publicly sent Tweets, currently about 3.5 to 4 mil-lion Tweets per day. When interested in trends or emerging topics, the Sample API is used. By archiving Sample API Tweets, non-predictable events (e.g. natural disasters, terrorist attacks) can be analyzed in retrospect because this sample cuts across all topics on the site.
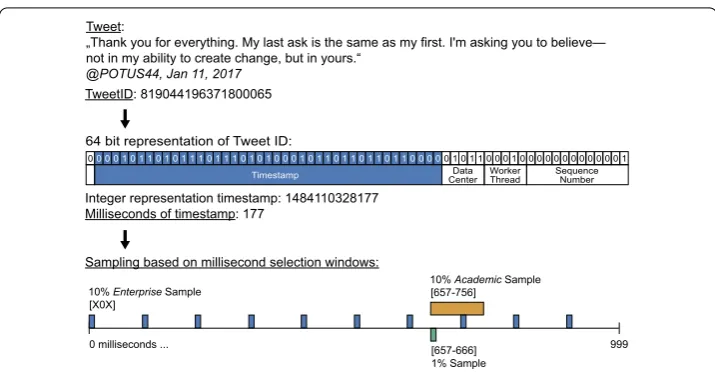
Figure 1Twitter Sample API data sampling. Every Tweet gets a Tweet ID assigned by Twitter. Tweet IDs include the millisecond timestamp of when the Tweet arrives at a Twitter server. Whether a Tweet is in one of the Sample APIs is solely based on this millisecond timestamp. Three different samples based on their milliseconds coverage have been identified, namely 1%, 10% academic, 10% enterprise
researchers and practitioners. In a nutshell, the Filter APIfiltersdata based on parameters and the Sample APIsamplesdata based on rate limits.
For the purpose of this study, we examine the sampling procedures of three types of Twitter’s Sample API, the public and free 1% Sample API, the 10% academic sample, and the fee-based 10% enterprise sample. First, the public Sample API is an endpoint that is provided for free by Twitter to anyone who wishes to obtain a 1% sample of Twitter data. The API users have no ability to specify a particular query to this endpoint; they are only able to connect to it and receive a fixed set of Tweets from Twitter. Every user who con-nects to this endpoint will receive the same set of Tweets [47].
Since Twitter does not reveal the technical details about the sampling mechanism of the Sample API, researchers have reverse engineered that process [42]. The way this sample is created is purely based on the millisecond timestamp that the tweet arrived at Twit-ter’s servers. When a Tweet arrives at one of TwitTwit-ter’s servers, it gets assigned an ID (see Fig.1). Part of this ID is the millisecond timestamp of when the Tweet arrived at the server. This timestamp is crucial for Twitter’s sampling. Any tweet that arrives at one of Twitter’s servers between milliseconds 657–666 will be available in the 1% Sample API, as indicated in Fig.1.
3.2 Experimental setup
Morstatter et al. [43] showed that it is possible to learn the millisecond time difference from sending a Tweet until the Tweet gets assigned the Tweet ID. Looking only at the millisecond portion of the timestamp, we state that the arrival millisecondstaequals the
sending millisecondstsplus a milliseconds time offsettδthat comes from the time it takes
for the Tweet to pass from sending to getting processed as well as the clock differences be-tween the local computer and the respective Twitter server:ta=ts+tδ. From this equation
we knowtsfrom our local computer andtafrom the Tweet ID, so that we can calculatetδ.
We used this technique to adjust the timing of the send events so that the Tweets we sent were more likely to arrive at the server within the 1% Sample API’s selection time window. In other words, we maximized the proportion of Tweets that gets handled by the Twitter servers within the specific 10 millisecond time window of every second. Crucial for de-termining the time difference between sending a Tweet and the arrival of the same Tweet at one of Twitter’s servers is that Twitter provides the assigned ID as return information when sending the Tweet with the REST API. To demonstrate this vulnerability, we chose two major hashtags for short-term manipulation. At the time of our experiments, in late October and early November 2016, right before the US presidential election, prominent hashtags were: #imwithher (used by supporters of Hillary R. Clinton) and #trump (used by supporters and critics of Donald J. Trump).
We created 100 Twitter accounts for the purpose of this study and sent about 21,000 Tweets in a series of short-term experiments in late October and early November 2016. User IDs of our bot accounts and Tweet IDs of all 15,207 Tweets that made it into the 1% Sample API can be found athttp://www.pfeffer.at/data/tampering, so that other re-searchers and practitioners analyzing the affected time period can remove them easily. The accounts were used in rotation to send Tweets. At the same time, we collected data from Twitter’s 1% Sample API and the 10% academic Sample API for the analysis of this article. To identify other user accounts that are over-represented in Twitter’s Sample APIs, we analyzed 220 million Tweets of the 1% Sample API and 2.2 billion Tweets of the 10% academic Sample API (10/1-11/30 2016). Tweets were published with Twitter’s REST API. We used Twitter’s Filter API to collect all Tweets that we have sent with our accounts to ensure that the data we sent was accepted by Twitter and to confirm the timestamps that Twitter’s servers assigned to our Tweets. Twitter APIs were accessed with Python’s Twython package. The times of day shown in the analyses are Coordinated Universal Time (UTC).
3.3 Sentiment analysis
Another very popular method for analyzing Tweets is sentiment analysis [33,64–66], at-taching a score or scores to Tweets representing emotions in the message. In the context of elections, O’Connor et al. [33] used data from the academic 10% Sample API to study the 2008 US Presidental Elections and Wang et al. [67] presented a system for real-time Twitter analysis of the 2012 US Presidential Elections.
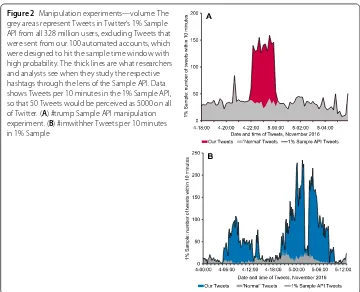
Figure 2Manipulation experiments—volume. The grey areas represent Tweets in Twitter’s 1% Sample API from all 328 million users, excluding Tweets that were sent from our 100 automated accounts, which were designed to hit the sample time window with high probability. The thick lines are what researchers and analysts see when they study the respective hashtags through the lens of the Sample API. Data shows Tweets per 10 minutes in the 1% Sample API, so that 50 Tweets would be perceived as 5000 on all of Twitter. (A) #trump Sample API manipulation experiment. (B) #imwithher Tweets per 10 minutes in 1% Sample
4 Experimental results
Figure 2 shows the results of our interventions related to the #trump as well as the #imwithher hashtags. The gray areas in these two figures represent Tweets in Twitter’s 1% Sample API in 10 minutes time intervals. This figure is provided to give the reader a baseline of the activity. Consequently, we excluded Tweets that were sent from our 100 automated accounts, which were designed to hit the sample time window with high prob-ability. It is important at this point to emphasize two aspects. First, the Tweets in the gray area represent the activity of 328 million monthly active users on Twitter. Second, these Tweets present 1% of the overall activity on Twitter. In other words, 50 Tweets stand for approximately 5000 Tweets within a 10 minute time period.
The red area in Fig.2A represents the 1222 of our 2000 sent Tweets for the #trump experiment that were selected by the Sample API. This rather small number of Tweets was sufficient to quadruple the global activity of a high-frequency hashtag in the Sample API. To picture the potential extent of this manipulation, one needs to consider that, for people analyzing the US Elections by utilizing the Sample API, these 1220 Tweets of the #trump experiment create the wrong impression of being a random 1% sample of about 120,000 Tweets related to this hashtag.
For the #trump experiments, we turned all of our 100 accounts on and off at the same time, which created the steep slopes visible in Fig.2A. Figure2B demonstrates controlled experiments to approximate a pre-defined morenormal looking, i.e. smoother, global time series for the #imwithher hashtag in the 1% Sample API [70]. The result shows that it is possible—aside from short service interruptions in this casea—to create a specific
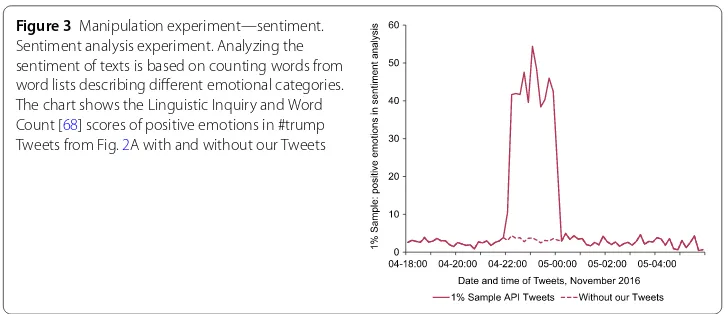
Figure 3Manipulation experiment—sentiment. Sentiment analysis experiment. Analyzing the sentiment of texts is based on counting words from word lists describing different emotional categories. The chart shows the Linguistic Inquiry and Word Count [68] scores of positive emotions in #trump Tweets from Fig.2A with and without our Tweets
Since sentiment analysis generally relies upon analyzing the frequency of words with emotional cues [71], our experimental intervention injected Tweets containing these kinds of words into Twitter’s Sample API. The 2016 US Presidential Election campaign was bit-terly hard-fought, and observers witnessed new and radical styles of social media cam-paigning [72]. To maximize the demonstrated impact of our manipulations, we therefore decided to inject Tweets containing words with encoded positive emotions together with the above-mentioned hashtags. Figure3visualizes a sentiment analysis of positive emo-tions in the Tweets in the 1% Sample API with the #trump hashtag that were also used for the analysis of Fig.2A. The level of positive emotions without our Tweets is unsur-prisingly low. Injecting 1222 Tweets with positive words into the Sample API created a ten-fold increase in the LIWC score [68] for positive emotions, making it outperform all other categories in the Sample API, and changing this analysis substantially.
We ran several experiments to inject Tweets into the 10 millisecond selection time win-dow of the 1% Sample API. During these experiments, 60–90%bof the Tweets we sent
appeared in the data distributed by the 1% Sample API.
Our manipulation experiments focused on the 1% sample. However, our experiments also influenced the 10% academic sample, as the 1% selection time window is part of this 10% selection window (Fig.1).
5 Identifying over-represented accounts
Our approach offers different perspectives on data and can help us to better illuminate concealed systems.
In order to identify patterns of user accounts that are over-represented in Twitter’s 1% Sample API, we collected all data from the 1% Sample API (220 million Tweets from 41 million user accounts) and, to increase the validity of the statistics (see later in this section), from the 10% academic Sample (10-fold number of Tweets from 90 million accounts) in the time period 10/1/2016-11/30/2016. To better understand and explain Twitter’s sam-pling dynamics, we focused the analysis for this article on the 1000 accounts with the most Tweets in the 1% Sample from that time period.
5.1 Suspicious number of days with≥48 tweets each day
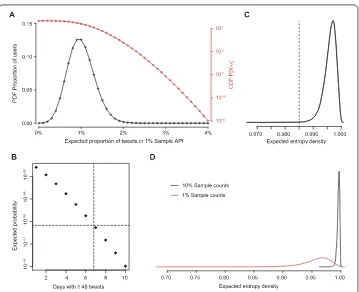
We applied two heuristics to detect over-represented accounts. The first is volume based. Twitter allows a user account to send up to 2400 Tweets per day. Looking for accounts having significantly more than 24 Tweets per day in the 1% Sample is a straightforward approach to identify users potentially tampering with the sampling mechanism. The chal-lenge is to determinesignificantanomalous behavior. In a system with hundreds of mil-lions of active users, some accounts having more than 24 Tweets in the 1% Sample is within statistical expectation. First, we model the sampling events for Tweets as Bernoulli pro-cesses and utilize the binomial distribution to estimate the proportion of Tweets per ac-count that we should find in a random 1% Sample. The curves in Fig.4A visualizes the expected proportion of users having exactlyn% of Tweets (in 0.1% steps) in the 1% Sam-ple API as well as the accumulated probabilities. For an account sending the maximum possible number of Tweets without millisecond tampering, the probability of getting≥48 Tweets (≥2%) into the 1% Sample is 0.3%. 249 of the top 1000 accounts have at least 1 day in the two months’ time period with≥48 Tweets.
Again, out of 328 million monthly active user accounts, a 0.3% chance of having≥2%
Tweets in the 1% Sample still includes about 1 million accounts. That is why we employ a second expectation distribution for determining whether an account is over-represented by chance or as the result of some form of manipulation. We know from the binomial dis-tribution in Fig.4A that the chance is about 3:1000 to have≥2%coverage. The second question now is whether an account is multiple times in the≥48 Tweets/day list within our 61 day observation period and how many days would besignificantfrom random ex-pectation.
5.2 Entropy scores and suspicious entropy scores
The second statistic comes from observation of our own bot accounts. Regular Twit-ter users tweeting at random time inTwit-tervals create uniform millisecond distributions. In other words, there is equal chance for any millisecond [0–999] to be assigned to a Tweet. Non-random tweeting times skew this distribution. Consequently, for identifying poten-tial user accounts that already use our approach, we take a closer look at the distribution of milliseconds. Uneven distributions can be identified with Shannon’s entropy measure [73]H(X) = –ni=1P(xi)log2P(xi) whereP(xi) is the probability of the tweet being posted
at timestampi, andn is the set of timestamps under consideration. Random tweeting time points will result in normalized entropy valuesη(X) =H(X)/log210 very close to 1.0; lower values signal suspicious accounts. Shannon’s entropy [73] was used to identify non-random tweeting behavior because it is an efficient metric for outlier detection [74]. For our data, the values fornormal behavior(based on random timestamps) are in a very narrow range (see next paragraph). Consequently, spotting suspicious (outlier) behavior is easy. However, the challenge is again to define statisticallysignificantanomalous behavior. For our analysis, we calculated entropy scores with the 10% academic Sample API data. For the 10% academic Sample API, Tweets in the millisecond range [657–756] are col-lected. First, milliseconds for all Tweets in this sample per user were extracted and grouped into 10 bins based on milliseconds, i.e. 657–666, 667–676, etc. Here, the first bin equals the 1% Sample API. With the frequencies of Tweets in these 10 bins the entropy scores were calculated for every day of the 61 days observation period.
To identifysignificantlydeviating entropy scores, we applied the following procedure. As we have hundreds of Tweets in the above mentioned 10 bins, the chance of a non-uniform distribution of milliseconds is very low, i.e. the entropy scores resulting from random send-ing times will be very close to the maximum possible score of 1.0. To estimate the range of expected entropy values we took all 10% Sample API Tweets of the top accounts and cre-ated random timestamps. Based on these random timestamps we calculcre-ated the entropy scores. Applying this procedure ten times created the density plot in Fig.4C that shows the expected entropy score distribution for random timestamps. It turns out that expected values can be found in the interval [0.985–1.000] and values lower than that can be treated as suspicious. For the analysis in the next section, we used the average entropy score per day of all days with≥48 Tweets for every account. Therefore, a low average score requires an account to have multiple days with significantly low entropy scores.
5.3 Using 10% data to increase statistical validity
Figure 4Estimating suspicious values. (A) Binomial distribution (n= 1000,p= 0.01) to estimate the expected exact proportion of Tweets per user in the 1% Sample API withn% Tweets in 1% Sample API (PDF, black line) as well as accumulated probabilities (CDF, red line), e.g. 3 out of 1000 users reach at least 2% coverage. (B) Expected probability that an account has≥2% coverage onxdays. The suspicious thresholdp(dashed lines) is set to 1/N, whereN= 328M, the overall number of active Twitter accounts. (C) Expected entropy scores for millisecond distribution of accounts in 10% Sample. Values below 0.985 can be considered as very rare events, i.e. suspicious. (D) Expected entropy density for the 1% Sample and 10% Sample to illustrate that identifying suspicious entropy scores (i.e. outliers) is easier in the 10% Sample
6 Groups of over-represented accounts
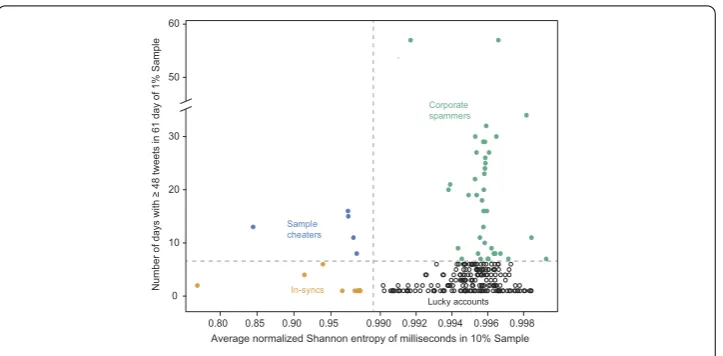
In this section we will provide empirical evidence to show that some user accounts are already over-represented in Twitter’s Sample API. While our findings indicate that there seems to be no intentional large-scale tampering happening during the time-period of our analysis, we are able to prove that there are in fact groups of user accounts that get over-sampledaccidentallyby Twitter’s sampling approach. Combining the above mentioned two statistics, namely entropy and number of days with≥48 Tweets, we identified three types of accounts in the top 1000 accounts in the time period 10/1/2016-11/30/2017 that distort the quality of Twitter’s Sample API as well as additional interesting artifacts: Sam-ple Cheaters, Corporate Spammers, and In-Syncs.
Figure 5Types of over-represented accounts. 249 of the 1000 accounts with the most Tweets in the 1% Sample. Blue: Sample cheaters. Accounts with low entropy score and many days with≥48 Tweets/day are defined as likely cheaters. Green: Corporate spammers. Accounts over-represented on many days but without suspicious entropy scores; all of these accounts can be linked to commercial activity. Yellow: In-syncs. Frequency bots that are temporarily synced with the sampling mechanism. Black: Lucky accounts that are randomly over-represented but show no suspicious characteristics
a.Sample cheaters. We expect cheaters that game the sampling mechanism to have a larger number of days with≥48 Tweets in the sample and show non-uniform millisecond distributions. In the analyzed time period, we found 5 likely cheaters. By also analyzing other time periods, we could identify one dozen likely cheaters. All of the identified likely cheaters link thousands of times to websites, indicating that these are accounts from click-bait websites. Although this is a small number, it gives clear evidence that some users have been already exploiting this avenue to manipulate Twitter’s sample data.
b.Corporate spammers. We identified another 39 accounts in our account sample that had≥48 Tweets per day in the Sample API on≥7 days. Studying these accounts more closely, e.g. by collecting all of their Tweets with the Filter API for several days, we did not find any timestamp irregularities, but many more Tweets than the daily limit would allow. Through manual inspection we found that all of these accounts are related to com-panies or products and it seems that Twitter allows them to exceed the rate limits. For instance, a verified Twitter account of a major credit card company sent≥10, 000 Tweets on multiple days—more than four times the rate limit of ordinary users. It is unclear at that point whether this service comes with a price tag. Recently, Twitter has started to offer that developers can requestelevated POST access.cTo potentially get that elevated
access, Twitter describes a process that requires a “short description of your use case”. We do not know at this point whetherregularspammers will be granted elevated access, but the process suggests that this service is geared towards business accounts.
fall roughly into a constant time range. Each one of these time-triggered accounts has a 1% chance this arrival range is within the sampling time window, i.e. the account accidentally hitting the 1% sampling time window. Any of the successful automated accounts that are accidentally synchronized with Twitter’s sampling time window for a certain amount of time will hit that time window on a regular basis resulting in over-representation of the account in the sample. Conversely, the many that miss this millisecond window will be invisible through the lens of the Sample API. We found 11 (4.5%) frequency bots in our dataset and found similar numbers in other observations. Current research estimates that 9–15% of all accounts on Twitter are bots [58]. Consequently, with 328 million monthly active users, we estimate that about 1.3–2.2 million frequency bots are currently acciden-tally polluting Twitter’s Sample API.
Tweet scheduling tools. By looking at the lower ranked accounts in addition to the top 1000 accounts, we identified another potential source of misrepresentation in Twitter’s 1% Sample API that can be seen ashuman in-syncs. An unknown number of regular human user accounts that employ Tweet scheduling tools might have similar millisecond signa-tures as frequency bots, since time-triggered sending events can have the potential to sync users with Twitter’s servers. However, since human users on average tweet considerably less, the overall impact on sample quality will be negligible in this case.
6.1 In-syncs and the flipped sample
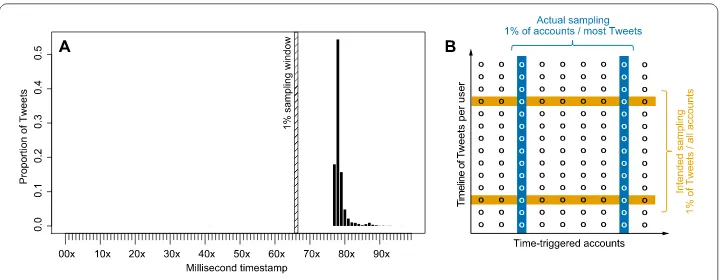
Here, we want to hypothesize the effect that the above mentioned in-syncs can have on Twitter’s sampling procedure. This also shows how decisions related to a system’s design and inner workings can pollute the integrity of a sample. We created a time-triggered fre-quency bot that sent 4512 Tweets, one Tweet exactly every 42 seconds. As the sending events have non-random milliseconds timestamps, the Tweet-IDs also show non-random milliseconds values. Figure6displays the distribution of milliseconds extracted from the Tweet IDs of theses Tweets. 58% of all Tweests are in the 10 milliseconds time interval [778–787] while no single Tweet out of 4500 is in the 1% Sample API selection window. Consequently, Tweets from this account are completely muted from the 1% Sample API.d
It is important to realize at this point, that these results are a random artifact of the send-ing time—no purposeful manipulation was applied for this experiment. However, based on the previously described binomials, the chance for having 4512 consecutive Tweets outside of the 1% Sample API selection window is 1 : 2x10–20. This examples also shows
that the time delay from sending a Tweet till the Tweet is assigned a Tweet ID is fairly stable.
Figure 6Twitter’s tampered samples. (A) Sampling artifact created by a time-triggered frequency bot. For several hours, we sent a Tweet exactly every 42 seconds. The bar-graph shows the distribution of milliseconds of the Tweets’s ID. Most Tweets are in a very narrow range, none is in the 1% Sample API time window. (B) Schematic representation of Tweet selection process for time-triggered accounts (x-axis). Accounts send Tweets (circles) over time (y-axis). Statistically sound sampling would give every Tweet from every account the same chance of being in the sample. Instead, Twitter’s sampling mechanism selects a large amount of Tweets from about 1% of time-triggered frequency accounts for any time period
over-samples accounts based on a feature that has nothing to do with the composition of the Tweet.
7 Proposals for a solution
In this paper we have demonstrated a flaw in the sampling mechanism underpinning Twit-ter’s Sample API. We have demonstrated that this can be used to skew the analysis done from this API. While sampling can be a feature in the sense that it would allow us an scientifically sound view into a large swath of data, this is precluded by Twitter’s biased sampling methodology, which is hampered both by bias by design and purposeful manip-ulation.
The problem stems from Twitter using information in the Tweet itself to decide whether or not a Tweet is selected. An approach that does this will be vulnerable to the same or a similar attack. Fortunately, it is relatively straightforward to design approaches that do not depend on any information in a Tweet. A straightforward approach would be to draw a random number from a binomial distribution with p = 0.01 when a tweet arrives at Twitter’s servers.
However, we do recognize that there might be reasons for Twitter to make the sampling decisionrepeatable. For instance, if a single Tweet is stored in multiple locations and the Sample decisions need to be made decentralized in order to create the same samples in all locations. In this case, the sampling feature needs to depend on information in the Tweet. A minimum change from the current system would be a random set of unconnected mil-liseconds. Hitting a single millisecond is harder, but still possible—we found accounts in our data that had 90+% of all Tweets in a single millisecond. In addition, this set of mil-liseconds could change periodically and the set is calculated from non-Tweet information, e.g. an internal signal.
con-tent or metadata could accidentally bias against Tweets with certain keywords, written in certain languages, or being sent from certain locations.
According to our observations, there are indeed corporate spammersflooding Twit-ter and its data samples with TwitTwit-ter’s permission. This does not just impact the Sam-ple API but also the Filter API in case researchers or practitioners are collecting Tweets including keywords used by these accounts. The problem of corporate spamming could be tackled if Twitter marked accounts that are allowed to exceed rate limits. Analysts could then consider those, improving data quality of both the Sample API and the Filter API.
From researchers’ perspective, the metrics presented in this article offer methods to identify and remove this kind of over-sampled accounts from Twitter’s Sample API and can serve as features for bot detection.
8 Discussion and conclusion
Twitter has become thede factocore dataset for computational social science, and a large share of literature analyzing social media relies on samples drawn from its platform. De-spite being one of the most open social media companies in terms of sharing data, even Twitter does not reveal details about its data handling and sampling strategies. Statisti-cal validity and sampling techniques are at the heart of every empiriStatisti-cal research design and are crucial for correct analysis and valid results. Whereas the randomness of random samples allows researchers to interpret their results in reference to the full dataset, the observed sampling technique based on the Sample API does not give all data points an equal chance of being selected.
Our insights into the flaws in Twitter’s supplied sampling mechanism confirm and even amplify a broad concern: Twitter cannot provide scientifically sound random samples via its Sample API.eMoreover, by making Tweets appear up to 84 times more likely in the
sample than expected, it is possible to deliberately influence the extent and content of any topic in the Sample API. The data are also tampered by automated accounts or bots through the unintentional side effects of platform logic and system architecture. Conse-quently, any account can be used to manipulate the analyses of researchers, journalists, and policymakers trusting that data source.
Our experiments followed careful considerations in order to limit the extent and time of our intervention (see Appendix1: Research Ethics Statement). Our experiments were per-formed with 100 Twitter accounts that we had manually created for the purpose of these experiments. All experiments were conducted on a single office computer. Even though the resources needed for these experiments were very small, the impact on major topics was clearly visible; all of this was done just a few days before the very contested 2016 US Presidential Election. Based on state-of-the-art bot research [58], we would expect 30–50 million bot accounts on Twitter. There is evidence in the scientific literature for bot farms that harness hundreds or even thousands of times the number of accounts used in our experiments [75]. Every single one of these bot farms has greater potential to manipulate Twitter’s Sample API at any given point and for longer periods of time.
the same vulnerability for the costly data sample, unless Twitter has additional mecha-nisms that protect the integrity of this sample. From all we know, paying thousands of Dollars a month for elevated access does most likely not prevent potentially tampered data.
While the biases and potential tampering illustrated in this article are not inherent to big data as a methodology for the social sciences, the results of our analyses illustrate critical issues that come from doing research with proprietary data and undisclosed details about data handling. This problem points to a characteristic misconception of current expectations of big social data: most of the time we cannot work with full datasets due to constraints in methodological, infrastructural, and financial resources, so we rely on sampling.
Social media analytics are still met with high expectations, despite the nebulous under-standing of big data and the challenges of their handling and analysis. Evidence-based pol-icy making and data-driven modes of governance however need to take into account that they are at the mercy of data quality and sampling/filtering techniques. In daily research routines of social media analytics and big social data, we do not work on entire popula-tions. Predictive methods and profiling approaches too often rely on access to samples of social media data and need to trust black box interfaces. Therefore, the need for sampling is not “an artifact of a period of information scarcity” [76]; in fact, it is even more of a necessity in times of information abundance.
Our study points to some of the pitfalls of regarding Twitter research as an end in it-self and calls for responsible handling of Twitter data. To make Twitter a reliable data source for future research, especially in the social sciences, we must find ways to cre-ate scientifically sound samples from these data streams. The sharing of data should al-ways be accompanied by open methods and transparent algorithms to give researchers and practitioners a fair chance to better know and assess the data at hand. Increasing the transparency of data collection and the integrity of research design and analysis should be in the interest of both the social media industry and the research community and would also enhance public trust in the methods and findings of computational social sci-ence.
Appendix 1: Research ethics statement
research in their fields and in the particular research context.”(National Academies Press, 2014: 4).
A.1 Minimizing risk and intervention
However, we are aware that just because data is publicly available does not mean that rules for research ethics do not apply. Our realistic experiment was carefully designed for minimal risk and intervention. It was necessary to further reverse-engineer the sampling process to get authentic insights into the architecture and logic of the plat-form.
Our study design does not focus on interaction or intervention with individual Twit-ter users. On the contrary, we created TwitTwit-ter accounts for the purpose of our study that did not aim at establishing individual interactions on the social media platform. Our ex-periment aims at making visible how user interactions with the service and its technical architecture work. Our research has nevertheless an interventional dimension directed to the data and not to the users, which is necessary to test and document the possible ways of manipulation of data sampling on the Twitter platform. By doing so, we did violate Twitter’sAutomation rules, in particular the “Do not abuse the Twitter API or attempt to circumvent rate limits” rule. This was necessary since Twitter does not reveal its sampling method in detail, which would be essential for research integrity of studies using these data. However, we took the following measures to make these interventions as subtle as possible:
(A) User IDs of our bot accounts can be found in Appendix 2of this article. Tweet IDs of all our 15,207 Tweets that made it into the 1% Sample API can be found at
http://www.pfeffer.at/data/tampering, so that other researchers and practitioners analyz-ing the affected time-period can remove them easily.
(B) We have deleted all our Tweets after the experiments. When Tweets are deleted, a delete-message is sent via the Streaming APIs. According to Twitter’s terms of use, peo-ple who collect data with these APIs are requested to delete all Tweets for which delete-messages are sent. Deleting a Tweet also covers Retweets, as all Retweets of a deleted Tweet also get deleted from Twitter, and consequently, delete-messages for the Retweets are sent via the Streaming APIs.
(C) We did not try to hide our Tweets and our Tweets did not deliver any specific message. In contrary, the content of our Tweets was random, except for the two hash-tags #imwithher and #trump. The Tweets were either created by randomly selecting text from other people’s Tweets or, in case of the sentiment experiments by randomly selecting words marked as “positive emotions” in the LIWC [68] dictionary. Here are some exam-ples of random Tweets for the #trump sentiment analysis experiment:
• #trump plays shares casual luck loves
• #trump goodness careful sunniest appreciate helps • #trump true value truly yay free
Appendix 2: Accounts used in our experiments
In order to send the Tweets for our experiments, we created these 100 Twitter accounts: beatriz_kittle JuergenTest MclemoreDonny rolandbass5611 BiancaBerends juniorfritz5321 MercedezLohse RubyePuls brendapenn1741 kacie_mccart MinnaBruning RuggHeide broderick_komar kalis_mikel ModeArletha sanjuanacolung1 bromley_arvilla karri_sin NakayamaAilene SantoHedrick charlettebeauv2 kelly_stoneking nannettemarkow2 SchoemakerFay costin_neal KinzerJerold NellieGoodlett SchurgDorian danelleschroet2 KoskiCatheryn nicolasabanner2 SellnerDinah delpino_derek KymberlyCamburn NidiaDabney SerinaLasker delvalle_lavada LaphamElois NinjaGilbertjef SobelSheron Diesel_Lenard LockeClint NorbergBerenice StaceyMuszynski EmikoBeckwith lorainepreside2 ObduliaBurgoon stefaniaheinze1 EnriqueBorman lorene_wilhite OrickJacque SteffanieKoger fredrickairahet luigiweatherbe1 packard_rosana taraconnor3741 GemaDwight LumsdenAlmeda ProwellMaragret TemikaPlatt GeralynGaulke LunaGarman PuleoJung TheaParmelee GordilloSalvad lyda_trinity purkey_rickey TillieKoziol GreggBourgeois MarciaBeaudette PushardAlysia TokarLatesha HaworthAsia marcotte_shon PyburnEmmett tracisolis9531 HiebertJanyce margoriemcnaug2 quincymarc192 TwistedPainelis hy_junita MargrettJoachim RebekahLacoste VanishHans jalisakirkwood1 MaroisChristene RexAlvardo VicentaDebow JesusaAxley marquettachron2 riley_bently VickisabatSabat JinkinsDanielle MarrowCaryn RisaCaraballo YokoyamaBreanna JohnieBreneman MatzLucretia RohdeEulah ZiemannLarry
Acknowledgements
We are grateful to David Lazer, Derek Ruths, and Kenneth Joseph for providing valuable feedback as well as to Brendan O’Connor for assistance with data collection.
Funding
This work was supported by the German Research Foundation (DFG) and the Technical University of Munich within the funding program Open Access Publishing.
List of Abbreviations
API, Application Programming Interfaces; REST API, Representational State Transfer; UTC, Coordinated Universal Time; LIWC, Linguistic Inquiry and Word Count.
Availability of data and materials
A discussion of ethical considerations is presented in Appendix1. Accounts used for experiments are listed in Appendix2. IDs of all our Tweets in the 1% Sample API can be found atwww.pfeffer.at/data/tampering. Source code of Python scripts is available in Github repository:https://github.com/fredzilla/sample-api-timings.
Competing interests
The authors are neither affiliated with nor in collaborative agreements with Twitter or any competing social networking platform.
Authors’ contributions
All authors contributed equally to all parts of the article. All authors read and approved the final manuscript.
Author details
1Bavarian School of Public Policy, Technical University of Munich, Munich, Germany.2Institute for Software Research,
Carnegie Mellon University, Pittsburgh, USA. 3Information Sciences Institute, University of Southern California, Marina Del
Endnotes
a Looking at Fig.2B, between the first and last Tweet from our accounts (the blue area) several time periods with none or very little of our Tweets are in the data. While the lack of Tweets on Nov. 4, 3pm–8pm is on purpose, the negative spikes on Nov. 4, 1pm and Nov. 5, 2am are the result of our sending script being interrupted. b Success rate depends on Internet connection speed and stability of web traffic to a Twitter server.
c Rate limit enforcement update posted on October 22, 2018. Source:
https://twittercommunity.com/t/new-post-endpoint-rate-limit-enforcement-begins-today/115355
d This experiment was conducted in early December 2017.
e All biases and potential tampering found in this article only affect the Sample API, not the REST and Filter APIs.
Publisher’s Note
Springer Nature remains neutral with regard to jurisdictional claims in published maps and institutional affiliations.
Received: 12 December 2017 Accepted: 11 December 2018
References
1. Boyd D, Golder S, Lotan G (2010) Tweet, tweet, retweet: conversational aspects of retweeting on Twitter. In: System sciences (HICSS), 2010 43rd Hawaii international conference on. IEEE, New York, pp 1–10
2. Shirky C (2011) The political power of social media: Technology, the public sphere, and political change. Foreign affairs 28–41
3. Lazer D, Pentland A, Adamic L, Aral S, Barabási A-L, Brewer D, Christakis N, Contractor N, Fowler J, Gutmann M, Jebara T, King G, Macy M, Roy D, Alstyne MV (2009) Computational social science. Science 323(5915):721–723.
https://doi.org/10.1126/science.1167742
4. Gayo-Avello D (2013) A meta-analysis of state-of-the-art electoral prediction from Twitter data. Soc Sci Comput Rev 31(6):649–679.https://doi.org/10.1177/0894439313493979
5. Palen L, Anderson KM (2016) Crisis informatics—new data for extraordinary times. Science 353(6296):224–225.
https://doi.org/10.1126/science.aag2579
6. Sakaki T, Okazaki M, Matsuo Y (2010) Earthquake shakes Twitter users: real-time event detection by social sensors. In: Proceedings of the 19th international conference on World Wide Web. WWW ’10. ACM, New York, pp 851–860.
https://doi.org/10.1145/1772690.1772777
7. Agichtein E, Castillo C, Donato D, Gionis A, Mishne G (2008) Finding high-quality content in social media. In: Proceedings of the 2008 international conference on web search and data mining. ACM, New York, pp 183–194 8. Steinert-Threlkeld ZC, Mocanu D, Vespignani A, Fowler J (2015) Online social networks and offline protest. EPJ Data
Sci 4(1):19
9. Hughes AL, Palen L (2009) Twitter adoption and use in mass convergence and emergency events. Int J Emerg Manag 6(3/4):248–260
10. Olteanu A, Castillo C, Diaz F, Kiciman E (2016) Social data: Biases, methodological pitfalls, and ethical boundaries. SSRN Scholarly Paper ID 2886526, Social Science Research Network, Rochester, NY
11. Ruths D, Pfeffer J (2014) Social media for large studies of behavior. Science 346(6213):1063–1064
12. González-Bailón S, Wang N, Rivero A, Borge-Holthoefer J, Moreno Y (2014) Assessing the bias in samples of large online networks. Soc Netw 38:16–27.https://doi.org/10.1016/j.socnet.2014.01.004
13. Bruns A, Stieglitz S (2012) Quantitative approaches to comparing communication patterns on Twitter. J. Technol. Hum. Serv. 30(3–4):160–185.https://doi.org/10.1080/15228835.2012.744249
14. Driscoll K, Walker S (2014) Big data, big questions—working within a black box: transparency in the collection and production of big Twitter data. Int J Commun 8:20
15. Burgess J, Bruns A (2015) Easy data, hard data: the policies and pragmatics of Twitter research after the computational turn. In: Compromised data: from social media to big data, pp 93–111
16. Elmer G, Langlois G, Redden J (2015) Compromised data: from social media to big data. Bloomsbury Publishing, New York
17. Gaffney D, Puschmann C (2013) Data collection on Twitter, pp. 55–67. Peter Lang, New York
18. Howison J, Wiggins A, Crowston K (2011) Validity issues in the use of social network analysis with digital trace data. J Assoc Inf Syst 12:2
19. Hannak A, Soeller G, Lazer D, Mislove A, Wilson C (2014) Measuring price discrimination and steering on e-commerce web sites. In: Proceedings of the 2014 conference on Internet measurement conference, pp 305–318
20. King G (2011) Ensuring the data rich future of the social sciences. Science 331:719–721
21. Chen L, Mislove A, Wilson C (2015) Peeking beneath the hood of uber. In: Proceedings of the 2015 Internet measurement conference. IMC ’15. ACM, New York, pp 495–508.https://doi.org/10.1145/2815675.2815681
22. Eslami M, Rickman A, Vaccaro K, Aleyasen A, Vuong A, Karahalios K, Hamilton K, Sandvig C (2015) I always assumed that I wasn’t really that close to [her]: reasoning about invisible algorithms in news feeds. In: Proceedings of the 33rd annual ACM conference on human factors in computing systems, pp 153–162
23. Williams SA, Terras MM, Warwick C (2013) What do people study when they study Twitter? Classifying Twitter related academic papers. J Doc 69(3):384–410
24. Zimmer M, Proferes NJ (2014) A topology of Twitter research: disciplines, methods, and ethics. Aslib J Inf Manag 66(3):250–261
25. Rosenthal S, Farra N, Nakov P (2017) Semeval-2017 task 4: sentiment analysis in Twitter. In: Proceedings of the 11th international workshop on semantic evaluation (SemEval-2017), pp 502–518
26. Bastos MT (2015) Shares, pins, and tweets: news readership from daily papers to social media. Journalism Studies 16(3):305–325
28. Nielsen RK, Schrøder KC (2014) The relative importance of social media for accessing, finding, and engaging with news: an eight-country cross-media comparison. Digital Journalism 2(4):472–489
29. Ausserhofer J, Maireder A (2013) National politics on Twitter: structures and topics of a networked public sphere. Inf Commun Soc 16(3):291–314
30. Neuberger C, vom Hofe J, Nuernbergk C (2014) The use of Twitter by professional journalists. results of a newsroom survey in Germany. In: Weller K, Bruns A, Burgess J, Mahrt M, Puschmann C (eds) Twitter and society. Peter Lang, New York, pp 345–357
31. Lasorsa DL, Lewis SC, Holton AE (2012) Normalizing Twitter: journalism practice in an emerging communication space. Journalism Studies 13(1):19–36
32. Varol O, Ferrara E, Menczer F, Flammini A (2017) Early detection of promoted campaigns on social media. EPJ Data Sci 6(1):13
33. O’Connor B, Balasubramanyan R, Routledge BR, Smith NA (2010) From tweets to polls: linking text sentiment to public opinion time series. ICWSM 11(1–2):122–129
34. Wang W, Chen L, Thirunarayan K, Sheth AP (2014) Cursing in English on Twitter. In: Proceedings of the 17th ACM conference on computer supported cooperative work and social computing, pp 415–425
35. Shao C, Hui P-M, Wang L, Jiang X, Flammini A, Menczer F, Ciampaglia GL (2018) Anatomy of an online misinformation network. PLoS ONE 13(4), e0196087
36. Tufekci Z (2014) Big questions for social media big data: representativeness, validity and other methodological pitfalls. In: Proceedings of the eigth international AAAI conference on weblogs and social medi. AAAI Press, Menlo Park, pp 505–514
37. Mislove A, Lehmann S, Ahn Y-Y, Onnela J-P, Rosenquist JN (2011) Understanding the demographics of Twitter users. In: Proceedings of the fifth international AAAI conference on weblogs and social media, pp 554–557
38. Malik MM, Lamba H, Nakos C, Pfeffer J (2015) Population bias in geotagged tweets. In: ICWSM workshop on standards and practices in large-scale social media research
39. Crawford K, Finn M (2015) The limits of crisis data: analytical and ethical challenges of using social and mobile data to understand disasters. GeoJournal 80(4):491–502
40. Malik MM, Pfeffer J (2016) Identifying platform effects in social media data
41. Lazer D, Kennedy R, King G, Vespignani A (2014) The parable of Google flu: traps in big data analysis. Science 343(6176):1203–1205.https://doi.org/10.1126/science.1248506
42. Kergl D, Roedler R, Seeber S (2014) On the endogenesis of Twitter’s Spritzer and Gardenhose sample streams. In: 2014 IEEE/ACM international conference on advances in social networks analysis and mining (ASONAM), pp 357–364.
https://doi.org/10.1109/ASONAM.2014.6921610
43. Morstatter F, Dani H, Sampson J, Liu H (2016) Can one tamper with the sample api?: toward neutralizing bias from spam and bot content. In: Proceedings of the 25th international world wide web conference, pp 81–82 44. Burgess J, Bruns A (2016) Easy data, hard data: the policies and pragmatics of Twitter research after the
computational turn. In: Compromised data: from social media to big data, pp 93–111
45. Elmer G, Langlois G, Redden J (2015) Compromised data: from social media to big data. Bloomsbury Publishing, USA 46. Weller K, Bruns A, Burgess J, Mahrt M, Puschmann C Twitter and Society, vol. 89. P. Lang
47. Joseph K, Landwehr PM, Carley KM (2014) Two 1%s don’t make a whole: comparing simultaneous samples from Twitter’s streaming api. In: International conference on social computing, behavioral-cultural modeling, and prediction. Springer, Berlin, pp 75–83
48. Yates A, Kolcz A, Goharian N, Frieder O (2016) Effects of sampling on Twitter trend detection. In: Proceedings of the tenth international conference on language resources and evaluation (LREC 2016), Paris, France
49. Morstatter F, Pfeffer J, Liu H, Carley KM (2013) Is the sample good enough? Comparing data from Twitter’s streaming api with Twitter’s firehose. In: Seventh international AAAI conference on weblogs and social media
50. Cihon P, Yasseri T (2016) A biased review of biases in twitter studies on political collective action. At the Crossroads: lessons and Challenges in Computational Social Science 91
51. Morstatter F, Pfeffer J, Liu H (2014) When is it biased?: assessing the representativeness of Twitter’s streaming api. In: Proceedings of the 23rd international conference on World Wide Web. ACM, Seoul, pp 555–556
52. Crawford K, Gray ML, Miltner K (2014) Big data—critiquing big data: politics, ethics, epistemology—special section introduction. Int J Commun 8:10
53. Gerlitz C, Rieder B (2013) Mining one percent of Twitter: collections, baselines, sampling. M/C Journal 16(2):1–18 54. Wagner C, Singer P, Karimi F, Pfeffer J, Strohmaier M (2017) Sampling from social networks with attributes. In:
Proceedings of the 26th international conference on World Wide Web. WWW ’17, pp 1181–1190
55. Lamba H, Hooi B, Shin K, Falousos C, Pfeffer J (2017) Zoorank: ranking suspicious activities in time-evolving tensors. In: ECML PKDD, the European conference on machine learning and principles and practice of knowledge discovery in databases (ECML-PKDD)
56. Lee K, Eoff BD, Caverlee J (2011) Seven months with the devils: a long-term study of content polluters on twitter 57. Ferrara E, Varol O, Davis C, Menczer F, Flammini A (2016) The rise of social bots. Commun ACM 59(7):96–104 58. Varol O, Ferrara E, Davis CA, Menczer F, Flammini A (2017) Online human-bot interactions: detection, estimation, and
characterization pp 280–289
59. Hegelich S, Janetzko D (2016) Are social bots on twitter political actors? Empirical evidence from a ukrainian social botnet pp 579–582
60. Ratkiewicz J, Conover M, Meiss M, Gonçalves B, Flammini A, Menczer F (2011) Detecting and tracking political abuse in social media. In: ICWSM
61. Lee S, Kim J (2014) Early filtering of ephemeral malicious accounts on Twitter. Comput Commun 54:48–57 62. Chu Z, Gianvecchio S, Wang H, Jajodia S (2010) Who is tweeting on Twitter: human, bot, or cyborg?. In: Proceedings
of the 26th annual computer security applications conference. ACM, New York, pp 21–30
63. Lee K, Eoff BD, Caverlee J (2011) Seven months with the devils: a long-term study of content polluters on Twitter. In: ICWSM. Citeseer
65. Pak A, Paroubek P (2010) Twitter as a corpus for sentiment analysis and opinion mining. In: International conference on language resources and evaluation, Valetta, Malta
66. Tumasjan A, Sprenger TO, Sandner PG, Welpe IM (2010) Predicting elections with Twitter: what 140 characters reveal about political sentiment. In: Fourth international AAAI conference on weblogs and social media
67. Wang H, Can D, Kazemzadeh A, Bar F, Narayanan S (2012) A system for real-time Twitter sentiment analysis of 2012 U.S. presidential election cycle. In: Proceedings of the ACL 2012 system demonstrations. ACL ’12. Association for Computational Linguistics, Stroudsburg, pp 115–120
68. Pennebaker JW, Booth RJ, Francis ME (2007) Linguistic inquiry and word count: Liwc [computer software]. Austin, TX: liwc. net
69. Hutto C, Gilbert E (2014) Vader: a parsimonious rule-based model for sentiment analysis of social media text. In: Eighth international AAAI conference on weblogs and social media
70. de Saint-Exupéry A (1943) The Little Prince. Reynal & Hitchcock, New York
71. Pang B, Lee L (2008) Opinion mining and sentiment analysis. Found Trends Inf Retr 2(1-2), 1–135
72. Howard PN, Kollanyi B, Woolley S (2016) Bots and automation over twitter during the us election. Computational Propaganda Project: working Paper Series
73. Shannon CE (1948) A mathematical theory of communication. Bell Syst Tech J 27:379–423623656
74. Daneshpazhouh A, Sami A (2014) Entropy-based outlier detection using semi-supervised approach with few positive examples. Pattern Recognit Lett 49:77–84
75. Echeverria J, Zhou S (2017) Discovery, retrieval, and analysis of the ’star wars’ botnet in Twitter. In: Proceedings of the 2017 IEEE/ACM international conference on advances in social networks analysis and mining 2017, pp 1–8 76. Mayer-Schönberger V, Cukier K (2013) Big data: a revolution that will transform how we live, work, and think.