R E S E A R C H
Open Access
Using the Biocheck.UGent
™
scoring tool in
Irish farrow-to-finish pig farms: assessing
biosecurity and its relation to productive
performance
Maria Rodrigues da Costa
1,2*, Josep Gasa
2, Julia Adriana Calderón Díaz
1, Merel Postma
3, Jeroen Dewulf
3,
Gerard McCutcheon
4and Edgar Garcia Manzanilla
1,5Abstract
Background:Biosecurity is one of the main factors affecting disease occurrence and antimicrobial use, and it is associated with performance in pig production. However, the importance of specific measures could vary depending on the (national) context. The aim of this study was to describe the biosecurity status in a cohort of Irish pig farms, to investigate which of those biosecurity aspects are more relevant by using the Biocheck.UGent™scoring system, and to study the impact of such aspects on farm performance.
Results:External biosecurity score was high compared to most countries due to the characteristics of the Irish pig sector (i.e. purchasing only semen and breeding gilts on farm). The internal biosecurity score was lower and had greater variability among farms than other EU countries. Using multivariable linear regression, the biosecurity practices explained 8, 23, and 16% of variability in piglet mortality, finisher mortality, and average daily gain, respectively. Three clusters of farms were defined based on their biosecurity scores (0 to 100) using principal components and hierarchical clustering analysis. Scores for clusters 1, 2 and 3 were (mean ± SD) 38 ± 7.6, 61 ± 7.0 and 66 ± 9.8 for internal and 73 ± 5.1, 74 ± 5.3 and 86 ± 4.5 for external biosecurity. Cluster 3 had lower piglet mortality (P =0.022) and higher average daily gain (P =0.037) when compared to cluster 2.
Conclusions:Irish farms follow European tendencies with internal biosecurity posing as the biggest liability. Our results suggest that practices related to the environment and region, feed, water and equipment supply, and the management of the different stages, need to be addressed in lower performing farms to improve productive performance. Further studies on the economic impact of these biosecurity practices including complementary data on herd health, gilt rearing, piglet management, vaccination and feeding strategies are needed.
Keywords:Biosecurity, Efficiency, Ireland, Productive performance, Swine production
Background
Pig production is the third biggest agricultural activity in Ireland [1], with a self-sufficiency of 219% [2]. In 2016, there were approximately 150,000 breeding sows, produ-cing an estimate of 4,000,000 pigs per year [2]. The Irish pig sector has identified animal health and management
as key inputs for productivity, and highlighted that the biggest challenges in the Irish setting are the control of endemic diseases, the prevention of introduction of exotic diseases, and the reduction of the use of antimi-crobials, among others [1]. In the last few years, biose-curity practices have been widely discussed. On-farm biosecurity protects farms from disease by preventing pathogenic agents to enter (external biosecurity) or spreading once inside the farm (internal biosecurity, which can also overlap with management). Good biose-curity practices were related to improved performance, * Correspondence:[email protected]
1
Pig Development Department, Teagasc - Animal & Grassland Research and Innovation Centre, Moorepark, Fermoy, Co. Cork, Ireland
2Departament de Ciència Animal i dels Aliments, Facultat de Veterinaria,
Universitat Autònoma de Barcelona, Bellaterra, 08193 Barcelona, Spain Full list of author information is available at the end of the article
better financial return for farmers [3, 4], and to a low use of antimicrobials [5,6]. Moreover, few studies provide quantitative data effectively linking production perform-ance to biosecurity [5,7,8]. The Biocheck.UGent™scoring system developed by Gent University [9] assesses biose-curity using a risk assessment approach and it has been successfully applied in several EU countries [3, 10, 11]. Postma et al. [3] showed that biosecurity has moderate correlations to production performance in four European countries (Belgium, France, Germany, Sweden) and con-cluded that biosecurity practices vary with the country. This indicates that characterization and contextualization of the pig sector in each national setting are important to understand the connection between biosecurity and per-formance [11]. For research purposes, this contextualization is difficult when the methods used across countries are not the same. However, record keeping and benchmarking within and between countries are necessary tools for an ef-ficient and competitive sector. In this study, we aimed to describe biosecurity status in Irish pig farms, to investigate which biosecurity aspects were more relevant by using the Biocheck.UGent™scoring system, and to study the impact of such aspects on farm performance.
Methods
Fifty-eight Irish pig farms were scored between February and May 2016 using the biosecurity scoring system Bio-check.UGent™. Performance data for 2016 for these farms were retrieved from Teagasc e-Profit Monitor (ePM) – a national herd monitoring system – and the effect of the biosecurity practices on selected productive performance indicators was estimated.
Farm selection
The Teagasc ePM is a herd monitoring system available on a voluntary basis to all the farmers in the Republic of Ireland. In 2016, it included 129 pig herds representing over 96,000 sows or 65% of the national commercial sow herd. All the farmers providing data to the ePM were of-fered the biosecurity assessment of their farrow-to-finish farms using Biocheck.UGent™ and 58 farmers partici-pated voluntarily. Farms were recruited through the Tea-gasc advisory service and represent approximately 29% of the national commercial sow population.
Biosecurity assessment
Four researchers visited farms and interviewed farmers to complete the Biocheck.UGent™ questionnaire. All in-terviewers were trained to conduct the questionnaire. The training provides the criteria to frame the questions and provides examples on how to complete the question-naire given different scenarios to reduce inter-observer variability. A detailed description of the questionnaire and its scores was explained by Backhans et al. [12] and
Laanen et al. [5]. Briefly, the questionnaire has 109 closed questions grouped in 12 categories corresponding to ei-ther external (six categories) or internal biosecurity (six categories). Each category assesses several practices and its score was given in a rank from 0 (worst scenario) to 100 (best scenario). Each question had a fixed score. Ex-ternal and inEx-ternal biosecurity scores were computed as a weighted average of the scores achieved in the corre-sponding categories. Overall biosecurity was computed as the average of external and internal biosecurity scores. A paper copy of the questionnaire was completed at the farm with both farmer and researcher and the results were transcribed to the Biocheck.UGent™ online database and Microsoft Office Excel format. The final scores for each biosecurity category were obtained for each farm and were used for the analysis.
Performance data
Performance data for the year 2016 were retrieved from the Teagasc ePM database for all 58 farms included in the study. ePM data was collected on farms every tri-mester with the support of Teagasc advisors and collated into a single database. This information was used to pro-duce the yearly National Pig Herd Performance Report [13], and for different international comparisons like the InterPIG report [14]. The productive performance indi-cators selected for analysis in the present study were pig-let (pre-weaning) and finisher mortality (%), number of pigs produced per sow per year, average daily gain (ADG, g/day) corresponding to the period from weaning to finish, and feed conversion ratio (FCR), corresponding to the same period.
Statistical analysis
categories’ scores. When fitting the model for piglet mortality, biosecurity scores related to the nursery and finishing unit management were left out. A forward re-gression approach was used to improve the models fitted (ols_step_forward function from the olsrr package in R [16]), using a cut-off value of 0.15 for predictor retention in the model. Predictors collinearity was further checked using Variance Inflation Criterion (VIF) from the R package rms [17]. Finally, for each model, residuals’ nor-mality was visually assessed. A simple linear model fit-ting internal biosecurity scores from external scores was also done.
To identify the most relevant biosecurity aspects in Irish pig farms, a Principal Component Analysis (PCA) was also performed on the biosecurity categories and the 2 main dimensions for the principal components were described. After this, Hierarchical Clustering Analysis was used to group farms according to their similarities regarding their internal and external biosecurity prac-tices. Biosecurity scores and productive performance for each cluster were compared by ANOVA followed by Tukey’s correction.
Results
Farm characteristics
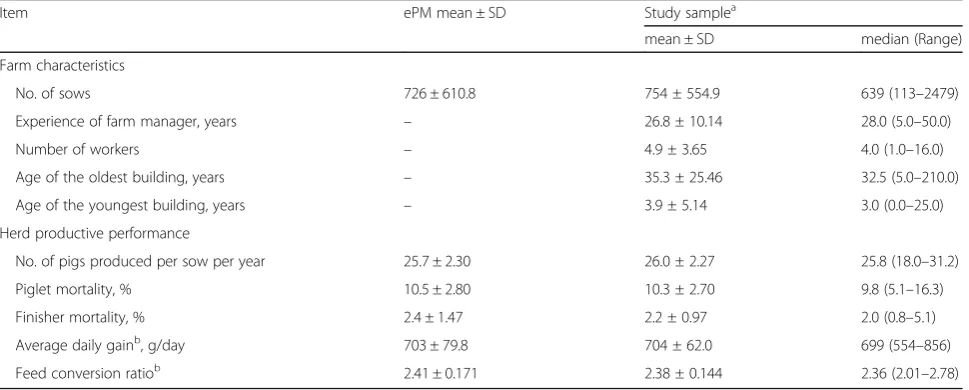
Table 1 summarizes the characteristics of the 58 pig farms included in this study. The farms employed farm managers with an average of 26.8 ± 10.14 years of experi-ence. The number of sows (hereinafter, average herd size) was strongly correlated to the number of workers on farm (rs= 0.92, P< 0.001) with a ratio of one worker
per 154 ± 34.1 sows (range = 55–210). Although the
oldest farm buildings in which pigs were kept were on average 35.3 ± 25.46 years old, this figure includes a farm which was 210 years old (range = 5–210). The second oldest farm was 60 years old. The youngest buildings were on average 3.9 ± 5.14 years old with some farms reporting to be building new accommodation at the time (range = 0–25). In this study, 34.5% of the farms re-ported keeping other animals (cattle) for commercial purposes on the farm grounds. Of those farms, 50% kept beef and 55% kept dairy cattle. One farm kept sheep be-sides beef. Farm characteristics and herd productive performance (Table 1) did not differ between farms keeping other animals for commercial purposes and farms keeping only pigs, except for ADG (740 ± 57.1 vs. 685 ± 56.3 g/day, respectively; P< 0.001).
Farm productive performance
The average herd size of the farms included in the study was 754 sows (range = 113–2479). All the values obtained for productive performance indicators were in the inter-quartile range for the InterPIG report [14], except for piglet mortality which is on the lowest 25%. For ADG, in Ireland it included the period from weaning (29 ± 3.7 d; 7.1 ± 0.46 kg) to finish (107 ± 5.2 kg live-weight). Piglet and finisher mortality showed great variability across farms with a coefficient of variation (CV) of 28.7 and 44.7%, respectively. The number of pigs produced per sow per year, ADG (g/day), and FCR showed less than 10% variability across farms (CV = 8.7, 8.8, and 5.9%, respect-ively). Between the study sample and the ePM population, differences were found only in the variance of finisher mortality (%) and ADG (g/day) (P> 0.001 andP = 0.037,
Table 1Description of the sample of 58 Irish farrow-to-finish pig farms used in the 2016 biosecurity assessment and comparison to the Teagasc database (ePM) population (n= 129)
Item ePM mean ± SD Study samplea
mean ± SD median (Range)
Farm characteristics
No. of sows 726 ± 610.8 754 ± 554.9 639 (113–2479)
Experience of farm manager, years – 26.8 ± 10.14 28.0 (5.0–50.0)
Number of workers – 4.9 ± 3.65 4.0 (1.0–16.0)
Age of the oldest building, years – 35.3 ± 25.46 32.5 (5.0–210.0)
Age of the youngest building, years – 3.9 ± 5.14 3.0 (0.0–25.0)
Herd productive performance
No. of pigs produced per sow per year 25.7 ± 2.30 26.0 ± 2.27 25.8 (18.0–31.2)
Piglet mortality, % 10.5 ± 2.80 10.3 ± 2.70 9.8 (5.1–16.3)
Finisher mortality, % 2.4 ± 1.47 2.2 ± 0.97 2.0 (0.8–5.1)
Average daily gainb, g/day 703 ± 79.8 704 ± 62.0 699 (554–856)
Feed conversion ratiob 2.41 ± 0.171 2.38 ± 0.144 2.36 (2.01–2.78)
a
Farm characteristics retrieved from the Biocheck.UGent™scoring tool which was applied to 58 Irish farrow-to-finish pig farms from February to May 2016. The correspondent herd productive performance was retrieved from the Teagasc ePM for the year 2016
b
respectively), but not in their means. No other differences regarding means or variance were found (P> 0.05) across average herd size, piglet mortality (%), number of pigs per sow per year, or FCR.
Biosecurity scores
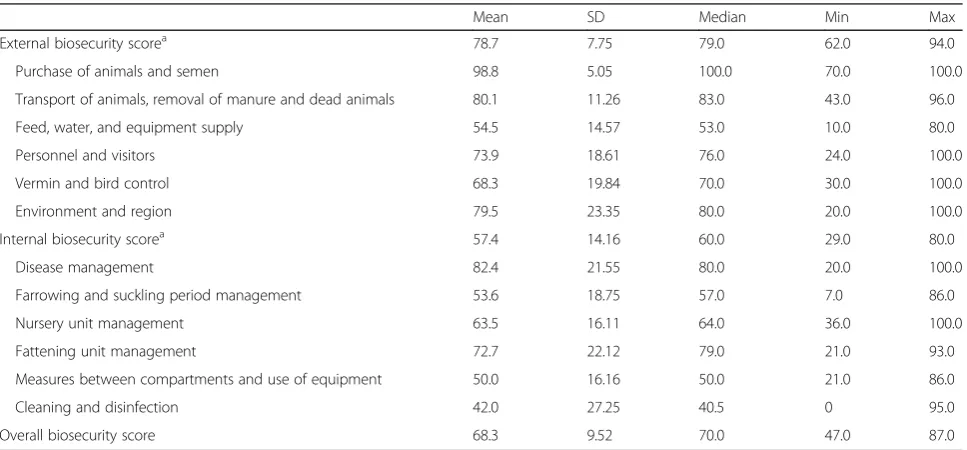
The response rate was 100% for all the questions in the questionnaire. The results of the biosecurity assessment are presented in Table2. The overall biosecurity score was 68.3 ± 9.52. Total external biosecurity scored higher than internal biosecurity (P< 0.001) and its practices were ap-plied consistently across farms (CV = 9.8%). The highest score in this category was achieved in the category pur-chase of animals and semen (98.8 ± 5.05, range = 70–100). The lowest score in this category was in the feed, water, and equipment supply (54.5 ± 14.57). Regarding internal biosecurity, disease management scored the highest with 82.4 ± 21.55, and cleaning and disinfection obtained the lowest score (42.0 ± 27.25) with 12.1% of the farms not ap-plying any of these practices (score 0).
Effect of biosecurity scores and farm characteristics on productive performance
The number of workers was left out of the predictors due to collinearity with average herd size (rs= 0.92,P< 0.001).
Among the biosecurity categories, the purchase of animals and semen was also left out of the predictors due to its
low variability (CV = 5.1%). Table 3 summarizes the models selected.
The model selected for piglet mortality (%) explained 8% of the variability. There was an increase in mortality with age of the youngest building in which pigs were kept (P< 0.001), and a tendency for it to decrease in farms with better scores in the biosecurity category re-ferring to feed, water, and equipment supply (P =0.079).
The model for finisher mortality (%) explained 23% of the variability. Mortality increased with the average herd size (P< 0.001) and decreased with good disease management scores (P =0.028). High scores in the categories environ-ment and region and in nursery unit manageenviron-ment tended to be related to higher mortalities (P =0.059 andP =0.050, respectively). Good measures between compartments and use of equipment seemed to decrease finisher mortality al-though this was not statistically significant (P =0.126).
The model for ADG (g/day) explained 16% of the variability. It decreased in large farms (No. of sows, P = 0.043) and with the experience of the farm man-ager (P = 0.029). Good practices in disease manage-ment improved ADG (P = 0.039).
Relationship between internal biosecurity and external biosecurity
Around 20% of the variability in internal biosecurity (ad-justed R2= 0.20, P< 0.001) could be explained by the scores obtained in external biosecurity:
Table 2Biosecurity scores (Biocheck.UGent™) for the different categories of internal and external biosecurity in 58 farrow-to-finish Irish pig farms
Mean SD Median Min Max
External biosecurity scorea 78.7 7.75 79.0 62.0 94.0
Purchase of animals and semen 98.8 5.05 100.0 70.0 100.0
Transport of animals, removal of manure and dead animals 80.1 11.26 83.0 43.0 96.0
Feed, water, and equipment supply 54.5 14.57 53.0 10.0 80.0
Personnel and visitors 73.9 18.61 76.0 24.0 100.0
Vermin and bird control 68.3 19.84 70.0 30.0 100.0
Environment and region 79.5 23.35 80.0 20.0 100.0
Internal biosecurity scorea 57.4 14.16 60.0 29.0 80.0
Disease management 82.4 21.55 80.0 20.0 100.0
Farrowing and suckling period management 53.6 18.75 57.0 7.0 86.0
Nursery unit management 63.5 16.11 64.0 36.0 100.0
Fattening unit management 72.7 22.12 79.0 21.0 93.0
Measures between compartments and use of equipment 50.0 16.16 50.0 21.0 86.0
Cleaning and disinfection 42.0 27.25 40.5 0 95.0
Overall biosecurity score 68.3 9.52 70.0 47.0 87.0
a
Internal biosecurity¼−8:434þ0:836
External biosecurity
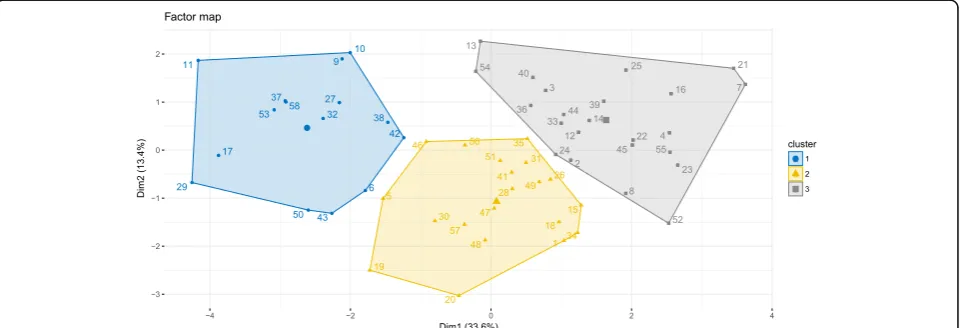
Farm clusters based on biosecurity practices
The first two dimensions of the PCA of the farms de-pending on their biosecurity practices accounted for 47% of variability. Dimension 1 accounted for 33.6% of variability and was mainly explained (66.1%) by internal biosecurity practices. Dimension 2 accounted for 13.4% of variability and was mainly linked to external biosecur-ity (68.4%). The main categories contributing to the clustering of the farms were: cleaning and disinfection,
compartmentalization, transport of animals and removal of manure and dead animals, and management of the different stages in dimension 1 (mainly internal biose-curity categories); and the environment and region, feed, water, and equipment, management of the different stages, and personnel and visitors in the dimension 2 (mainly external biosecurity categories). Three clusters of farms were identified based on their similarities in biosecurity practices (Fig. 1). The average internal biosecurity score in cluster 1, 2, and 3 was (mean ± SD) 38.4 ± 7.6, 61.4 ± 6.99, and 66.3 ± 9.81, respectively. This score differed statistically between cluster 1 and cluster 2 or 3 (P< 0.001). The average external biosecurity score Table 3Multivariable linear regression modelling of herd productive performancea
Outcome Predictor Estimate SE P-value
Piglet mortality, % Intercept 12.04 1.334 < 0.001
AdjustedR2= 0.08 Age of the youngest building, years 0.13 0.066 0.067
P =0.039 Score for feed, water, and equipment supply −0.04 0.023 0.079
Finisher mortality, % Intercept 1.50 0.683 0.032
AdjustedR2= 0.23 No. of sows [per 100 sows] 0.8 0.21 < 0.001
P =0.002 Score for disease management −0.01 0.006 0.028
Score for environment and region 0.01 0.005 0.059
Score for nursery unit management 0.02 0.008 0.050
Score for measures between compartments and use of equipment −0.01 0.008 0.126
ADG, g/day Intercept 706.27 37.734 < 0.001
AdjustedR2= 0.16 No. of sows −0.03 0.0133 0.043
P =0.006 Experience of farm manager, years −1.65 0.734 0.029
Score for disease management 0.73 0.343 0.039
a
Each productive performance indicator (piglet mortality (%), finisher mortality (%), number of pigs per sow per year, ADG (g/day), and FCR) was modelled from herd characteristics and biosecurity scores (categories), presented in Tables1and2, respectively. The table presents the final models after a forward regression approach with a cut-off value of 0.15 for predictor retention. The models fitting the number of pigs per sow per year and FCR were not significant (overall F-test withP =0.067 andP =0.075, respectively)
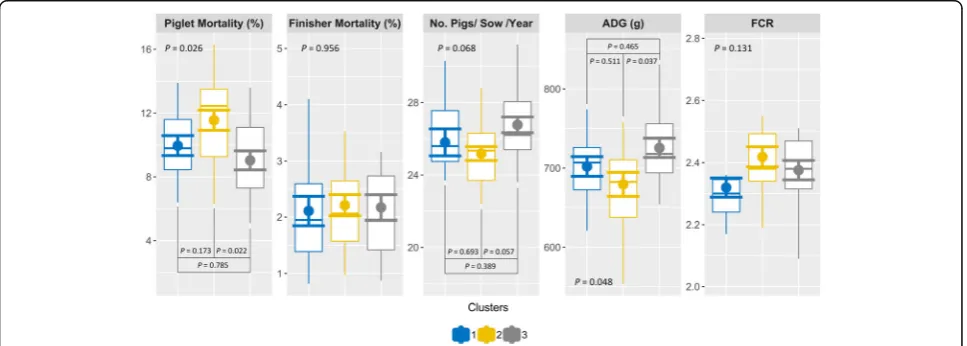
in cluster 1, 2, and 3 was 73.2 ± 5.12, 74.4 ± 5.33, and 86.1 ± 4.47. This score differed statistically between clus-ter 3 and clusclus-ter 1 or 2 (P< 0.001). No other differences were found between clusters in regard to internal and ex-ternal biosecurity scores. The productive performance in-dicators for each cluster of farms are presented in Fig.2. Cluster 2 and cluster 3 were different for piglet mor-tality (11.6 ± 2.84% vs. 9.4 ± 2.39%, P = 0.022), and ADG (679 ± 68.2 g/day vs. 726 ± 58.3 g/day, P = 0.037). Cluster 2 and 3 tended to be different in the number of pigs per sow per year (25.2 ± 1.71 vs. 26.8 ± 2.08, P = 0.057). Finisher mortality and FCR did not differ between clusters (P =0.956 andP =0.131, respectively).
Discussion
The aim of this study was to describe biosecurity practices among Irish pig farms and their relationship with productive performance. The overall biosecurity scores agreed to what has been described in Belgium, France, Germany, Sweden, and Denmark [3, 11]. Ex-ternal biosecurity was higher in Ireland than in other countries, except for Denmark whose pig sector is fo-cused on high health with strict biosecurity practices [11]. The Irish pig sector includes mostly closed herds, resulting in less animal movements with 94.5% of the farms reported to buy only semen from genetic companies and not purchasing gilts. In other coun-tries, gilts are purchased and quarantined on farm be-fore introducing them to the herd [3, 18, 19]. This is a risk for external biosecurity not existing in Ireland. However, rearing gilts on site may have negative effects on internal biosecurity that are not included in this study.
Internal biosecurity scores showed a lack of compliance with cleaning protocols and compartmentalization within the farm. The structure of the farms in Ireland (farrow-to-finish) and the heterogeneity of the facilities (age of the buildings) contribute to the variability seen in internal bio-security practices. Many Irish farms have grown in size by adding new buildings to older, but still functional, facil-ities. This heterogeneity makes standardization of proto-cols to control diseases like PRRS difficult. It is likely that farmers do not valorise the pertinence of internal biose-curity. Casal et al. [18] states that farmers are likely to im-plement biosecurity measures they perceive as important. However, the awareness towards biosecurity has tradition-ally been focused on external biosecurity by farmers to avoid those diseases not endemic to their farms. In recent years, the key importance of internal biosecurity practices to reduce disease and improve profitability has resurged and gained new strength. In any case, internal biosecurity was positively correlated to external biosecurity in accord-ance with other studies highlighting the inter-relationship between both aspects of biosecurity [3,10–12].
The multivariable model for pig mortality explained only 8% of the variability. The age of the buildings was directly related to mortality. Although 79% of the farms had built new housing for pigs within the previous 5 years, several farms had their latest renovation 10 or 15 years ago. Piglet mortality was also associated to poor biosecurity on feed, water, and equipment supply. As shown in the case of porcine epidemic diarrhoea, these supplies increase the risk of introduction of new diseases, which can be linked to higher mortality. Sur-prisingly, the farrowing unit management was not
retained in the piglet mortality model. This manage-ment, as measured by the Biocheck.UGent™, focuses on cross-fostering practices, disinfection of materials be-tween litters, and castration protocols. Other factors such as sow management, farrowing supervision, colos-trum intake, split suckling and training of staff [20, 21] may have a greater impact on piglet mortality than the practices captured in the Biocheck.UGent™.
The model for finisher mortality explained 23% of the variability. Bigger farms had higher finisher mortality. Although in our data the bigger the farm, the higher the number of workers, we suspect that bigger farms may have a greater ratio of pigs per worker with less atten-tion paid to individual finisher pigs, as suggested by Agostini et al. [22]. Some of the workers in bigger farms were many times dedicated to jobs that are externalized in smaller farms like general maintenance or feed manu-facturing. This area needs further research to specify the types of staff in pig farms and its effects on health and performance. The size of the farm may also have an ef-fect independent of the number of workers. Gardner, Willeberg and Mousing [23] described the duality faced by bigger farms which, facing higher risks of infection due to frequent animal movements and high pressure of infection but having higher biosecurity standards to minimize those risks. Finally, better disease manage-ment, including herd health protocols and veterinary expertise, were linked to decreased mortality. The corre-lations between finisher mortality and areas with lower pig density and management of the nursery unit seem contradictory and cannot be explained although no con-founding effects were found.
As for the ADG model, it explained 16% of the vari-ability. Average herd size and experience of farm man-agers had a negative impact on ADG, and a better disease management was positively correlated to ADG. The negative impact of herd size in growth rate could be related to the association with finisher mortality. In herds with higher disease pressure, growth rates are de-creased [24]. Other factors such as herd health or vac-cination protocols may have a role in this association. The negative impact of experience could be related to several factors. Laanen et al. [5] found that older farmers were associated with older infrastructures and poor in-ternal biosecurity which could result in a lesser ability to address production challenges.
The associations found between biosecurity categories and productive performance suggests that, in general, farms with good biosecurity had better performance. Laanen et al. [5] identified such associations with ADG and FCR, but not with finisher mortality. Further simi-larities between that study and ours are the low R2
, meaning only a small proportion of the variability of the productive performance was explained by biosecurity
practices. Indeed, the Biocheck.UGent™ was, as many other biosecurity assessment tools, designed by expert panels using experience and logical reasoning but not scientific validation to support biosecurity practices [7]. Thus it lacks the baseline factors impacting on perform-ance such as herd health status, genetics, use of antimi-crobials and vaccinations, and feeding practices. An alternative to this bias would be to model performance using the practices assessed (individual questions) in-stead of aggregated scores. Finally, some of these tools were designed to address certain pathogens (i.e. PRRSv), not necessarily providing a risk assessment liable to ac-count for other potentially harmful pathogens [25]. Given the limitations stated above, we used a different approach by grouping the farms according to their bio-security practices and then comparing their productive performance instead of directly modelling performance.
In a multivariate approach to the data, farms were sep-arated in three clear clusters based on their biosecurity practices. The highest production performance was found in farms from clusters with better external biose-curity but not internal biosebiose-curity. External biosebiose-curity practices are easier to implement (fences, barriers, etc) than internal biosecurity practices (i.e. attitudes and be-haviours). The former hint investment and could be linked to better management and the maintenance of health status, which translate into better performance. Internal biosecurity practices, as discussed before, are probably under estimated or not well understood by workers who lack a basic understanding of infectious diseases.
Limitations of the study
Conclusions
This study assessed biosecurity practices in Irish pig farms and its impact on production performance. Irish farms follow European tendencies with internal biose-curity posing as the biggest liability. Our results sug-gested that practices related to the environment and region, feed, water, and equipment supply and the man-agement of the different stages, need to be particularly addressed in poor performing farms to improve product-ivity of the Irish pig sector. Indeed such recommenda-tions should be adapted to the health status of each farm. Further studies on the economic impact of these biosecurity practices in connection to data on herd health, vaccination and feeding strategies are the key to motivate farmers to change their practices.
Abbreviations
ADG:Average Daily Gain (g/day); d: Day; ePM: Teagasc e-ProfitMonitor; FCR: Feed Conversion Ratio; g: grams; kg: kilograms; No.: Number; PCA: Principal components analysis
Acknowledgements
The authors would like to thank Pilar Guzman Medina for her help with data collection, and the Teagasc advisors for facilitating the contact with farmers. We would also like to thank all the farmers who accepted to take part in this study.
Funding
This study was part of the PathSurvPig project which was funded by the Department of Agriculture Food and the Marine under the Research Stimulus Fund (PathSurvPig 14/S/832) as part of the National Development Plan. JACD’s position was funded by the same project. The funders had no role in study design, data collection and analysis, decision to publish, or preparation of the manuscript. MRC was supported by the Teagasc Walsh Fellowship Fund.
Availability of data and materials
The datasets used and/or analysed during the current study are available from the corresponding author on reasonable request.
Authors’contributions
MRC: data collection, curation, statistical analysis and interpretation; manuscript writing and reviewing. JGG: manuscript writing and reviewing. JACD: data collection and manuscript reviewing. MP and JDW: manuscript reviewing. GM: data collection and manuscript reviewing. EGM: study design, funding acquisition, data collection, statistical analysis and interpretation, manuscript writing, reviewing and editing. All authors read and approved the final manuscript.
Ethics approval and consent to participate
All the farmers participating in this study gave individual signed consent to the use of the data collected on farm, and to the retrieval of their production data from the Teagasc e-ProfitMonitor according to Teagasc’s internal data protection regulation.
Consent for publication
Not applicable.
Competing interests
The authors declare that they have no competing interests.
Publisher’s Note
Springer Nature remains neutral with regard to jurisdictional claims in published maps and institutional affiliations.
Author details
1Pig Development Department, Teagasc - Animal & Grassland Research and
Innovation Centre, Moorepark, Fermoy, Co. Cork, Ireland.2Departament de
Ciència Animal i dels Aliments, Facultat de Veterinaria, Universitat Autònoma de Barcelona, Bellaterra, 08193 Barcelona, Spain.3Department of
Reproduction, Obstetrics and Herd Health, Veterinary Epidemiology Unit, Faculty of Veterinary Medicine, Ghent University, Salisburylaan 133, 9820 Merelbeke, Belgium.4Pig Development Department, Teagasc Oak Park, Co. Carlow, Ireland.5School of Veterinary Medicine, University College Dublin,
Belfield, Dublin 4, Ireland.
Received: 3 August 2018 Accepted: 21 December 2018
References
1. DAFM. Report of the pig industry stakeholder group. 2016.https://www. agriculture.gov.ie/media/migration/farmingsectors/pigs/
REPORTPIGINDUSTSTAKEHOLDERGROUP290116.pdf. Accessed 3 July 2018. 2. Central Statistics Office. Meat Supply Balance.https://www.cso.ie/en/
releasesandpublications/er/msb/meatsupplybalance2016/. Accessed 17 June 2018.
3. Postma M, Backhans A, Collineau L, Loesken S, Sjolund M, Belloc C, et al. The biosecurity status and its associations with production and management characteristics in farrow-to-finish pig herds. Animal. 2016; 10:478–89.
4. Rojo-Gimeno C, Postma M, Dewulf J, Hogeveen H, Lauwers L, Wauters E. Farm-economic analysis of reducing antimicrobial use whilst adopting improved management strategies on farrow-to-finish pig farms. Prev Vet Med. 2016;129:74–87.
5. Laanen M, Persoons D, Ribbens S, de Jong E, Callens B, Strubbe M, et al. Relationship between biosecurity and production/antimicrobial treatment characteristics in pig herds. Vet J. 2013;198:508–12.
6. Postma M, Vanderhaeghen W, Sarrazin S, Maes D, Dewulf J. Reducing antimicrobial usage in pig production without jeopardizing production parameters. Zoonoses Public Health. 2017;64:63–74.
7. Amass SF, Clark LK. Biosecurity considerations for pork production units. Swine Health Product. 1999;7:217–28.
8. Julio Pinto C, Santiago Urcelay V. Biosecurity practices on intensive pig production systems in Chile. Prev Vet Med. 2003;59:139–45.
9. Biocheck.UGent™, prevention is better than cure.www.biocheck.ugent.be. Accessed 20 Mar 2018.
10. Filippitzi ME, Brinch Kruse A, Postma M, Sarrazin S, Maes D, Alban L, et al. Review of transmission routes of 24 infectious diseases preventable by biosecurity measures and comparison of the implementation of these measures in pig herds in six European countries. Transbound Emerg Dis. 2017;65:381–98.
11. Kruse AB, Nielsen LR, Alban L. Herd typologies based on multivariate analysis of biosecurity, productivity, antimicrobial and vaccine use data from Danish sow herds. Prev Vet Med. 2018.
12. Backhans A, Sjölund M, Lindberg A, Emanuelson U. Biosecurity level and health management practices in 60 Swedish farrow-to-finish herds. Acta Vet Scand. 2015;57:1–11.
13. Teagasc. National Pig Herd Performance Report 2016. 2017.https://www. teagasc.ie/publications/2017/national-pig-herd-performance-report-2016. php. Accessed 4 July 2018.
14. AHDB. 2016 Pig cost of production in selected countries (InterPIG). 2017.
https://pork.ahdb.org.uk/media/274535/2016-pig-cost-of-production-in-selected-countries.pdf. Accessed 3 July 2018.
15. R Core Team. R: A language and environment for statistical computing. 3.4.4 (2018-03-15).https://www.R-project.org/. Accessed 15 Mar 2018.
16. Hebbali A. olsrr: Tools for teaching and learning OLS regression. R package version 05.0.https://CRAN.R-project.org/package=olsrr. Accessed 15 June 2018.
17. Harrel Jr FE. rms: Regression Modeling Strategies. R package version 5.1–2.
https://CRAN.R-project.org/package=rms. Accessed 15 June 2018. 18. Casal J, De Manuel A, Mateu E, Martin M. Biosecurity measures on swine
farms in Spain: perceptions by farmers and their relationship to current on-farm measures. Prev Vet Med. 2007;82:138–50.
20. Muns R, Nuntapaitoon M, Tummaruk P. Non-infectious causes of pre-weaning mortality in piglets. Livest Sci. 2016;184:46–57.
21. Kirkden RD, Broom DM, Andersen IL. Piglet mortality: management solutions. J Anim Sci. 2013;91:3361–89.
22. Agostini PS, Fahey AG, Manzanilla EG, O’Doherty JV, de Blas C, Gasa J. Management factors affecting mortality, feed intake and feed conversion ratio of grow-finishing pigs. Animal. 2014;8:1312–8.
23. Gardner IA, Willeberg P, Mousing J. Empirical and theoretical evidence for herd size as a risk factor for swine diseases. Anim Health Res Rev. 2002;3:43–55. 24. Cornelison AS, Karriker LA, Williams NH, Haberl BJ, Stalder KJ, Schulz LL, et al.
Impact of health challenges on pig growth performance, carcass characteristics, and net returns under commercial conditions. Translat An Sci. 2018;2:50–61.
25. Iowa State University. PADRAP - Production Animal Disease Risk Assessment Program. https://vetmed.iastate.edu/vdpam/about/production-animal-medicine/swine/padrap. Accessed 3 July 2018.