R E S E A R C H A R T I C L E
Open Access
Role of colonic microbiota in the
pathogenesis of ulcerative colitis
Ling-yan Pei
1,2†, Yu-shi Ke
3†, Huan-hu Zhao
1,2†, Lin Wang
4, Chao Jia
1,2,5, Wei-zhi Liu
1,2, Qian-hui Fu
1,2,
Meng-ni Shi
1,2, Jian Cui
1,2and Shu-chun Li
1,2*Abstract
Background:Recent studies have found gut microbiota to be closely associated with onset and perpetuation of UC. Currently, studies about gut microbiota have mainly covered samples collected from the intestinal lumen. However, the luminal flora is only part of the gut microbiota. Studies of the changes in mucosal flora under pathological conditions have been lacking. In this study, we investigated the correlation between the onset of UC and flora changes in different intestinal layers.
Methods:The dextran sulfate sodium(DSS)-induced UC model was established by exposing mice to cycles of DSS. The luminal contents, an inner mucus layer, and outer mucus layer were harvested under sterile conditions. The samples were then analyzed using high-throughput sequencing of 16S rRNA V3 + V4 amplicons. The colonic microbiota composition and diversity were analyzed and compared using MetaStat, LefSe, multivariate analysis of variance, and spatial statistics.
Results:The DSS-induced UC mouse model was successfully established. The diversity of the microbiota from luminal content, the outer mucus layer, and inner mucus layer were significantly different in both control and UC model groups. The statistically different OTUs belonged to Lachnospiraceae and Ruminococcaceae families within the order Clostridiales were mainly localized to the outer mucus layer.
Conclusions:The alterations in flora composition and diversity mainly occurred in the colonic outer mucus layer. The change of flora in the colonic mucus layers is of great significance in the understanding of common features of gut flora in IBD and the understanding of the relationship between gut flora and disease progression.
Keywords:Ulcerative colitis, Intestinal microbiota, Microbiology
Background
Ulcerative colitis (UC) is a chronic, spontaneous inflamma-tory bowel disease affecting the innermost mucosa lining of the colon and rectum [1]. Extensive studies over the past decade have demonstrated that environmental factors, es-pecially bacterial microflora, genetic and immunological factors play a substantial role in the pathogenesis of UC [2]. The dysbiosis of gut microbiota plays crucial roles in the
pathogenesis of ulcerative colitis [3–5]. In mice with
ulcerative colitis induced by DSS, the population of
intestinal microflora, Bacteroides distasonis, Clostridium
spp., and Clostridium difficile, increased significantly [6]. The relative shifts in abundant 16S rRNA (gene)
phylo-types ofAkkermansia muciniphilaandEnterobacteriaceae
are associated with the disease activity index of UC in
DSS-induced UC mouse model.Bifidobacterium and the
Lactobacillusgroup were increased in active IBD patients, while the population of butyric acid-producing bacteria decreased to some extent [7].
The intestinal epithelium and the tight junctions form a barrier that prevents permeation of pathogens from the lu-minal environment into the mucosal tissues and circulatory system. The integrity and normal regeneration capability of the mucosal surface epithelium are the structural basis of the intestinal mucosal barrier. The intestinal mucosal epithelium consists of absorptive enterocytes, goblet cells,
* Correspondence:[email protected]
†Ling-yan Pei, Yu-shi Ke and Huan-hu Zhao contributed equally to this work.
1
School of Pharmacy, Minzu University of China, 27 South Street, Zhongguancun, Beijing 100081, China
2Key Laboratory of Ethnomedicine (Minzu University of China), Ministry of Education, Beijing 100081, China
Full list of author information is available at the end of the article
and Paneth cells. Goblet cells secrete highly glycosylated gel-forming mucins that form a hydrophilic mucus on the epithelial layer. Due to the structural features and negative surface charge, mucin is able to trap and wrap up bacteria. The chemical groups exposed on mucin surface share simi-lar structures with the intestinal epithelium, which facili-tates the recognition and adhesion of bacteria. In addition, mucin binds to adhesion molecule on the intestinal epithe-lium, which can competitively inhibit the binding of harm-ful bacteria to adhesion molecules and subsequently inhibit the colonization of bacteria. The density of mucus is higher in the inner layer and decreases gradually toward the intes-tinal lumen. The outer mucus layer is loose and becomes habitat for commensal bacteria. If colonic epithelium is not covered by mucin, colitis will occur as a result of host im-mune response to invading bacteria [8]. Current studies of gut microbiota in UC use luminal content samples fre-quently. However, the luminal content flora can only par-tially reflect the alteration of gut microbiota. Research into the alternation of mucus layer flora under pathological con-ditions has been sparse. In this study, we established a DSS-induced mice UC model. Next, we conducted high throughput sequencing of the outer mucus layer flora, the inner mucus layer flora, and the luminal content flora. We then analyzed the differential counts of flora under patho-logical conditions in an attempt to understand the role of microbiota in the pathogenesis of UC.
Methods
Experimental animals and establishment of UC model
Thirty 9-week old male SPF C57BALB/c mice weighing 22 ± 2 g were purchased from Beijing Vital River Laboratory Animal Technology Co., Ltd. (Beijing, China; License #: SCXK (JING) 2012–0001). They were housed 3–5 mice per cage in an SPF animal facility of Institute of Science and Technology, National Health and Family Planning Commission of the People’s Republic of China (SYKX (JIGN) 2016–0010). The animals were randomly divided
into a normal control group (n= 10) or UC model group
(n= 20). A UC mouse model was established using the
method reported by Benoit Chassaing [9]. Control mice re-ceived sterile drinking water throughout the study. UC model group mice were exposed to three cycles of DSS treatment. During the first cycle, animals were orally treated with 2.5% DSS (molecular weight 36–50kD; MP Biomedicals, US) for 7 days followed by 7 days of normal drinking water. During the second cycle, animals were orally treated with 2.0% DSS for 7 days followed by 7 days of normal drinking water. During the third cycle, animals were orally treated with 2.5% DSS for 2 days, then with 2.0% DSS for 5 days, followed by 2 days of normal drinking water. After the UC model was established, the animals were sacrificed by cervical dislocation and colons were excised and prepared for histopathological examination.
The experimental protocols were performed after approval and in accordance with the guidelines set by the Ethical Committee of Minzu University of China (Protocol number: 201702).
Isolation of intestinal content, an external mucus layer, and internal mucus layer
Intestinal segments were opened longitudinally. The con-tents were gently picked away using forceps until no visible particles remained. The intestinal content was placed in a 2 ml sterile cryopreservation tube and kept in liquid nitro-gen. The outer mucus layer was gently scraped off, placed in 2 ml sterile cryopreservation tube and kept in liquid nitrogen. The rest of the colon tissue (inner mucus layer) was rinsed with PBS, minced, placed in a 2-ml sterile cryo-preservation tube, and kept in liquid nitrogen.
Extraction of total DNA
Genomic DNA of luminal content-, inner and outer mucosa-associated flora were extracted from using a fecal DNA extraction kit (Tiangen Biotech (Beijing) Co., Ltd.; product number: DP304).
High-throughput sequencing of 16S rRNA amplicons
The purity and concentration of extracted genomic DNA were as determined using agarose gel electrophoresis. Then the genome DNA sample was diluted to 1 mg/μl with ster-ile water for PCR amplification. The primers were 341F:
CCTAYGGGRBGCASCAG; and 806R: GGAC
TACNNGGGTATCTAAT. PCR reaction (30μL) consisted
of Phusion Master Mix (2×), 15μl; each of the primer
(2μM), 3μl; gDNA (1 ng/μL), 10μL (5–10 ng); H2O, 2μL. The thermal cycles included predenaturation at 98 °C for 1 min, and 30 cycles of 98 °C for 10s, 50 °C for 30s, 72 °C for 30s; and followed by a final extension at 72 °C for 5 min. PCR product was analyzed using 2% agarose gel electro-phoresis. According to concentrations, the PCR products were mixed in the same concentration, then mixed with 1 × TAE buffer and purified using 2% agarose gel. PCR products with the size of 400–450 bp were recovered from the gel and further purified using GeneJet Gel Extraction Kit (Thermo Fisher Scientific). DNA libraries were
gener-ated using the NEB Next® Ultra™DNA Library Prep Kit for
Illumina (New England Biolabs, US) according to the manufacturer’s instructions. After Qubit quantification and quality control, these libraries were sequenced on the Illumina HiSeq system. We yielded 6,130,487 raw reads. After adaptor clipping, decloning, and rejecting low quality sequencing, 4,907,035 clean reads were obtained. Each read
had Q20 > 98% and Q30≥97%.
Bioinformation and biostatistics analysis
operational taxonomic units (OTUs). Representative OTU was annotated to species, then the corresponding species information and species abundance information was delineated. Then the relative OTUs abundance, alpha diversity metrics, and Venn diagram were analyzed to obtain the information about bacterial species richness, proportional abundances of species (evenness), and OTUs differed or shared between groups. By constructing a phylo-genetic tree using multiple sequence alignment of OTUs, we assessed microbial community structure differences between different samples and groups for analysis using ordination approaches, such as PCoA, PCA, or NMDS.
The microbiota composition and diversity were analyzed using MetaStat, LefSe, multivariate analysis of variance, and spatial statistics. Generalized linear mixed modeling was performed using the onset of UC as the dependent variable and repeat measurements of OTU abundances of luminal contents flora, inner mucus layer flora, and outer mucus layer flora as independent variables. The results showed that the distribution of 3862 OTUs in each layer was not repeated measurement data. Therefore, multiple logistic regression was used to analyze the relationship between UC onset and OTU abundance in each layer.
Results
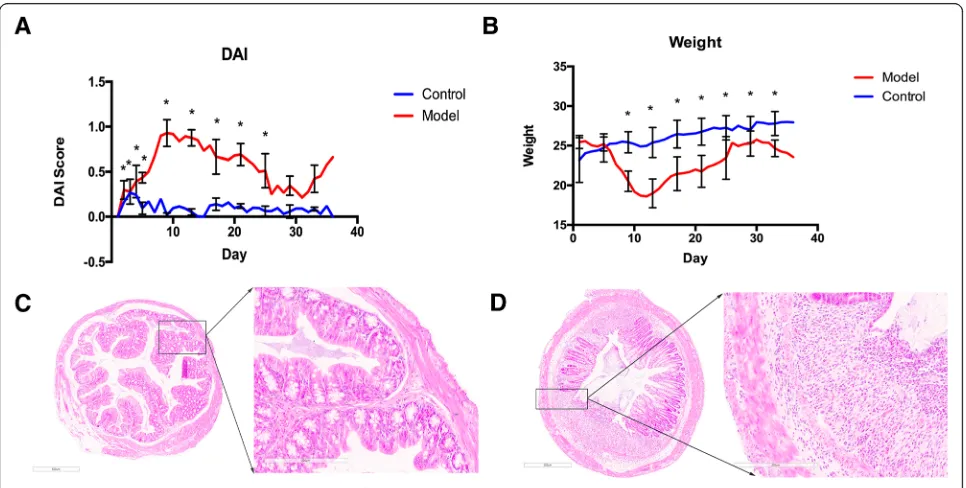
Evaluation of disease model
The mice DAI index and body weight were analyzed using repeated measures ANOVA. The results showed that the
DAI and body weight of model group differed significantly
from the control group after time correction (F = 168.66,
P≦0.05; F = 10.881, P≦0.05). During the first week of the model establishment, the model group was in the acute phase and DAI showed a significant increase. Then the DAI of the model group decreased to some extent but remained higher than that of the control group. During the last week of DSS exposure, the DAI of the model
group increased again (Fig. 1a). The body weight of the
UC model group was significantly lower than that of the
control group throughout the modeling process (Fig.1b).
The histopathological slides were scanned using Leica APERIO AT2 and observed under 4.5-fold and 20-fold magnitude. The results showed that the colon tissue from the control group had a smooth surface, no erosion, ulcer,
or crypt abscess (Fig. 1c). In contrast, the colon tissue
from the UC model group had inflammatory infiltration in submucosa through the muscular layers of the colon wall, and necrosis of intestinal epithelium (Fig.1d). These results demonstrated the UC mouse model was estab-lished successfully.
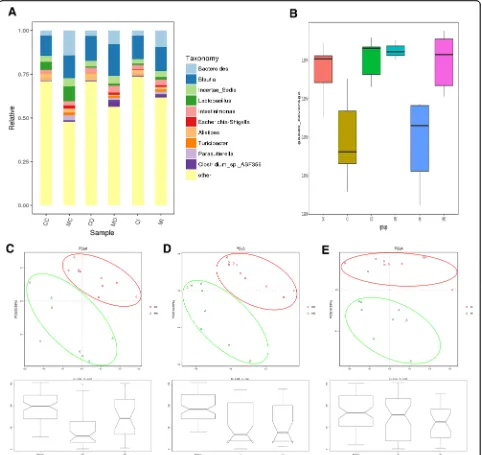
Microbiota diversity analysis
At the genus level, ten bacteria including Bacteroides, Blautia, incertae_sedis, Lactobacillus, Intestinimonas, Escherichia-Shigella, Alistipes, Turicibacter, Parasutter-ella, and Clostridium_sp._ASF356 had high relative
abundance in both control and model groups (Fig. 2a).
We then conducted an alpha diversity comparison between different colon layers of control and UC model groups. We compared Chao1, observed_species, Shannon, and Simp-son indices between the control and UC model groups. The results showed no significant difference regarding
richness and diversity; while goods_coverage indices
indi-cated significant differences between groups (Fig. 2b). In
addition, none of the above-mentioned indices differed be-tween the inner mucus layer flora and outer mucus layers flora between groups.
Principle coordinates analysis (PCoA) of the bacterial communities, including luminal contents, inner and outer mucus layers of control and UC group, derived
from the weighted UniFrac distance matrix was
conducted. The results showed that there was no overlap between samples from each group and the distance be-tween groups was relatively large, which suggested that there were fewer shared OTUs common to both these groups and more different OTUs. Anosim analysis indi-cated that the inter-group difference was significantly greater than the intra-group difference (R > 0, P< 0.05)
(Fig.2c, d, and e). Adnois test derived from the weighted
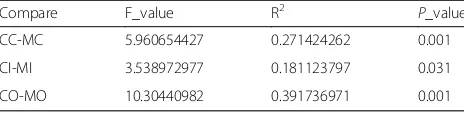
UniFrac distance matrix showed that the grouping fac-tors contributed more to the OTUs differences observed in this study (P< 0.05) (Table1).
Analysis of differentially abundant flora
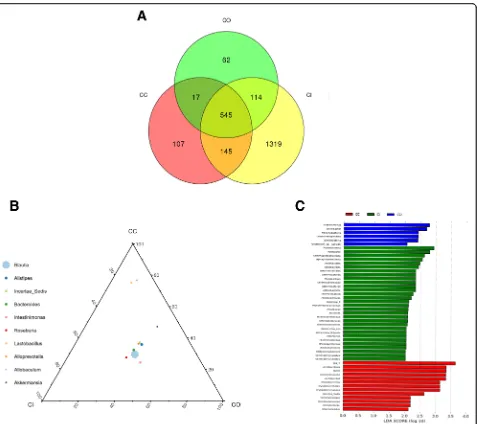
Differentially abundant flora in luminal contents, an inner mucus layer, and outer mucus layer
In control animals, a total of 545 OTUs were shared among the three layers. Luminal content-, outer mucus layer-, and inner mucosa layer-specific OTUs were 107, 62, and 1319,
respectively (Fig. 3a). At the same taxonomy level, the
abundance of the same species was different among differ-ent colon tissue layers. For example, at the genus level, the abundance of Bacteroides in each layer, ranked from high-est to lowhigh-est, was CO > CI > CC; while that of Lactobacillus was CC > CI > CO (Fig. 3b). Forty-eight differentially abundant OTUs were found in three layers. Six OTUs, in-cluding Intestinimonas, Oscillibacter, and Melainabacteria, were enriched in the outer mucus layer (shown in blue
color in Fig.3c). Twenty-nine OTUs, including
Proteobac-teria, GammaproteobacProteobac-teria, and AlphaproteobacProteobac-teria, were enriched in the inner mucus layer (shown in green in Fig. 3c). Thirteen OTUs, including Lactobacillales, Bacilli, and Lactobacillaceae, were enriched in luminal contents (shown in red in Fig.3c).
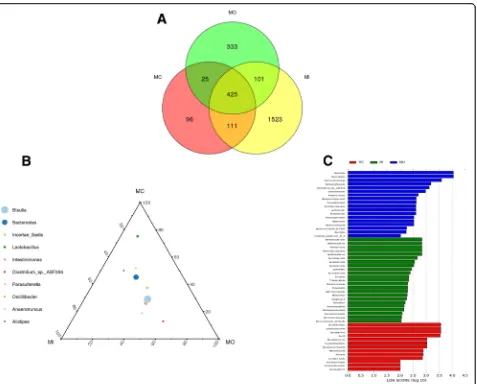
In UC model animals, a total of 425 OTUs were shared among the three layers. Luminal contents-, outer mucus layer-, and inner mucosa layer-specific OTUs
were 96, 333, and 1523, respectively (Fig. 4a). At the
same taxonomy level, the abundance of same species dif-fered across different colon tissue layers. For example, at
the genus level, the abundance of Bacteroides in each layer, ranked from highest to lowest, was MC > MI > MO; while that of Lactobacillus was MC > MI > MO
(Fig. 4b). Fifty-four differentially abundant OTUs were
enriched from three layers. Eighteen OTUs, including
Clostridia, Clostridiales, Ruminococcaceae, were
enriched in the outer mucus layer (shown in blue color
in Fig.4c). Twenty-three OTUs, including
Deferribacter-ales, Deferribacteres, Mucispirillum, were enriched in
the inner mucus layer (shown in green color in Fig.4c).
Thirteen OTUs, including Lactobacillales, Lactobacilla-ceae, Lactobacillus, were enriched in luminal contents (shown in red in Fig.4c).
Comparison of the differentially abundant flora of luminal contents, inner mucus layer and outer mucus layer between two groups
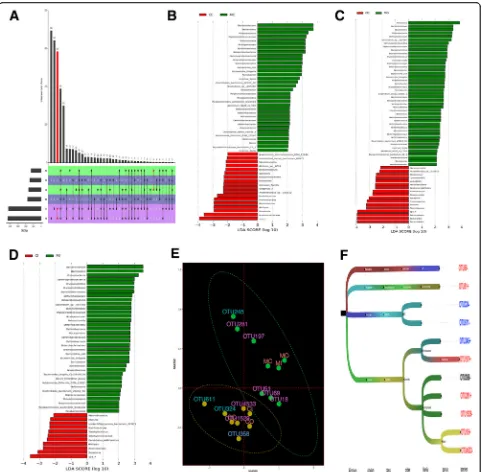
Both control and model groups shared 491 luminal flora OTUs, 447 outer mucus layer flora OTUs, and 1361
inner mucus layer flora OTUs (Fig.5a).
From luminal contents samples, 52 differentially abun-dant OTUs were identified from control and model groups; among which 18 (e.g., Marvinbryantia, Bradyrhi-zobium, Gaiellales) were enriched in the control group (shown in red) and 34 (e.g., Bacteroidaceae, Bacteroides, Proteobacteria) were enriched in the model group
(shown in green) (Fig. 5b). From the inner mucus layer,
47 differentially abundant OTUs were identified from control and model groups; among which 11 (e.g., Mar-vinbryantia, Massilia, Ruminococcus) were enriched in the control group (shown in red) and 36 (e.g., Bacteroi-daceae, Bacteroides, Proteobacteria) in the model group
(shown in green) (Fig. 5c). From the outer mucus layer,
60 differentially abundant OTUs were identified from control and model groups; among which 17 (e.g., Mar-vinbryantia, Allobaculum, Cyanobacteria) were enriched in the control group (shown in red) and 43 (e.g., Firmi-cutes, Bacteroidaceae, Bacteroides) in the model group
(shown in green) (Fig.5d).
The metastat analysis was performed to compare the flora relative abundance between samples. For luminal con-tent flora and inner mucus layer flora, no bacteria showed differences in abundance between the control and model groups. For the outer mucus layer flora, the abundances of Peptostreptococcus, Alistipes, and Turicibacter were signifi-cantly different between the control and model groups
[Additional file 1: Table S1, Additional file 2: Table S2,
available as Supplementary data at BMC Gastroenterology
online]. Multiple logistic regression analysis of the relation-ship between UC onset and OTU abundance in each layer showed that the following OTUs were significantly different between control and UC mice: OTU245, OTU324, OTU 611 of luminal contents flora, OTU18, OTU51, OTU69, O TU4533, OTU197, OTU1529, and OTU281 of outer Table 1UniFrac weighted distance Adonis analysis between
groups
Compare F_value R2 P_value
CC-MC 5.960654427 0.271424262 0.001
CI-MI 3.538972977 0.181123797 0.031
CO-MO 10.30440982 0.391736971 0.001
mucus layer flora and OTU358 of inner mucus layer flora. The outer mucus layer of flora had more OTUs that dif-fered significantly between the control and UC groups
(Table 2). The OTUs that indicated an increased risk for
UC were OTU245, OTU18, OTU51, OTU197, and OTU281; while the OTUs that indicated a decreased risk for UC were OTU324, OTU611, OTU69, OTU4533,
OTU1529, and OTU358 (Fig. 5e). The above-mentioned
OTUs were mainly annotated to Lachnospiraceae and Ruminococcaceae in the order Clostridiales (Fig.5f).
Discussion
Among various chemically induced colitis models, DSS-induced colitis model is widely used because of its simplicity and many similarities with human ulcerative colitis. DSS carries a highly negative charge contributed by sulfate groups, is toxic to the colonic epithelia, and induces erosions that ultimately compromise barrier in-tegrity resulting in increased colonic epithelial
perme-ability [6, 9]. Further, its anticoagulant property
DSS-induced extensive pathology is confined to the large intestine, specifically the distal colon where an enormous number of microorganisms live. The mechanism by which DSS passes through mucosal epithelial cells remains unclear, but a recent publication suggests that DSS induces colitis in mice by forming nano-lipocomplexes with medium-chain-length fatty acids in the colon [10].
In the large intestine (colon) the mucus is continuous and has two layers. Tight stacking of polymeric glycopro-teins adheres firmly to the epithelium forms a compact inner layer that is largely sterile [11]. Following proteolytic dispersion of mucin polymers, the outer layer is looser and contains commensal microbiota [12]. Only some bacterial species have a sufficient repertoire of genome-encoded
under stress or under some pathological conditions, the balance is perturbed, and harmful bacteria in the intestine or opportunistic pathogens may colonize another niche, in-vade the intestinal epithelium, and trigger inflammation. The tight junction proteins joining adjacent enterocytes are crucial for the maintenance of epithelial barrier integrity. During inflammatory processes, the tight junction proteins
can be disrupted, allowing free passage of luminal contents into the lamina propria [18,19].
cells from most of the bacteria, but the inner mucus layer is not sterile. The inner mucus layer comes into contact with a small number of bacteria. However, long-term exposure to bacteria can trigger a severe immune response; this immune response can affect the secretion of MUC2 mucin and the characteristics and function of the inner mucus layer [20]. In the case of ulcerative colitis, the thickness of the colonic mucus layer will decrease. In this way, bacteria can penetrate the inner mucus layer, reach the epithelium, and trigger severe colonic immune response. The dysbiosis of gut flora, together with an impaired intestinal clearance of
bacteria, enhances the invasiveness of pathogens,
disrupts the intestinal immune response, accelerates the intestinal inflammatory response and eventually leads to ulcerative colitis [21,22].
The imbalance between beneficial and potentially harmful gut bacteria induces UC. However, studies of the locations of such dysbiosis have been lacking. In this study, we found that, in the control group, the luminal flora differed greatly from the inner mucus flora. In the UC model group, the difference between the inner mucus layer flora and the outer mucus layer flora and the difference between luminal flora and inner mucus flora were significant. These results indicated that the microbiota community structures of the inner and outer mucus layers were different in UC model mice. The differ-ent microbiota composition in inner and outer mucus layers may contribute greatly to the onset of UC. The lu-minal and outer layer flora were always in a dynamic state of flux. The dysbiosis of the inner and outer mucus layers is closely associated with the onset of UC. We also found that the flora of the outer mucus layers of control animals differed greatly from those of UC animals. However, the inner mucus layer flora and luminal flora did not differ be-tween normal and UC animals. In addition, more bacteria in the outer mucus layer showed differences in abundance
and structure relative to the inner mucus layer. Similar re-sults were obtained from logistic regression analysis of the relationship between UC and OTU of different layers. These results indicated that dysbiosis occurred mainly in the outer mucus layer in UC animals and the mucus mi-crobes are very active and competitive between different species. This may be due to the physiological functions of the outer mucus layer. The outer mucus layer is a very challenging habitat as it is undergoing rapid turnover with a time frame of several hours. As a result, microbes need to be fit enough to be renewed at the same rate while com-peting with each other for resources to persist in this stressful niche [14]. When the symbiotic niche is per-turbed, some microbes will rapidly colonize and become dominant. The colonized microbes will reside in the outer mucus layer, produce protease, and degrade the MUC2 polymer [23], which leads to the invasion and direct con-tact of microbes with colonic epithelium. According to Venn diagram and MetaStat analysis, we found that the microbiota composition changed in UC mice and the flora change in the luminal sample could not reflect the flora change in the entire intestinal ecosystem. The flora of the mucus layers needs to be investigated as well. The luminal content sample has been used for intestinal microbiota analysis because it is less likely to be contaminated by alien species and is easy to collect. However, research into the correlation between dysbiosis and diseases shows that mucus flora usually displays significant alterations in species richness while luminal content flora does not, which means that much less information is derived from luminal content flora than from mucus flora [24]. Our results are consistent with this report, and the flora of the outer layer of mucus changed more significantly than either inner layer flora or luminal flora. In this way, the dynamic changes of mucus flora are of great importance regarding the character-istic microbiota changes in IBD.
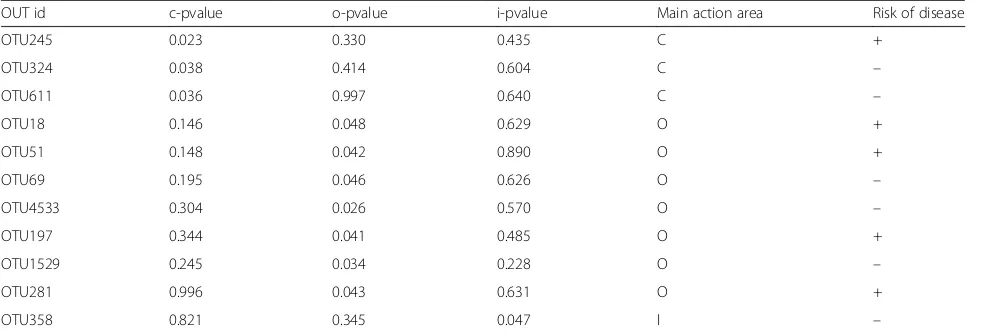
Table 2Distribution of differentially abundant OTUs and their roles
OUT id c-pvalue o-pvalue i-pvalue Main action area Risk of disease
OTU245 0.023 0.330 0.435 C +
OTU324 0.038 0.414 0.604 C –
OTU611 0.036 0.997 0.640 C –
OTU18 0.146 0.048 0.629 O +
OTU51 0.148 0.042 0.890 O +
OTU69 0.195 0.046 0.626 O –
OTU4533 0.304 0.026 0.570 O –
OTU197 0.344 0.041 0.485 O +
OTU1529 0.245 0.034 0.228 O –
OTU281 0.996 0.043 0.631 O +
OTU358 0.821 0.345 0.047 I –
About 99% of the normal human gut microbiota com-prises of four phyla, namely Firmicutes (including the ma-jority of Clostridium XIX and IV groups), Bacteroidetes (account for 90% of gut microbiota), Proteobacteria and Actinobacteria [25]. However, the analysis of mucosally as-sociated bacteria showed enrichment of Streptococcal and Lactobacillus spp. (Bacillus subgroup of Firmicutes) [26]. Investigations have shown a relative decrease in the bacter-ial phyla Firmicutes and Bacteroidete, while an increase in Proteobacteria and Actinobacteria were observed with mu-cosal inflammation [27]. The research into the abundance of these bacteria in each mucus layers has been lacking. In this study, we found new phyla Proteobacteria, Firmicutes, Fusobacteria, and Bacteroidetes invaded into the outer mucus layer of UC model mice. We also observed invasion of phyla Proteobacteria, Gemmatimonadetes, Chloroflexi, Firmicutes, Verrucomicrobia, Bacteroidetes, Nitrospirae, Thaumarchaeota, Planctomycetes, and Actinobacteria into the inner mucus layer in UC mice. The invasion of these microbes may explain the alteration in microbiota compos-ition here observed in UC mice. Bacteria of the phyla Acti-nobacteria and Proteobacteria are the most abundant in
human and mouse colonic mucosa [13,28]. Bacteroidaceae
and Prevotellaceae families of phylum Bacteroidetes are abundant in mouse colonic mucosa. Our study showed similar results. Bacteroides species can break down a broad array of dietary polysaccharides and thus occupy a meta-bolic niche in which a variety of polysaccharides exist as sources of carbon [29]. When large numbers of glycan-philes, such as Bacteroides species, invade the inner mucus layer [30], they degrade glycan and spread with mucus. Because of gradual degradation, the inner mucus layer becomes thinner or even develops exposed patches. Then more bacteria or other microbes penetrate the inner mucus layer and adhere to the intestinal epithelial cells. When the bacterial metabolites are recognized by host intestinal epithelial cells and the immune system, a cascade of host immune responses will be triggered [26].
Conclusions
In summary, we here found that the microbiota compos-ition and changes in abundance took place mainly in the outer mucus layer of DSS-induced UC mice. The lu-minal flora did not change significantly. Therefore, the changes in flora in the colonic mucus layers is of great significance in the understanding of common features of gut flora in IBD and understanding of the relationship between gut flora and disease progression.
Additional files
Additional file 1:CO-MO (Genus level) Metastat analysis. (PDF 68 kb)
Additional file 2:CO-MO (Species level) Metastat analysis. (PDF 42 kb)
Abbreviations
16SrRNA:16S ribosomal RNA; ANOVA: Analysis of Variance; CC: The luminal content of control group; CI: The inner mucus layer of control group; CO: The outer mucus layer of control group; DAI: Disease active index; DSS: Dextran sodium sulphate; IBD: Inflammation browel disease; IFN: Interferon; IL: Interleukin; LDA: Linear Discriminant Analysis; LefSe: LDA Effect Size; MC: The luminal content of model group; MI: The inner mucus layer of model group; MO: The outer mucus layer of model group; MUC2: Mucin2; NMDS: Non-metric multidimentional scaling;
OTU: Operational taxonomic unit; PBS: Phosphate buffer saline; PCA: Principal component analysis; PCoA: Principal Co-ordinates analysis; PCR: Polymerase Chain Reaction; TLR: Toll-like receptor; UC: Ulcerative colitis
Acknowledgements
We thank Prof. Zhu Dan, Mr. Wu En-qi and Miss Xie Dan [College of Phar-macy, Minzu University of China, China] for the statistics support and advice.
Funding
This work was supported by the National Natural Science Foundation of China (Grant numbers 81473796, 81774449), Program for Changjiang Scholars and Innovative Research Team in University PCSIRT (Grant no. IRT 13R63), and by the Ministry of Education, China.
Availability of data and materials
The datasets used and analysed during the current study available from the corresponding author on reasonable request.
Authors’contributions
LYP and YSK performed establishing UC model and drafted the manuscript; LYP and HHZ analysed data; SCL and JC planned experiments, revised the manuscript and obtained funding for the project; LW, WZL, QHF and MNS performed establishing UC model and revised the contents of the discussion of the manuscript; and all authors read and approved the manuscript.
Ethics approval and consent to participate
The experimental protocols were performed after approval and in accordance with the guidelines set by the Ethical Committee of Minzu University of China (ERM: 201702).
Consent for publication
Not applicable.
Competing interests
The authors declare that there are no conflicts of interest to disclose.
Publisher’s Note
Springer Nature remains neutral with regard to jurisdictional claims in published maps and institutional affiliations.
Author details
1School of Pharmacy, Minzu University of China, 27 South Street, Zhongguancun, Beijing 100081, China.2Key Laboratory of Ethnomedicine (Minzu University of China), Ministry of Education, Beijing 100081, China. 3Center for Drug Evaluation, China Food and Drug Administration, Beijing 100081, China.4Department of Histology and Embryology, Xinxiang Medical University, Xinxiang 453003, Henan, China.5Department of Pathology, Beijing Children’s Hospital, Capital Medical University, National Center for Children’s Health, Beijing 100045, China.
Received: 31 May 2018 Accepted: 7 January 2019
References
1. Matsuoka K, Kobayashi T, Ueno F, Matsui T, Hirai F, Inoue N, Kato J, Kobayashi K, Kobayashi K, Koganei K, et al. Evidence-based clinical practice guidelines for inflammatory bowel disease. J Gastroenterol. 2018;53(3):305–53.
2. Farrell RJ, Peppercorn MA: Ulcerative colitis.Lancet (London, England)2002, 359(9303):331–340.
perpetuation of inflammatory bowel disease. Aliment Pharmacol Ther. 2006; 24(Suppl 3):11–8.
4. Teran-Ventura E, Aguilera M, Vergara P, Martinez V. Specific changes of gut commensal microbiota and TLRs during indomethacin-induced acute intestinal inflammation in rats. Journal of Crohn's & colitis. 2014;8(9):1043–54. 5. Wang Y, Gao X, Ghozlane A, Hu H, Li X, Xiao Y, Li D, Yu G, Zhang T.
Characteristics of fecal microbiota in pediatric Crohn's disease and their dynamic changes during infliximab therapy. Journal of Crohn's & colitis. 2017. 6. Okayasu I, Hatakeyama S, Yamada M, Ohkusa T, Inagaki Y, Nakaya R. A novel
method in the induction of reliable experimental acute and chronic ulcerative colitis in mice. Gastroenterology. 1990;98(3):694–702. 7. Wang W, Chen L, Zhou R, Wang X, Song L, Huang S, Wang G, Xia B.
Increased proportions of Bifidobacterium and the lactobacillus group and loss of butyrate-producing bacteria in inflammatory bowel disease. J Clin Microbiol. 2014;52(2):398–406.
8. Johansson ME, Hansson GC. Microbiology. Keeping bacteria at a distance.
Science (New York, NY). 2011;334(6053):182–3.
9. Chassaing B, Aitken JD, Malleshappa M, Vijay-Kumar M. Dextran sulfate sodium (DSS)-induced colitis in mice.Current protocols in immunology. 2014; 104:Unit 15.25.
10. Laroui H, Ingersoll SA, Liu HC, Baker MT, Ayyadurai S, Charania MA, Laroui F, Yan Y, Sitaraman SV, Merlin D. Dextran sodium sulfate (DSS) induces colitis in mice by forming nano-lipocomplexes with medium-chain-length fatty acids in the colon. PLoS One. 2012;7(3):e32084.
11. Atuma C, Strugala V, Allen A, Holm L. The adherent gastrointestinal mucus gel layer: thickness and physical state in vivo. Am J Physiol Gastrointest Liver Physiol. 2001;280(5):G922–9.
12. Johansson ME, Phillipson M, Petersson J, Velcich A, Holm L, Hansson GC. The inner of the two Muc2 mucin-dependent mucus layers in colon is devoid of bacteria. Proc Natl Acad Sci U S A. 2008;105(39):15064–9. 13. Albenberg L, Esipova TV, Judge CP, Bittinger K, Chen J, Laughlin A, Grunberg S, Baldassano RN, Lewis JD, Li H, et al. Correlation between intraluminal oxygen gradient and radial partitioning of intestinal microbiota.
Gastroenterology. 2014;147(5):1055–1063.e1058.
14. Li H, Limenitakis JP, Fuhrer T, Geuking MB, Lawson MA, Wyss M, Brugiroux S, Keller I, Macpherson JA, Rupp S, et al. The outer mucus layer hosts a distinct intestinal microbial niche. Nat Commun. 2015;6:8292.
15. Arpaia N, Campbell C, Fan X, Dikiy S, van der Veeken J, DeRoos P, Liu H, Cross JR, Pfeffer K, Coffer PJ, et al. Metabolites produced by commensal bacteria promote peripheral regulatory T-cell generation. Nature. 2013; 504(7480):451–5.
16. Furusawa Y, Obata Y, Fukuda S, Endo TA, Nakato G, Takahashi D, Nakanishi Y, Uetake C, Kato K, Kato T, et al. Commensal microbe-derived butyrate induces the differentiation of colonic regulatory T cells. Nature. 2013; 504(7480):446–50.
17. Zarepour M, Bhullar K, Montero M, Ma C, Huang T, Velcich A, Xia L, Vallance BA. The mucin Muc2 limits pathogen burdens and epithelial barrier dysfunction during Salmonella enterica serovar typhimurium colitis. Infect Immun. 2013;81(10):3672–83.
18. Chelakkot C, Ghim J, Ryu SH. Mechanisms regulating intestinal barrier integrity and its pathological implications. Exp Mol Med. 2018;50(8):103. 19. Mayer L. Mucosal immunity and gastrointestinal antigen processing.
J Pediatr Gastroenterol Nutr. 2000;30(Suppl):S4–12.
20. Bhinder G, Stahl M, Sham HP, Crowley SM, Morampudi V, Dalwadi U, Ma C, Jacobson K, Vallance BA. Intestinal epithelium-specific MyD88 signaling impacts host susceptibility to infectious colitis by promoting protective goblet cell and antimicrobial responses. Infect Immun. 2014;82(9):3753–63. 21. Swidsinski A, Weber J, Loening-Baucke V, Hale LP, Lochs H. Spatial
organization and composition of the mucosal flora in patients with inflammatory bowel disease. J Clin Microbiol. 2005;43(7):3380–9. 22. Guarner F, Malagelada JR. Gut flora in health and disease.Lancet (London,
England). 2003;361(9356):512–9.
23. Lidell ME, Moncada DM, Chadee K, Hansson GC. Entamoeba histolytica cysteine proteases cleave the MUC2 mucin in its C-terminal domain and dissolve the protective colonic mucus gel. Proc Natl Acad Sci U S A. 2006; 103(24):9298–303.
24. Gevers D, Kugathasan S, Denson LA, Vazquez-Baeza Y, Van Treuren W, Ren B, Schwager E, Knights D, Song SJ, Yassour M, et al. The treatment-naive microbiome in new-onset Crohn's disease. Cell Host Microbe. 2014;15(3):382–92.
25. Li G, Yang M, Zhou K, Zhang L, Tian L, Lv S, Jin Y, Qian W, Xiong H, Lin R, et al. Diversity of duodenal and rectal microbiota in biopsy tissues and luminal contents in healthy volunteers. J Microbiol Biotechnol. 2015;25(7):1136–45. 26. Kim YS, Ho SB. Intestinal goblet cells and mucins in health and disease:
recent insights and progress. Curr Gastroenterol Rep. 2010;12(5):319–30. 27. Cassmann E, White R, Atherly T, Wang C, Sun Y, Khoda S, Mosher C,
Ackermann M, Jergens A. Alterations of the Ileal and colonic mucosal microbiota in canine chronic enteropathies. PLoS One. 2016;11(2):e0147321. 28. Berry D, Stecher B, Schintlmeister A, Reichert J, Brugiroux S, Wild B, Wanek
W, Richter A, Rauch I, Decker T, et al. Host-compound foraging by intestinal microbiota revealed by single-cell stable isotope probing. Proc Natl Acad Sci U S A. 2013;110(12):4720–5.
29. Sonnenburg JL, Xu J, Leip DD, Chen CH, Westover BP, Weatherford J, Buhler JD, Gordon JI. Glycan foraging in vivo by an intestine-adapted bacterial symbiont.Science (New York, NY). 2005;307(5717):1955–9.