1424
DOI:10.21276/ijprhs.2017.05.19
Mahapatraet al CODEN (USA)-IJPRUR, e-ISSN: 2348-6465
Original Article
Formulation and Evaluation of Paclitaxel
Nanocrystals for Parenteral Administration by Using
PVP
Lagnajit Mahapatra
1,*, A Swathi
2, B Biswal
1, Anima Jena
1Sri Sivani College of pharmacy, chilakpalem, srikakulam, Andhra Prdesh, India KLR Pharmacy College, Palvoncha, Khammam, Telengana, Andhra Prdesh, India
A R T I C L E I N F O A B S T R A C T
________
1. INTRODUCTION
Among all newly discovered chemical entities about 40% drugs are lipophilic and fail to reach the market due to their poor water solubility 1. Solubility, the phenomenon of dissolution of solute in solvent to give a homogenous system, is one of the important parameters to achieve desired concentration of drug in systemic circulation for desired (anticipated) pharmacological response. Low aqueous solubility is the major problem encountered with formulation
International Journal of Pharma Research and Health Sciences
Available online at
www.pharmahealthsciences.net
Received: 12 Jun 2017 Accepted: 20 Jul 2017
The present study was aimed at preparing and evaluating Nanocrystals of Paclitaxel (PTX). Various nanocrystal formulations were prepared by nanoprecipitation method using, Povidone as stabilizers as polymer matrix in different molar ratios. The formulations were optimized based on their particle size and zeta potential. Those optimized formulations were then characterized for their surface morphology, assay, in vitro drug release profile, syringeability and injectability, dilution stability, solubility and stability studies. The PTX nanocrystals were rod, spherical, nearly spherical and elongated cylindrical crystals with a size ranging from 40 nm to 120 nm. The assay was found to be in the range of 99.562% to 103.25%. The zeta potential was found to be in the range of -29.6 to 34.5 mV. The release data was plotted for cumulative % drug release as a function of time.In vitrorelease study was analyzed using various mathematical models. The formulations exhibited burst release and later sustained drug release profile. F1 (PVP). Formulation showed prolonged drug release for 72hr.All the formulations could pass freely through the needle size of 13 mm and showed different levels of redispersibility at different time intervals. Accelerated stability studies were performed and the formulations were found to be stable.
Keywords:Paclitaxel, Nanocrystals, Nanoparticles, Formulations, PLGA.
Corresponding author * Dr Lagnajit Mahapatra
Sri Sivani College of Pharmacy,Srikakulam,Andhra Pradesh, India,
development of new chemical entities as well as for the generic development2-3.
Paclitaxel nanocrystals are intended for intravenous administration in the treatment of advanced breast cancer, ovarian cancer and non-small cell lung cancers. A small particle size is desired to avoid embolization. In the past two decades, colloidal drug delivery systems (CCDS), including liposomes, solid lipid nanoparticles, polymeric nanoparticles and micelles have been used to formulate highly insoluble anticancer drugs. Despite the fact that these systems have been extensively studied, various inherent limitations remain. They generally have limited drug-loading capacity. Phospholipid-based structures such as liposomes may also suffer from drug leakage and instability during the preparation, storage and administration process that can compromise the therapeutic outcomes. Therefore, more physically stable and solvent-free nanocrystal-based formulation may be used for delivering antineoplastic drugs to reach the tumor site.
The half life of the Paclitaxel is 5hrs. The marketed liquid injection has Polyoxyl castor Oil as excipient which can cause hypersensitivity reactions in some individuals. A albumin based nanoparticle paclitaxel preparation is also available A simple manufacturing method was envisaged for formulation of parenteral Paclitaxel nanocrystalline systems using Bottom up techniques to prepare the formulations and optimized amounts of polymer shall be used for sustaining the drug release.
2. MATERIALS AND METHODS
Paclitaxel was received as a gift sample from Laurus Labs, Hyderabad, PVP( Plasdone C-12 were received from.Poly Purac Biochem, Netherlands.Sodium hydroxide, Potassium dihydrogen phosphate, Propylene glycol, N- Methyl Pyrrolide ,n- Hexane and Oleyl alcohol were purchased from Merck Millipore, Mumbai.
Preformulation studies
Preformulation studies, preparation of buffer solution, determination of λmax, standard graph preparation by UV
method.
Formulation and Evaluation of Paclitaxel: PVP nanocrystal formulations
Paclitaxel nanocrystals were prepared by using PVP. The optimized nanocrystals of paclitaxel were evaluated and characterized for particle size, zeta potential, in vitro drug release and shape by SEM.
PREFORMULATION STUDIES
Characterization of Paclitaxel4
The drug was stored in a well closed container, protected from light. It was characterized according to the USP/Ph Eur monograph for description, solubility, pH of solution and melting point.
Drug solubility5
Drug solubility in different solvents estimated by dissolving the drug in solvents at saturate level and mixed for 24hrs
using shaker. After that the drug solution was filtered using
0.2μm filter and the drug concentration in the solution
estimated by spectrophotometrically at 227nm.
Drug excipient compatibility studies6
Drug: Stabilizer (PVP) and the pure drug were subjected to the Fourier transform infrared spectroscopy (FT- IR) in order to check the possible drug- stabilizer interactions.
IR Spectroscopy:
In order to check the integrity of drug in the formulation, IR spectra of the selected formulation were obtained and compared with the IR spectra of the pure drug. In the present study, potassium bromide pellet method was employed. The sample was thoroughly mixed with dry powdered potassium bromide (KBr) and the mixture was compressed to form a disc using dies. The disc was placed in the spectrophotometer and the spectrum is recorded.
Partition coefficient7
A partition or distribution-coefficient is the ratio of concentrations of a compound in a mixture of two immiscible phases at equilibrium. These coefficients are a measure of the difference in solubility of the compound in these two phases. Normally one of the solvents chosen is water while the second is hydrophobic such as octanol. Hence both the partition and distribution coefficient are measures of how hydrophilic ("water loving") or hydrophobic ("water fearing") a chemical substance is. Partition coefficients are useful for example in estimating distribution of drugs within the body.
Hydrophobic drugs with high octanol/water partition coefficients are preferentially distributed to hydrophobic compartments such as lipid bilayers of cells while hydrophilic drugs (low octanol/water partition coefficients) preferentially are found in hydrophilic compartments such as blood serum.
The partition coefficient of Paclitaxel was determined in octanol/water, n-hexane/water, oleyl alcohol/water and dichloromethane/water systems at room temperature. 5ml of organic phase and 10ml of aqueous phase were taken in a glass stopper graduated tube and 100mg of accurately weighed drug was added. The mixture was then shaken using mechanical shaker periodically for 24 hrs at room temperature. The mixture was transferred to a separating funnel and allowed to equilibrate for 6 hrs. The aqueous and organic phase were separated and filtered through membrane filter and drug content in the each phase was analyzed by UV spectrophotometer. The apparent partition coefficient was obtained by the ratio of Paclitaxel concentration in organic phase to aqueous phase.
Co is concentration of drug in organic phase and Cw is
concentration of drug in aqueous phase
ANALYTICAL METHOD DEVELOPMENT Drug scan for λmaxand standard graph in IPA
1426
Preparation of Stock solution for IPA:
Accurately weighed Paclitaxel (100mg) was taken in 100mL of volumetric flask and Isopropyl alcohol, was added up to
100mL to get 1000μg/ml (Stock solution –I). From the prepared stock Solution 10mL taken and diluted to 100mL
with IPA to get 100μg/mL (Stock solution-II).
Standard Calibration curve of Paclitaxel:
From the stock solution, serial dilutions were done to obtain solutions in the concentration ranging from 5 – 45 ug/ml. The absorbance of the solutions was measured against isopropyl alcohol (IPA) as blank at 227 nm using the UV spectrophotometer. The plot of absorbance versus concentration was plotted.
Drug scan for λmax and standard graph in Phosphate
buffer saline 7.4
Preparation of stock solution for pH 7.4 phosphate buffer:
Accurately weighed Paclitaxel (5mg) was taken in 100ml of volumetric flask and PBS pH 7.4 was added up to 100mL to
get 50μg/mL (stock solution).
Standard Calibration curve of Paclitaxel:
From the stock solution, serial dilutions were done to obtain solutions in the concentration ranging from 5 – 45 ug/ml. The absorbance of the solutions was measured against PBS 7.4 as blank at 227 nm using the UV spectrophotometer. The plot of absorbance versus concentration was plotted.
FORMULATION OF NANOCRYSTALS
Different molar ratios of Povidone as stabilizer will be evaluated at 1:1, 1:2, 1:4 and 1:10 molar ratios and observed for physicochemical parameters and stability. The composition of the formulations is presented in Table: 3.3.
Table 1: Formulations of Nanocrystals with PVP as stabilizer
Formulation F1 F2 F3 F4
Qty of drug(mg) 22mg 22mg 22mg 22mg
Volume of solvent(mL) 1mL 1mL 1mL 1mL
Volume of anti solvent(mL)
1mL 1mL 1mL 1mL
Stirring speed 150 rpm 150 rpm 150 rpm 150 rpm
Qty of stabilizer(mg) 129 258 516 1290
Molar ratio 1:1 1:2 1:4 1:10
CHARACTERIZATION AND EVALUATION OF PACLITAXEL NANOCRYSTALS
The prepared nanocrystals were evaluated for various parameters such as Description, particle morphology, pH, Particle size distribution, Zeta potential, surface morphology, In vitro release, assay and related substances.
Description, Color, clarity and pH8
Procedure: The contents of three vials were collected and
the material was transferred to in a dry beaker and examined for description, clarity and pH.
Microscopic evaluation
Procedure: A drop of formulation was placed in the middle
of a clean slide and a cover slip was placed gently over the drop at an angle, with one edge touching the slide. The excess liquid and air bubbles were removed. The prepared
slide was placed onto the stage of the microscope. The shape of crystals was observed under microscope using 40X eyepiece and the images were captured by using Motic Image softwares.
Particle size and size distribution9
The particle mean diameter and size distribution were determined using particle size analyzer (Horiba, nanoparticle analyzer SZ-100 series).
Procedure: 1mL of the sample was diluted to 10mL with
water. 5mL of this diluted sample was transferred to the cuvette and the particle size was measured. The Particle size can be determined by measuring the random changes in the intensity of light scattered from a suspension and Stokes-Einstein equation is used to calculate the particle size.
Dh= KBT/3Dt
Where:
Dh= the hydrodynamic diameter
Dt = the translational diffusion coefficient kB= Boltzmann’s constant
T = temperature
= dynamic viscosity
Zeta potential10
Zeta potential is a measure of the charge on a particle surface in a specific liquid medium and useful for understanding and predicting interactions between particles in suspension. Zeta potential is defined as the potential measured in mV at the slipping plane distance from the particle surface. 1mL of the sample was diluted to 10mL with water, 5mL of this diluted sample was transferred to a cuvette and the zeta potential was measured.
Zeta potentials is calculated based on Smoluchowski equation
α/[Ѵ/L]
Where
ζ= Zeta potential η=Viscosity of solution ε=Dielectric constant
U=Electrophoretic mobility
α=Speed of the particle (cm/sec)
V=Voltage and L=Distance of electrode
Table 2: Thumb Rule: Zeta potential
Maximum agglomeration and precipitation +3 to 0 Excellent agglomeration and precipitation - 1 to–4 Threshold agglomeration and precipitation -5 to -10 Plateau of slight stability and few agglomeration
-21 to -30 Moderate stability and no agglomeration -31 to -40
Good stability - 41 to -50
Very good stability -51 to - 60
Shape and surface morphology
microscope brass stub. The stubs were placed briefly in a drier and then coated with gold in an ion sputter. Pictures of nanoparticles were taken by random scanning of the stub. The shape and surface morphology of the nanoparticles was determined from the photomicrographs of each batch.
In vitro drug release study11-14
Dissolution media & Volume optimization
Sink condition and saturation solubility of paclitaxel was determined by adding weighed quantity of API to 50mL Phosphate Buffered Saline with various amounts of polysorbate 80 [2%, 4% and 6%] and mixed thoroughly for 60 minutes. Suspensions were allowed to saturate for 48 hours at room temperature. Samples were collected by filtration and analyzed at 227nm by UV Visible spectrophotometer.
Maximum Dissolvable Dose = V *CS/ Sink
Modified diffusion apparatus for In vitro release
The in vitro release of formulations was carried out by membrane diffusion technique using dialysis sack of Molecular weight cutoff 1000. Membrane was soaked in water for 30minutes to remove traces of preservative an tied to one end of the glass test tube which constituted donor compartment. 2ml of the formulation was transferred to donor compartment and placed into receptor compartment of 400mL of Phosphate Buffer saline at pH 7.4 with 6% polysorbate80 maintained at a temperature of 37°C and rotated at 300rpm using a magnetic stir bar. At specified time points the samples were collected and replaced with fresh buffer immediately after sampling. These samples were filtered through 0.45μm membrane filter and analyzed
spectrophotometrically at 227 nm after suitable dilution if necessary using appropriate blank.
3. RESULTS AND DISCUSSION
PREFORMULATION STUDIES Drug solubility
Paclitaxel was found to be insoluble in water, soluble in ethanol, dichloromethane and DMSO (dimethyl sulphoxide). A comparative profile of the drug solubility in these solvents is shown in Fig.
Table 3: Solubility of drug in different solvents
S.NO SOLVENTS SOLUBILITY[mg/mL]
1 NMP 15
2 Ethanol 22
3 PEG 30
4 DMSO 35
5 Propylene glycol 0.5
6 Soy bean oil 0.5
7 Water 0.1
8 Acetonitrile 26
9 Tertiary Butanol 5
10 Dichloromethane 22
11 Isopropyl alcohol 15
Fig.4.1 Solubility Graph of
Paclitaxel
As seen in the Table 4.1 it is clear that the solubility of paclitaxel was highest in DMSO and lowest in water.
Drug excipient compatibility studies
As part of the compatibility studies, FTIR studies were performed. The FTIR spectra are shown in Fig 1.The FTIR studies of pure drug and stabilizer PVP was carried out to detect any major interference between drug and PVP using FTIR (Bruker Corporation).
Fig 1: Drug excipient compatibility studies
As seen in the spectra, the physical mixture did not show significant change compared to pure drug. Correlation between the physical mixture and pure drug is more than 98%.
Partition coefficient
The partition coefficient of Paclitaxel was performed in four different solvent systems and the results were shown in the Table.
Table 4: Partition coefficient of Paclitaxel Solvent
system
Solvent Diluted with
AbsorbanceConcentration mg/mL
K Log p
Octanol-water
Octanol IPA 0.915 98.78 461.40 2.66
Water PBS 0.118 0.216
DCM –
water
DCM IPA 0.160 320 612.66 2.91
1428
Hexane-water
Hexane IPA 0.906 101 1057 3.02
Water PBS 0.040 0.190
Oleyl alcohol-water
Oleyl alcohol
IPA 0.50 111.1 2710 3.43
Water PBS 0.088 0.41
The results of log P values indicate high lipophilicity of Paclitaxel.
Standard calibration curve in Isopropyl alcohol
Spectrophotometric measurements of different dilutions in Isopropyl alcohol are shown in Table. The curve was found to be linear in the range of 4- 20µ g/ ml at 227 nm with slope 0.046 and regression value 0.998 as shown in Fig.
Table 5: Absorbance values of Paclitaxel in Isopropyl alcohol CONCENTRATION(µg/ml) ABSORBANCE(227nm)
0 0
4 0.194
8 0.397
12 0.548
16 0.732
20 0.914
Fig 2: Standard graph in Phosphate Buffered saline 7.4
The concentrations of Paclitaxel and the corresponding absorbance values are shown in the Table 4.9. Plot of concentration versus absorbance is shown in Fig 4.6. The solutions obeyed Beer-Lambert’s law over a concentration
range of 5 to 45µ g/ml with a regression coefficient of 0.999.
Table 6: Data for standard graph of Paclitaxel in 7.4 pH phosphate buffer.
Concentration (µg/mL) Absorbance at 227nm
5 0.157
10 0.26
15 0.37
20 0.49
25 0.576
30 0.68
35 0.782
40 0.885
45 0.979
CHARACTERIZATION OF PACLITAXEL
NANOCRYSTAL FORMULATION Description, Color, pH
All the formulations of Paclitaxel Nanocrystals were evaluated for their physical description characteristics.
Table 7: Description, color, pH, microscopy of formulations S.
No
Conc Formulation code
StabilizerMolar ratio
pH Type of crystals
Description
1.
10mg/mL F1 1:1 4.67 Spherical A clear
2. F2 PVP 1:2 4.6 shaped
crystals
colorless solution
3. F3 1:4 4.6
4. F5 1:8 4.7
MICROSCOPIC STUDIES
The morphology of PVP based nanocrystals was observed using Compound Inverted Microscope [Motic Instrument, Canada]. The morphological characterization was shown in Fig.
Microscopic images different molar ratios of PVP formulations
Fig 3: Microscopic images different molar ratios of PVP formulations
In case of 1:1, the shape of the crystals was found to be spherical and the size was very small. In 1:2 preparations, large sized crystals were observed but the shape was not uniform. In 1:4 preparations, the crystals were found to be layered and 1:10 preparation aggregation was observed.
PARTICLE SIZE DISTRIBUTION
NANOCRYSTAL FORMULATION USING PVP
Particle size of all formulations was found to be in the nanometer range. The particle size data is shown in Table.
Table 8: Particle size of PVP Stabilized formulations Particle size Molar ratio [PVP]
1:1[F1] 1:2[F2] 1:4[F3] 1:10[F4]
D10 40nm 40nm 57nm 80nm
D50 65nm 100 nm 120nm 125nm
D90 78nm 200nm 426nm 500nm
Davg 71 nm 120nm 160 nm 212nm
PDI 0.200 0.380 0.800 0.910
All the formulations showed nanosized particles as seen in Table 4.11. The size of Paclitaxel Nanocrystals in this study ranged between 71and 212nm. The particle size of different molar ratios was found to be in the following order F1 [1:1] <F2[1:2]<F3[1:4]< F4[1:10]. Major difference in particle size data was observed in F1 and F2 formulations. As the distribution ratio increased from 1:1 to 1:2, the average size of preparations increased significantly from 71nm to 120nm. As higher concentration of the stabilizer did not yield lower particle sizes, the optimum drug: stabilizer ratio was found to be 1:1.
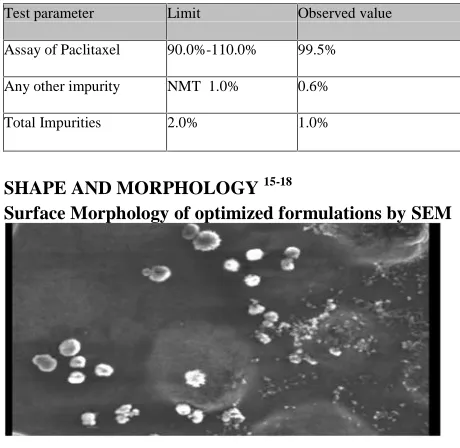
Table 9: Assay Of Paclitaxel Nanocrystals
SHAPE AND MORPHOLOGY15-18
Surface Morphology of optimized formulations by SEM
Fig 5: Surface Morphology of optimized formulation RELEASE KINETICS
The Zero order cumulative % drug release data of various Paclitaxel nanocrystal formulations is shown in the Table.
Table 10: Zero order release profile of optimized formulations Time in hours Cumulative % drug release
0 0
6 39
12 59
24 70
30 76
36 80
48 89
54 95
60 95
72 98
Regression coeffecient and diffusion coeffecient values observed in various kinetic models for four formulations of nanocrystals
Table 11: Regression coefficient and diffusion coefficient values Formulation Zero Order First Order Higuchi KorsmeyerPeppas
R2
R2
R2
R2
N
PVP[F10] 0.908 0.964 0.916 0.916 1.229
ASSAY AND DEGRADATION PRODUCTS:
Assay for four optimized formulations was performed by gradient HPLC method and the results are reported in the Table 4.22.
SYRINGEABILITY AND INJECTABILITY
Diluted suspensions of four formulations were evaluated for their syringeability and injectability properties and the results are tabulated in Table.4.24. All the formulations passed freely through the different needle sizes.
STERILITY TESTING
The sterility test was conducted according to the USP XXIII method. No microbial growth was observed after incubation for 14days and the preparation was found to be sterile.
STABILITY STUDIES
Parenteral nanocrystal optimized formulations were kept at accelerated stability at 400C±20C/75%±5% RH. It was observed that there was no change in the physical appearance of the formulation during the stability. Formulation remained clear and colorless solution at the end of stability. The pH of the formulation remained unchanged during stability. Assay and related substances shown gradual increase in however the product complied with specifications.
4. CONCLUSION
The present study was to increase the bioavailability and improve therapeutic activity of tumor targeting. Paclitaxel was the drug of our choice.Paclitaxel nanocrystals were successfully formulated using different types of stabilizers and polymer by nanoprecipitation method.No drug-polymer interactions were seen when the drug was formulated.The prepared nanocrystals were characterized for particle size, Zeta-potential and surface morphology and evaluated for in-vitro drug release.The mean particle size of formulation was found to be 17.7nm and 250nm respectively.Zeta potential was found to be -32mV indicating the stability of Nanocrystals. From the particle size analysis, four formulations were optimized based on nano size and zetapotential. In-vitro drug release studies were conducted for optimized formulations by using dialysis sac method. The formulations exhibited burst release formulation showed prolonged drug release upto 72hr. hrs all the formulations could pass freely through the needle size of 13 mm and showed different levels of redispersibility at different time intervals. The formulations F1, F7,F11 and F15 were found to be stable following accelerated stability studies at 40°C±2°C/75±5% RH for 3months.The nanocrystals were found to be stable at stabilizer concentration of 1:4 Molar ratio of drug: stabilizer.
5. REFERENCES
1. Lipinski, C. Poor aqueous solubility–an industry wide problem in drug discovery. Am. Pharm. Rev 2002; 5: 82–85
2. Heimbach, T. et al. (2007) Overcoming poor aqueous solubility of drugs for oral delivery. In Prodrugs:
Test parameter Limit Observed value
Assay of Paclitaxel 90.0%-110.0% 99.5% Any other impurity NMT 1.0% 0.6%
1430
Challenges and Rewards, Part I. Ed Valentino J. Stella, Ronald T. Borchardt, Michael J. Hageman, Reza Oliyai, Hans Maag, Jefferson W. Tilley p. New York,: Springer & APPS Press;2007.p 157-215
3. Edward KH, Li D. Drug like Properties: Concept, Structure, Design and Methods, from ADME to Toxicity Optimization. Elsevier; 2008. Solubility; p. 56 4. Paclitaxel USP <34> and Paclitaxel Injection USP
<34>. p: 4195-98.
5. Water solubility, OECD Guideline for The Testing of Chemicals [105], 27.07.1995
6. Ketkee S Jinnawar and Krishna R Gupta. Drug excipient compatibility study using thermal and non thermal methods of analysis. International Journal of Chemtech Applications 2013; 2 (2): 23-49.
7. Test No.123: Partition Coefficient (1-Octanol/Water): Slow-Stirring Method, OECD Guideline for The Testing of Chemicals. 11.07.2006
8. Description and Solubility, USP 34. 9. Einstein, A. Ann. der Physik 1905;17: 549
10. RJ Hunter. Zeta Potential in Colloid Science: Principles and Applications, Academic Press, New York, 1981 11. Brian R.Rohrs. Dissolution Method Development for
Poorly Soluble Compounds. Dissolution Technologies [August2001]; 1-5
12. Harekrishna Roy, Chandan Kumar Brahma, Ravi Kumar, Sisir Nandi. Formulation of saquinavir mesylate loaded microparticle by counterion induced aggregation method: Approach by hyperosmotic technique. Drug Invention Today 2013; 5:259-266.
13. Sanjay Kumar Panda, Asim Kumar Biswal, Kirti Ranjan Parida, Harekrishna Roy. Design and In-Vitro Evaluation of Gastro Retentive Floating Microbeads of Zidovudine Hydrochloride. International Journal of Pharma Research & Review, June 2013; 2(6):1-8. 14. Harekrishna Roy, Sri Bhavani. Design and In-vitro
Evaluation of Fast Dissolving tablet of Urapidil Hydrochloride. Int J Pharma Res Health Sci 2015; 3(4): s867-s871.
15. Harekrishna Roy. Formulation of Sustained Release Matrix Tablets of Metformin hydrochloride by Polyacrylate Polymer. . Int J Pharma Res Health Sci. 2015; 3(6): 900-906
16. Neha R Durge, Kirti Parida, Harekrishna Roy. Formulation Development and Characterization of Anti-Retroviral Agents. International Journal of Pharma Research and Health sciences 2016; 4(6): 1517-1521 17. Harekrishna Roy, Bhabani Shankar Nayak.
Formulation and Design of Microparticles based Drug Delivery System of Selective Anti-Retroviral Drug by Chitosan. Scholars academy journal of pharmacy 2017; 6(1): 34-39
18. Harekrishna Roy, Bhabani Shankar Nayak. Formulation and Design of Microparticulate Drug Delivery System of Lamivudine by Chitosan as Natural Polymer. Scholars Journal of Applied Medical Sciences 2017; 5(1D):267-272
Conflict of Interest: None