ISSN (e): 2250-3021, ISSN (p): 2278-8719
Vol. 04, Issue 01 (January. 2014), ||V3|| PP 24-29
Locational Image Compression based on Chain Code
Representation
Prof. Dr. Tawfiq Abdulkhaleq Abbas
1, Fanar Ali Joda
21(Collage of Information Technology – Babylon University - Iraq) 2(Collage of Information Technology – Babylon University - Iraq)
Abstract: - In this research we have proposed a new compression algorithm that used locational compression technique based on Freeman chain code. The technique consists of two parts, the first part is compression algorithm which starts by obtaining the chain code for particular color value then saving location of start point for chain code, color value and chain code in compressed file, the next step is to remove all color values that related to chain code from input image and shrink the input image, the algorithm repeats the previous procedures until there will be no color values with significant chain code. The second part is to construct the original image by using start point, color value and chain code.
Keywords: - Chain code, Compressed, Decompressed, Lossless image compression.
I.
INTRODUCTION
Data compression defined as the process of converting an input data stream (the source stream or the original raw data) into another data stream (the output, or the compressed, stream) that has a smaller size. [1] There are many methods for data compression. They are based on different ideas that are suitable for different types of data, such as (text, images, and sound) and produce different results. [2]
The image compression is done by removing all redundancy that may exist in image data file so that it takes up less storage space and requires less bandwidth to be transmitted. [3]
The data redundancies comprise of three basic redundancies: coding redundancy, inter-pixel redundancy, and psycho-visual redundancy, Coding redundancy some gray levels are more common than others, Inter-pixel redundancy the same gray level covers large areas , Psycho-visual redundancy some color differences are imperceptible. [4]
Two types of data compression algorithms can be explained: lossless and lossy. Lossy technique causes image quality degradation in each compression/decompression stage. Careful consideration of the human visual perception guarantees that the degradation is often unrecognizable, though this depends on the selected compression ratio. In general, lossy techniques offer far greater compression ratios than lossless techniques.[5] There are methods of lossy image compression like vector quantization (VQ), JPEG, subband coding, fractal based coding and etc. [6]
Lossless coding guaranties that decompressed image is completely identical to the image before compression. This is an important requirement for some application domains, e.g. medical imaging, where not only high quality is in demand, but unchanged archiving is a legal requirement. Lossless techniques can also use for the compression of other data types where loss of information is not acceptable, e.g. text documents and program executable. [5]
There are methods of lossless image compression like Run Length Encoding, Huffman Encoding, Entropy Encoding, Arithmetic coding, and Quadtree. [1]
Data compression reduces the bits, by identifying and eliminating statistical redundancy, hence the compression with proposed system be able to encode color values even if they are irregularly distributed on the contrary a lot of other compression algorithms that require statistical redundancy are distributed in regular form.
1.1 FREEMAN CHAIN CODE [8]
The first approach for representing digital boundary was introduced by Freeman in 1961 using chain codes. Freeman states that in general any representing scheme must satisfy 3 objectives [7]:
must faithfully preserve information of interest
permit compact storage
must facilitate any required process
There are two types to define the neighborhood of a given image pixel in digital image processing: 4- and 8-connectivity, as depicted in Fig.(1). The 4-connectivity allows only vertical and horizontal movements between adjacent pixels, whereas the 8-connectivity also uses diagonal connections, the example as depicted in Fig.(2). [9]
Figure (2) Freeman chain code (Clockwise – start from zero)
A. Chain code 4-connectivity = 01003030303232322121210121, B. Chain code 8-connectivity = 757701133345
In proposed method we used chain code 8-connectivity to encode color values of the image by select a specific color value that represents a seed and then check the neighboring pixels and later moving to the adjacent pixel which represents a new seed and so on.
II.
THE PROPOSED SYSTEM
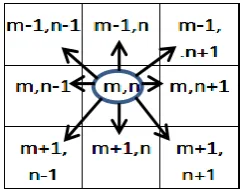
The proposed system is lossless image compression, mainly based on the location and the color value by using Freeman chain code 8-directional, the benefit of using Freeman chain code 8-directional as depicted in Fig.(3) to encode color values irregular distribution.
Figure (3) Freeman chain code 8-directional window
The proposed system consists of two parts, as follows:
In first part the frequencies of color values are found then selecting the color value (x1) with the highest frequency and to find chain code for selected color value (x1) in case of satisfying the threshold length condition then replace the locations of color value (x1) according to chain code with special value that is considered as indicator and save location of start point of chain code, color value and chain code in compressed file, then we search another chain code that belongs to same color value (x1) when we complete from find all chain codes that belong to same color value (x1) then we select another color value (x2) and apply previous procedures and so on .
Figure (1) A. chain code 4-connectivity B. chain code 8-connectivity
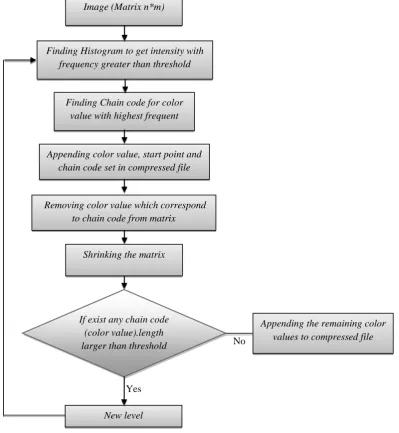
In the next step we will remove special values and shrink input image by shifting the color values, the aim of this procedure is to increase probability of obtaining new chain codes for color values were spaced, these previous steps represent (Level) as depicted in Fig.(4) (encoding part).
Another level is handled and achieved in the same previous steps and stopping when the shrinking image has not any chain code satisfying the threshold length condition, Fig.(5) explains proposed system. In the second part the process will be inverse compared to the process of compression, the first step is to start with values remaining in the last level (level n) of the compression process and the second step based on the start points, color values and chain codes where the image will grow when you return the color values that associated with a specific level down to (level 1) then we get the original image.
.
Figure (4) Block diagram proposed system for encoding part
Yes
No
Image (Matrix n*m)
Finding Histogram to get intensity with frequency greater than threshold
Finding Chain code for color value with highest frequent
Appending color value, start point and chain code set in compressed file
Removing color value which correspond to chain code from matrix
Appending the remaining color values to compressed file Shrinking the matrix
If exist any chain code (color value).length larger than threshold
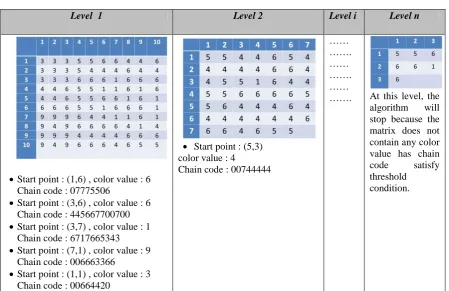
Level 1 Level 2 Level i Level n
Start point : (1,6) , color value : 6 Chain code : 07775506
Start point : (3,6) , color value : 6 Chain code : 445667700700
Start point : (3,7) , color value : 1 Chain code : 6717665343
Start point : (7,1) , color value : 9 Chain code : 006663366
Start point : (1,1) , color value : 3 Chain code : 00664420
Start point : (5,3) color value : 4 Chain code : 00744444
…… ……. …… ……. ……
……. At this level, the algorithm will stop because the matrix does not contain any color value has chain code satisfy threshold condition.
Figure (5) illustrate an example of Image (Image size =10 *10, Length of Threshold=7, No. of colors =16)
Note: in Fig.(5) was used Conditional Chain code as depicted in Fig.(6.B).
It is worth mentioning in proposed system chain code method works in a clockwise direction starting from the zero value, then we add a condition based on the previous encoding for chain code regardless of traditional direction chain code as depicted in Fig.(6.B), in case of the condition is false then the search based on traditional chain code (clockwise) as depicted in Fig.(6.A)
The goal of adding this condition is to get a chain code having frequent symbols to enable it to compress using compression method that based on repetitive sequence encoding to increase compression ratio.
A B
Figure (6) an example to explain difference between Traditional Chain code and Conditional Chain code A. Traditional Chain code = 00006666644442000303030,
III.
ALGORITHMS AND EXPERIMENTALS RESUTLS
3.1 ALGORITHMS
3.1.1 Compressed Algorithm:
Input: image file
Output: text file Begin
Read image file then convert it to matrix. Repeat
Find Histogram for color values of matrix and save it in vector.
Sort the vector of histogram (descending order). Index = 1
Repeat
Select (color value) with the highest frequency from the histogram vector.
Select (start point) that belong to color value. Obtain (chain code) for selected color value. If (chain code (color value).length>threshold) then Begin
Save (color value, start point and chain code) in compressed file.
Replace locations of color value which correspond to chain code with special value (sv).
End;
index = index + 1.
Until histogram (index) = n.
Remove special value (sv) from matrix then shrink matrix.
Until shrunk matrix has not chain code (color value).length > threshold.
End.
3.1.2 Decompressed Algorithm: Input: compressed file (text file). Output: image.
Begin
Reverse the vectors that save chain codes, color values, start points.
Create matrix and full it with color value that belong to shrunk matrix (final level).
n=final level (encoding part). Repeat
Insert color value that based on chain code that belongs to same level.
n=n-1. Until (n=0) End.
3.2 EXPERIMANTALS RESUTLTS
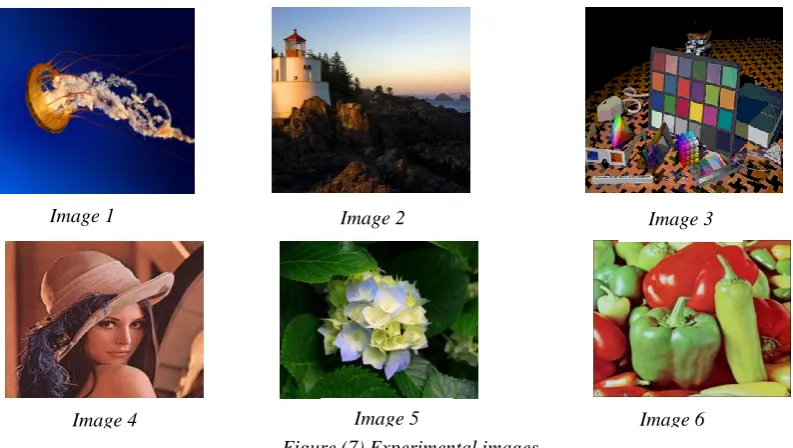
Experiments are performed on 6 color images with 256 colors (8 bpp) as given in Fig.(7) to verify the proposed system:
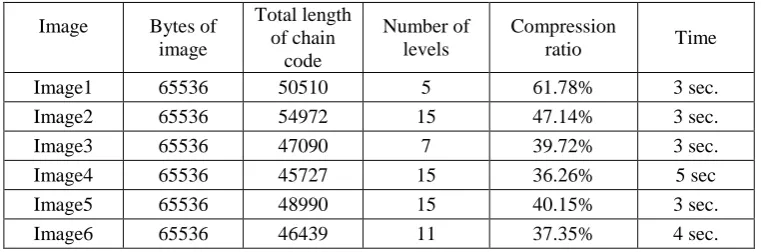
After proposed system is applied on the images above with size of 256*256 and 512*512 we get the following results as depicted in Table (1) and Table (2) respectively.
Each symbol in chain code we get it offer 5 bits because each symbol in chain code needs 3 bits (values 0 to 7) to represent it.
We compute compression ratio as following:
Compression ratio = ((T * 5 / 8) – (N * 3 + L) * 100) / (H * W)
Where: T: Total length to chain codes, N: Number of chain codes
L: Number of levels, H: Height and W: Width.
Image 4 Image 5 Image 6
Figure (7) Experimental images
Table (1) compression results of images size 256*256
Table (2) compression results of images size 512*512 Note: Each chain code needs additional 3 bytes (1 byte for value, 2 bytes for start point)
IV.
CONCLUSIONS
In this research, we have proposed an efficient lossless image compression based on location by using Freeman chain code representation, based on the experimental results, we note the following points:
1. Compression ratio is influenced by length of threshold in addition to compress chain code vector. Therefore to get the best compression ratio, we make proposed system adaptive in terms of (the length of the threshold, compress chain code vector).
2. Compression ratio increases when size of image is increasing.
3. The time required for image compression is influenced by size of image and distribution of color values in the image.
4. The time required for decompressed images (in Fig.(7)) does not exceed one second it is just process of returning of color values to their original positions in the image depending on chain code that consider as indicator .
V.
REFERENCES
[1] Salomon, D. , "Data Compression the complete reference", Springer-Verlag, United States of America, New York, 5rd Edition, 2010.
[2] Bell T.,c., cleary J.,G. , Witten I.,H., "Text compression", Prentice-Hall Englewood Cliffs, New Jersey, 1990. [3] Sindhu M., Rajkamal R. , "Images and Its Compression Techniques –A Review", International Journal of Recent
Trends in Engineering, Vol 2, No. 4, November 2009.
[4] R. C. Gonzales,. And R.E. Woods, Digital Image Processing, Prentice-Hall, 2002.
[5] Sebastian Deorowicz, “Universal lossless data compression algorithms”, Silesian University of Technology Faculty of Automatic Control, Electronics and Computer Science Institute of Computer Science, 2003.
[6] Chin-Chen Chang, Chih-Ping Hsieh, and Ju-Yuan Hsiao , A New Approach to Lossless Image Compression, 2003. [7] Talal A., Omar R., "A Chain Code Approach for Recognizing Basic Shapes", University Of Jordan.
[8] H. Freeman, "On the encoding of arbitrary geometric configurations", IRE Transactions on Electronic Computers EC-10 (1961) 260–268.
[9] Shahab W., Al-Otum H, and Al-Ghoul F., "A Modified 2D Chain Code Algorithm for Object Segmentation and Contour Tracing" , The International Arab Journal of Information Technology, Vol. 6, No. 3, July 2009.
Image Bytes of image
Total length of chain
code
Number of levels
Compression
ratio Time
Image1 65536 50510 5 61.78% 3 sec. Image2 65536 54972 15 47.14% 3 sec. Image3 65536 47090 7 39.72% 3 sec. Image4 65536 45727 15 36.26% 5 sec Image5 65536 48990 15 40.15% 3 sec. Image6 65536 46439 11 37.35% 4 sec.
Image Bytes of image
Total length of chain
code
Number of levels
Compression