www.pharmascholars.com
253
Research Article
CODEN: IJPNL6
MEASURING SERVICE QUALITY OF PHARMACIES-A STUDY WITH REFERENCE
TO THREE MAJOR INDIAN CITIES
P. Uma Maheswari Devi*
,1, B. Sankara Rao
2, B. RajaShekhar
3, N. Udaya Bhaskar
1 1Department of Management studies, University College of Arts & Commerce, Adikavi Nannaya
University, Rajah Rajah Narendra Nagar, GSL POST, Rajahmundry-533296, Andhra Pradesh,
INDIA
2
Department of Mathematics, Adikavi Nannaya University, Rajah Rajah Narendra Nagar, GSL
POST, Rajahmundry-533296, Andhra Pradesh, INDIA
3
School of Management studies, University of Hyderabad, Hyderabad, Andhra Pradesh, India
*Corresponding author e-mail: [email protected]
ABSTRACT
The Pharmacists have a very important role in protecting the health of the customers through proper dispensing of drugs and providing better services. But the errors made in processing prescriptions are growing with the increasing prescriptions. In this scenario we made an attempt to measure the quality of services provided by pharmacists. CFA (Confirmatory Factor analysis) was used and a PHARMQUAL scale with three dimensions-Empathy, Assurance and Reliability and nine items were developed. The relationships between the pharmacists “perceived service quality” and “satisfaction” were also examined. The analysis of data was conducted through Structural Equation Modeling (SEM) using AMOS (Analysis of Moment Structures). A Sample of 350 chemists from three major Indian cities was purposively selected. The role of organized and unorganized pharmacies was also examined. This study is very useful for the doctors, manufacturers (pharmaceutical companies) and customers to evaluate the role of the pharmacist and identify the deficiencies in the quality of pharmacy practice.
Key words: Pharmacist, Service Quality, Satisfaction, CFA.
INTRODUCTION
The role of pharmacist has changed tremendously with the changing times.The modern pharmacist has more professional duties in addition to dispensing of drugs. He has to identify drug-related problems, advice patients about the proper usage of medicines, maintain relationships with them and health care professionals and ultimately assure that no harm is done to the patients. Currently the Pharmacists are overburdened with prescriptions which give chance for committing errors. The Kaiser Family Foundation estimated that there are over three and one half billion prescriptions filled by pharmacies annually.
According to a study by the Auburn University College of Pharmacy, community pharmacies make
an average of four errors for every two hundred and fifty prescriptions filled. On an average, for every one thousand prescriptions dispensed, a pharmacy in the United States will dispense one prescription that contains an error with, at least, the potential to cause serious injury or death. The Drug Topics survey indicated that it was not only high volume that caused errors. Several of the pharmacists reported that they had made errors in the last couple of months on days when they filled less than 100 prescriptions. The most serious of these errors are commonly referred to as “mechanical errors”, because they involved a purely mechanical misstep. These usually do not involve professional judgments or decisions, but are simple human mistakes. As typically defined, “mechanical errors” are (1) wrong drug dispensed; (2) wrong strength of the drug dispensed; and (3)
International Journal of Pharmacy
www.pharmascholars.com
254
wrong directions placed on the label. According tothe Pharmacists Mutual® Insurance Company Claims -Study of claims against pharmacies, pharmacists or pharmacy technicians, mechanical errors represent more than eighty percent of all claims reported to the insurance company over the past two decades., (Pharmacists Mutual® Claims Study 1989 through 2008).
In this scenario we have made an attempt to study the role of Pharmacists in delivering quality services to customers in both organized and unorganized pharmacies in three major cities in India. The study mainly examined the critical factors of functional service quality and developed a scale for the measurement of functional service quality of pharmacists.
Concept of service quality: Service quality is a multi-faceted concept and many studies have illuminated different aspects of service. “Service quality is a comparison between expectations and performance”[1]. Perception of service quality is
determined by “Prior expectations of what will and what should transpire and the actual delivered service”[2]
. [Service] quality factors are those primarily under the control of management in contrast, the [customer] satisfaction factors are those that impact the experiential aspects of the service purchase from the customer’s point of view[3]
. Grönroos defines service quality as “the outcome of an evaluation process, where the customers compare their expectations with the service they have received” [4]
. In his model he differentiated between the three components of service quality.
Technical quality: determines what the buyer receives as the result of buying the actual service (result dimension);
Functional quality: determines how the service is provided, according to subjective perception of the customer and the customer evaluates the service procedure (process dimension); and Image: shows how the characteristics, originated by and connected to the technical and functional service quality, such as traditions, policies, social connections, service standards and goodwill are mingled. According to Zeithaml and Bitner, service quality is “the delivery of excellent or superior service relative to customer expectations”[5]. In our study we mainly examined the
critical factors of service quality which are affecting the ability of pharmacists in delivering excellent service. Various studies have been done relating to service quality of pharmacies. Pharmaceutical care has caused considerable attention in the pharmacy
literature. Pharmaceutical care represents a significant transition in the profession of pharmacy, where the primary focus is the patient and outcomes of care rather than the distribution of drug products. David et al., evaluated the relative importance of functional quality and technical quality on patient perceptions of pharmaceutical service quality[6]. They used a scenario-based experimental design to manipulate functional (FQ) and technical quality (TQ) and found that FQ had the greatest impact on patient perceptions of service quality and behavioral intentions. Waleed M.S. et al., evaluated the concept of pharmaceutical care as a standard of quality care for many hospital pharmacy practices[7]. Janković SM et al., compared the service quality in public and private pharmacies in the city of Kragujevac by measuring patient care and health facility indicators[8]. The results of their study suggest that there was no real difference in the service quality between the public and the private pharmacies. Skyrius V. et al., found that Lithuanian pharmacists lack databases of patient medication records which hinder them to render pharmaceutical services of the best quality[9]. DaisyVolmer, et al., found that Pharmaceutical care services in Estonian community pharmacies have become more patient-oriented over the past 17 years [10]. Basak SC et al., summarized the state of community pharmacy in India including the provision of patient care, pharmacy education, the pharmaceutical market, healthcare delivery, community pharmacy services, the professional role of community pharmacists, and future development
[11]. Nau. DP described methods for measuring health
www.pharmascholars.com
255
and middle income countries were reviewed byFelicity Smith[14]. Results of thirty studies were identified from all regions in the developing world. They found from all the studies that though there is a huge potential for pharmacies to contribute more effectively to primary health care but, there are a lot of deficiencies in the quality of current professional practice. In particular authors highlighted the lack of presence of pharmacists or other trained personnel, and the provision of advice for common symptoms which was not in accordance with guidelines and the inappropriate supply of medicines. Houle SK et al., conducted a systematic review by identifying remunerated pharmacist clinical care programs worldwide and reporting on uptake and patient care outcomes observed as a result[15]. Sixty new remunerated programs were identified across Canada, the United States, Europe, Australia and New Zealand, ranging in complexity from emergency contraception counseling to minor ailments schemes and comprehensive medication management. In North America, the average fee provided for a medication review is $68.86 (all figures are given in Canadian dollars), with $23.37 offered for a follow-up visit and $15.16 for prescription adaptations. It is against this background where pharmacist has more responsibilities and commitments in preserving the health of the people, we tried to examine the quality of services provided by the pharmacists. Our main focus is on functional quality i.e how the pharmacists are providing services to customers.
OBJECTIVES OF THE STUDY:
1. To identify the critical service quality factors of pharmacist’s perceived service quality
2. To develop and validate a scale for the measurement of pharmacist’s perceived service quality
3. To study the impact of pharmacists perceived Service quality on satisfaction
4. To examine the differences between organized and unorganized pharmacies.
METHODOLOGY
The data was collected using primary and secondary sources. The primary data was collected with the help of questionnaire. Based on the literature and discussions with experts and academicians a questionnaire (Annexure-1) with 22 items was designed. A five point Likert scale was used with a score of 1, indicating ‘strongly disagree’, and a score of 5, indicating ‘strongly agree’ to know the different attitudes of respondents. Research scholars and experienced marketing executives administered the questionnaires. A sample of 350
chemists/Druggists (150-organised, 150-unorganised pharmacies), members of All India Association of Chemists and Druggists were purposively selected for the study from three major Indian cities (150 chemists-Hyderabad, 100-Visakhapatnam and 100- Rajahmundry (annexure-2).
RESULTS AND DISCUSSION
Factors of functional service quality: Exploratory factory analysis (EFA) [using the principle component analysis and varimax approach] was first conducted to identify the critical factors of functional service quality. Five factors were extracted through EFA. The KMO (Kaiser-Meyer-Olkin ) measure of sample adequacy computed indicates the proportion of variance in variables might be caused by underlying factors, and the result indicates an index of 0.887 According to Hair et al., the value above 0.8 is considered meritorious[16]. The total variance explained by above five factors was 55 %. The other statistical prerequisite to continue with exploratory factor analysis is Bartlett test of sphericity. A significant result (<0.05) tells us that there are some relationships between the variables [17] .In this study Bartlett’s test is highly significant (p<.01) suggesting factor analysis is appropriate. This value is significant for this sample at 0.05, χ2 = 2220.027 (p=0.000). (See Table 1)
Item Generation and scale development:
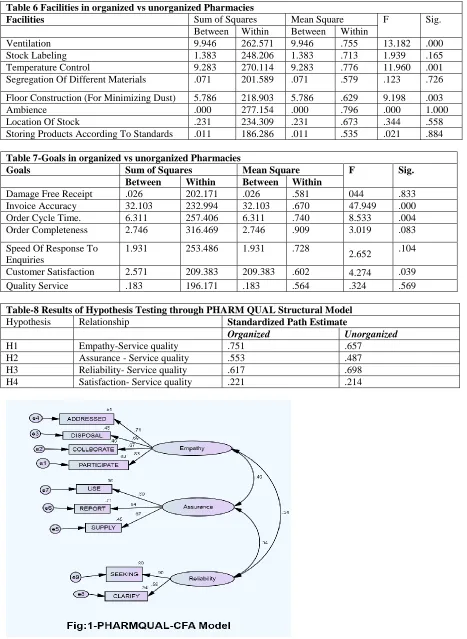
Confirmatory factor analysis: Confirmatory factor analysis (CFA) was used to test the validity of theoretical model. In testing the validity of factorial model, CFA seeks to identify the extent to which the items are designed to measure the particular factor. In order to test the above factor structure more thoroughly, we conducted confirmatory factor analysis. The analysis of data was conducted through Structural Equation Modeling (SEM) using the statistical software AMOS (Analysis of Moment Structures) version -20.0. The process started with preliminary analysis of the data and developing individual CFA model for each factor of the theoretical factor structure that was identified in EFA (see Table1). Several runs of CFA were conducted until satisfactory goodness of fit statistics was obtained. During this process, two dimensions (Factor 2 & Factor 3 -see table1) with low variance were removed. After deletion of two dimensions, a valid scale (PHARMQUAL scale) with three dimensions and nine items emerged. (See Fig: 1.)
www.pharmascholars.com
256
statistics. The p-value of 0.00 for the Chisquarestatistics implies good absolute model fit. RMSEA value (0.064) is between 0.03 and 0.08, indicates an acceptable level of internal consistency [18] and shows the model theory fits the sample data [16].The absolute fit indices of GFI (0.966) and RMR(0.045) are all within the recommended tolerances. The incremental or comparative fit indices also indicate an acceptable level of fit with the IFI (0.964) and CFI (0.964) being above the recommended value. The normed ChiSquare (57.95) is also within the broader recommended range. The amount of squared multiple correlations for all dimensions in the model are more than 0.5 thus indicating acceptable squared factor loadings. All the factor loadings in the CFA model developed are statistically significant at 0.001 level of significance. The fit indices reflect acceptable level of fit and all the indices are within recommended tolerances. (See Table2)
Reliability and Validity: The scale was examined in terms of reliability and validity
Reliability: The reliability of the scale developed was evaluated by the determination of Cronbach’s coefficient α. The overall value of Cronbach’s coefficient α for the nine items in the scale developed after CFA is 0.774 and for the three dimensions individually is –Fac1:0.763, Fac2:0.692 and Fac3:0.623. Reliability for all the constructs exceeded suggested level of 0.60 [19]. This indicates that each of the constructs identified was adequately captured by its indicators. (See table-2).
Content validity: According to Nunnally, content validity depends on how well the researchers create measurement items using the relevant literature to cover the content domain of the variable being measured[19]. The selection of dimensions and items in this study was based on the WHO Reports and partly the service quality measurement scale proposed by Parasuraman et al., [20] (which is extensively used in published service quality literature). The questionnaire was finalized after thorough discussions with experts. The instrument thus has strong content validity.
Convergent validity: The Convergent validity refers to the items that are indicators of a specific construct which should converge or share a high proportion of variance in common[16]. There are three Ways to estimate the relative amount of convergent validity among the item measures: Factor Loadings, Variance Extracted (VE) and Construct Reliability (CR) [21].
Average Variance Extracted (AVE): A good rule of thumb is an AVE of 0.5 or higher indicates adequate
convergent validity. Construct Reliability (CR) is also an indicator of convergent validity. The rule of thumb for a construct reliability estimate is that 0.7 or higher suggests good reliability. High construct reliability indicates that internal consistency exists. This means that all the measures are consistently representing something. The results of the study in the table 3 show that AVE is above 0.5 and C.R is above 0.8 satisfying the above criteria. In addition, all Eigen values of constructs greater than 1.0 also confirm convergent validity [16].
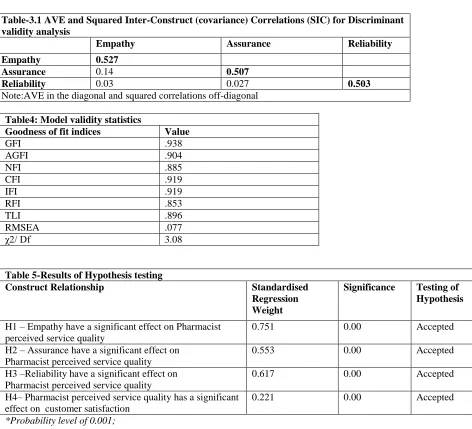
Discriminant validity: Discriminant validity refers to the extent to which a construct is truly distinct from other constructs (i.e., unidimensional). Discriminant validity was checked with the comparison of variance extracted (VE) estimates for each construct with the squared inter-construct correlations (SIC) associated with that construct. In this study all the extracted variance estimates were greater than squared inter-construct correlations, (see Table-3.1) meaning that each construct is unique and captures some experience which other measures do not.
Assessment of unidimensionality using goodness of fit statistics, scale reliability and construct validity (content validity, convergent validity and discriminant validity) therefore confirmed that the scale which emerged during CFA (Figure 1) is a good model. It has three dimensions -Empathy, Assurance and Reliability having nine items. This PHARQUAL scale thus can be used to measure the quality of service provided by pharmacists (See Table- 3,3.1 &4)
Relation between Service Quality and Satisfaction:
Customer Satisfaction is defined as: “The customer’s feeling regarding the gap between his or her expectations towards a company, product or service and the perceived performance of the company, product or service”[22]. Many researchers [2,20,23,24],
www.pharmascholars.com
257
noted that consumer satisfaction exerts a strongerinfluence on purchase intentions than does service quality [24].
In our study the overall satisfaction was measured using three dimensions –the level of satisfaction in terms of facilities in pharmacies and the ability of the pharmacy in achieving the goals and the problems faced by pharmacists. CFA was applied and the dimension- problems has to be removed as it was having low variance. Only Goals and Facilities were retained. As there are only two attributes the fitness indices could not be calculated. The AVE value was more than 0.51 and C.R value is 0.9
PHARMQUAL FINAL STRUCTURAL MODEL- Validity. This final model was developed to test the impact of service quality on satisfaction. The specified model was examined with the observed data in terms of several goodness of fit statistics. The p-value of 0.00 for the chisquare statistics implies good absolute model fit. RMSEA value is (0.077) .The absolute fit indices of GFI (0.938), AGFI (0.904) comparative fit indices -IFI (0.919) and CFI (0.919) also indicate an acceptable level being above the recommended value. All of these values were above 0.90. The normed ChiSquare (132.86)) is also within the broader recommended range. This indicates that the model fits well except for little variations in RFI(0.853),NFI(0.885) [26]. Basically, the structural model is considered to fit the sample data reasonably and can be accepted as a fitting model(see Table 4) .The standardized regression weights in each pathway are provided in table5. This model incorporates all the hypothesized relationships to demonstrate a direct relationship between functional service quality and satisfaction. The overall model is examined using Structural Equation Modeling.
Results of Hypothesis testing: The overall model as presented in Fig: 2 are based on hypothesis framed. This model incorporates all the hypothesized relationships to demonstrate a direct relationship between empathy, assurance and reliability with service quality, and service quality with satisfaction (see Table-5)
Hypothesis 1: The regression path between empathy and Pharmacist perceived service quality is significant (p<0.001) having standardized regression coefficient of 0.751. Therefore, the hypothesis empathy has a significant effect on Pharmacist perceived service quality is supported.
Hypothesis2: The regression path between Assurance and Pharmacist perceived service quality is significant (p<0.001) having standardized regression coefficient of 0.553. Therefore, the hypothesis
-Assurance has a significant effect on Pharmacist perceived service quality is supported.
Hypothesis3: The regression path between Reliability and Pharmacist perceived service quality is significant (p<0.001) having standardized regression coefficient of 0.617. Therefore, the hypothesis -Reliability has a significant effect on Pharmacist perceived service quality is supported.
Hypothesis4: The regression path between Pharmacist perceived service quality and satisfaction is significant (p<0.001) having standardized regression coefficient of 0.221. Therefore, the hypothesis -Pharmacist perceived service quality has a significant effect on satisfaction is supported (See Fig: 2)
Comparison between Organised and Unorganised Pharmacies:
Facilities in Organized and Unorganized Pharmacies: It can be observed from the ANOVA (see table 6) that the ‘F’ value for labeling (1.939), Segregation (0.123), Packaging (0.159)), Ambience (0.00)), Location (0.344) and Storing (0.021) are statistically not significant at 0.05 level. The ANOVA results showed that out of nine variables, three variables-ventilation- F’ value (13.18), Temperature-F value (11.960) and construction- F-value (9.198) were statistically significant at 0.05 levels. There was a significant difference between the pharmacies in facilities like temperature, ventilation and construction. Remaining all other variables are insignificant and it clearly indicates that there is no significant differences between facilities in organized and unorganized pharmacies with regard to labeling, Segregation -Packaging, Ambience, Location and Storing except temperature, ventilation and construction (See Table 6)
Goals in Organized and Unorganized Pharmacies:
It can be observed from the ANOVA (see table7) that the ‘F’ value for Receipt (0.044), Completeness (3.019)), Response (2.652)), Service (0.324) are statistically not significant at 0.05 level. The ANOVA results showed that out of seven variables, three variables-Invoice- F’ value (47.949), cycle time-F value (8.533)) and satisfaction-F-value (4.274) were statistically significant at 0.05 levels. There was a significant difference between the pharmacies in achieving goals like Invoice, cycle time- and satisfaction Remaining all other variables - Receipt ,Completeness, Response and Service are insignificant and it clearly indicates that there are no significant differences between goals in organized and unorganized pharmacies with regard to Receipt ,Completeness, Response and Service except Invoice, cycle time- and satisfaction. (See table7)
www.pharmascholars.com
258
Problems in Pharmacies: The pharmacists are facing various problems which are affecting the performance of the pharmacies. In unorganized pharmacies –Incorrect pricing, increasing players, trade schemes ,limited shelflife,mislabeling are the major problems while in organized pharmacies-medication errors, warehousing, delay in delivery are the major problems identified in three major Indian cities (See fig: 3)
Replication and generalizability of hypothesis testing across type of pharmacy
To test the extent to which the structural model is stable across different traits the findings were replicated with the same sample splitting into grouping variables on the basis of type of pharmacies in an attempt to reduce the error due to capitalization of chance[27]. For cross validation sample was split based on the type of pharmacies. When a comparison was made between types of pharmacy across all the structural relationships the following results emerged as shown in (see Table 8).The relation between Empathy to functional service quality is having a standardized path estimate of 0.751 across organized pharmacies and 0.657 across unorganized pharmacies. The path way is significant (p<0.001). The standardized path estimate between Assurances to functional service quality is having a standardized path estimate of 0.553 across organized and 0.487 across unorganized pharmacies with significant path (p< 0.001). The relation between Reliability to functional service quality is having a standardized path estimate of 0.617-organized and 0.698 across unorganized pharmacies. The path way is significant (p<0.001). The path way from satisfaction to functional service quality is 0.221 across organized and is 0.214 across unorganized pharmacies with a significant path of p< 0.001.(See Table 8)
CONCLUSION
The pharmacist plays a very important role in serving the customers. This study identified the critical factors of pharmacists perceived service quality through EFA. CFA models were developed to determine the reliability, validity and fit for all the dimensions of Pharmacist perceived service quality identified through EFA. PHARMQUAL
measurement model was developed by connecting all the factors and tested with fit indices. A PHARMQUAL scale with three dimensions-Empathy, Assurance and Reliability and nine items for measuring functional service quality was developed. The relationships between the pharmacists perceived service quality and satisfaction was also examined. The hypotheses were tested through the Model. The hypotheses included relationships between the three items - Empathy, Assurance and Reliability and service quality and service quality and satisfaction. All the relationships were found to be significant. The model was also cross validated basing on type of pharmacy and all relationships were found to be significant. The study also came with interesting facts about pharmacies. The ANOVA analysis clearly indicated that there are significant differences between organized and unorganized pharmacies with regard to facilities like temperature, ventilation and construction and in achieving goals like Invoice, cycle time and satisfaction. The analysis revealed that there are more problems in unorganized pharmacies than organized pharmacies. This study provides new insights to measure the quality of service provided by Pharmacists. The research contributes to academic theory by developing the PHARMQUAL model, which identified attributes and dimensions in Pharmacist service quality measurement and their impact on overall Pharmacist perceived service quality and satisfaction. This study will help the researchers to develop new ideas and models where little research has been done in this area. The dimensions derived out of this research will contribute to a greater understanding at the generic level of the role played by these constructs in measuring Pharmacist perceived service quality. This study will be helpful to the pharmaceutical manufacturers to improve the performance of the pharmaceutical supply chain. The PHARMQUAL scale will help in understanding the type of relationship i.e existing between manufacturers, doctors and pharmacists. The customers will able to evaluate the role of the pharmacists and the pharmacy practice through the dimensions identified in the scale. This study also highlights the role of organized and unorganized pharmacies.
www.pharmascholars.com
259
Table1-Exploratory Factor Analysis ResultsConstructs Items Factor
loadings
Eigen values
Cumulative Variance Factor1 Ensuring problems identified with individual prescriptions
are addressed within appropriate time frames
.768 6.336 30.170
Maintaining relationships with other health care
Professionals, national professional associations and patients
.684
Participating in health promotion campaigns to raise awareness of health issues and disease prevention
.680
ensuring safe and proper disposal of drugs and non-prescription medications
.669
Factor2 Professional assessing of promotional materials for medicines and other products associated with health
.731 1.776 38.627
Documentation of clarifications .658
Factor3 Interacting with Patients to determine Customer Expectations
.740 1.326 44.939
Providing information to distributors about customers' requirements
.721
Factor4 Supply of antibiotics without a prescription. .787 1.155 50.437 Reporting adverse drug reactions that have caused problem
with patient's health
.690
Use of e-commerce for order placement .644
Factor5 Clarify with the health professional for illegible handwriting, incomplete information, abbreviations before prescription is processed
.810 1.019 55.289
Seeking suggestions from the firm/distributor frequently .640
Note:*-EFA(Factor Loadings based on Principal Component Analysis and Varimax Rotation with KaiserNormalization)
Table2: Model Fit Summary
Goodness of fit indices Value Key goodness of fit indices-level of acceptable fit
GFI .966 ≥ 0.9 is Good fit
AGFI .936 ≥ 0.9 is Good fit
NFI .940 ≥ 0.9 is Good fit
CFI .964 ≥ 0.9 is Good fit
IFI .964 ≥ 0.9 is Good fit
RFI .910 ≥ 0.9 is Good fit
TLI .945 ≥ 0.9 is Good fit
RMSEA .064 ≤ 0.05 = Good fit.Between0.05 to 0.1-Reasonable fit
RMR .045 ≤ 0.05 = Good fit.Between0.05 to 0.1-Reasonable fit
χ2/ Df 2.41 If χ2/df => 0.05 = good fit,< 2 = over fit,≤ 5= Good fit,>5 = adequate fit
www.pharmascholars.com
260
Table3-Results from Confirmatory Factor Analysis
Constructs Items F.L Cronbach
alpha
AVE C.R
Empathy Ensuring problems are addressed .826 .763 0.53 0.82
Maintaining relationships .668
Participating in health promotion campaigns .691
ensuring safe disposal of drugs .713
Assurance Supply of antibiotics without a prescription .672 .692 0.506 0.89
Reporting adverse drug reactions .843
Use of e-commerce .596
Reliability Clarify with the health professional .580 .623 0.571 0.87 Seeking suggestions from the firm/distributor .897
Note: F.L-Factor Loadings, A.V.E-Average Variance Extracted, C.R-Construct Reliability
Table-3.1 AVE and Squared Inter-Construct (covariance) Correlations (SIC) for Discriminant validity analysis
Empathy Assurance Reliability
Empathy 0.527
Assurance 0.14 0.507
Reliability 0.03 0.027 0.503
Note:AVE in the diagonal and squared correlations off-diagonal
Table4: Model validity statistics
Goodness of fit indices Value
GFI .938
AGFI .904
NFI .885
CFI .919
IFI .919
RFI .853
TLI .896
RMSEA .077
χ2/ Df 3.08
Table 5-Results of Hypothesis testing
Construct Relationship Standardised
Regression Weight
Significance Testing of Hypothesis
H1 – Empathy have a significant effect on Pharmacist perceived service quality
0.751 0.00 Accepted
H2 – Assurance have a significant effect on Pharmacist perceived service quality
0.553 0.00 Accepted
H3 –Reliability have a significant effect on Pharmacist perceived service quality
0.617 0.00 Accepted
H4– Pharmacist perceived service quality has a significant effect on customer satisfaction
0.221 0.00 Accepted
www.pharmascholars.com
261
Table 6 Facilities in organized vs unorganized Pharmacies
Facilities Sum of Squares Mean Square F Sig.
Between Within Between Within
Ventilation 9.946 262.571 9.946 .755 13.182 .000
Stock Labeling 1.383 248.206 1.383 .713 1.939 .165
Temperature Control 9.283 270.114 9.283 .776 11.960 .001
Segregation Of Different Materials .071 201.589 .071 .579 .123 .726
Floor Construction (For Minimizing Dust) 5.786 218.903 5.786 .629 9.198 .003
Ambience .000 277.154 .000 .796 .000 1.000
Location Of Stock .231 234.309 .231 .673 .344 .558
Storing Products According To Standards .011 186.286 .011 .535 .021 .884
Table 7-Goals in organized vs unorganized Pharmacies
Goals Sum of Squares Mean Square F Sig.
Between Within Between Within
Damage Free Receipt .026 202.171 .026 .581 044 .833
Invoice Accuracy 32.103 232.994 32.103 .670 47.949 .000
Order Cycle Time. 6.311 257.406 6.311 .740 8.533 .004
Order Completeness 2.746 316.469 2.746 .909 3.019 .083
Speed Of Response To Enquiries
1.931 253.486 1.931 .728
2.652 .104
Customer Satisfaction 2.571 209.383 209.383 .602 4.274 .039
Quality Service .183 196.171 .183 .564 .324 .569
Table-8 Results of Hypothesis Testing through PHARM QUAL Structural Model
Hypothesis Relationship Standardized Path Estimate
Organized Unorganized
H1 Empathy-Service quality .751 .657
H2 Assurance - Service quality .553 .487
H3 Reliability- Service quality .617 .698
www.pharmascholars.com
262
Annexure: Questionnaire
1. Please indicate the extent to which you agree or disagree with the following statements by ticking the appropriate one. (SA-Strongly Agree, A-Agree, N-Neither Agree nor Disagree, D-Disagree, SD-Strongly Disagree)
2. Ensure that patients have access to all medicines
3. Analyze patient profiles/ prescription records to identify areas of drug diversion or misuse
www.pharmascholars.com
263
5. Documentation of clarifications6. Ensure safety, accuracy and quality of supplied products 7. Use of e-commerce for order placement
8. Reporting adverse drug reactions that have caused a problem with a patient's health 9. Supply of antibiotics without a prescription.
10. Regular interaction with Doctors to understand Problems. 11. Interacting with Patients to determine Customer Expectations. 12. Seeking suggestions from the firm/distributor frequently
13. Receiving information from distributors in advance of the changing market requirements 14. Providing information to distributors about customers' requirements
15. Advising to Patients and supplying medicines or other treatment for the symptoms of ailments that can properly be self-treated
16. Establishing arrangements with other health professional communities for health promotion activities 17. Professional assessing of promotional materials for medicines and other products associated with health 18. Disseminating information about medicines and other aspects of healthcare.
19. Collaborating relationships with: other health care Professionals, national professional associations and patients
20. Participating in health promotion campaigns to raise awareness of health issues and disease prevention 21. Ensuring problems identified with individual prescriptions are addressed within appropriate time frames. 22. Ensuring safe and proper disposal of drugs and non-prescription medications
23.
Regular interaction with company to give your suggestionsNote: the questionnaire was prepared taking these reports as the basis – (“The role of the pharmacist in the healthcare system. Report of a WHO consultative group, New Delhi, India,
13-16 December 1988 and Report of a WHO Meeting, Tokyo, Japan,31 August-3 September 1993.Geneva,WorldHealthOrganization,1994’’ (unpublished document WHO/PHARM/94.569; available on request from Division of Drug Management and Polices, World HealthOrganization, 1211 Geneva 27, Switzerland).
Annexure 2- City Profiles
Hyderabad is the capital of the Indian state of Andhra Pradesh. The city has an area of 650 square kilometers (250 sq million) and a population of 6.8 million, and the metropolitan area contains 7.7 million residents, making it the city. The city was once a global center of the diamond and pearls trade, for which it is known as City of Pearls. Hyderabad International Airport was adjudged the world’s fifth best airport. Hyderabad’s 13 universities and business schools form a major center for higher education and research. The city is home to the Telugu film industry known as Tollywood. Hyderabad emerged as a pharmaceutical and biotechnology hub and is known as India’s pharmaceutical capital and “Genome Valley of India”. It is among the global centers of information technology for which it is known as Cyberabad (Cyber City). The city is home to more than 1300 IT firms, including global conglomerates such as Microsoft (the largest R&D campus outside the US), Google, IBM, Yahoo!, Dell, Facebook, and major Indian firms including Mahindra Satyam, Infosys,and Wipro.
www.pharmascholars.com
264
Rajahmundry is a city and municipal corporation of the Andhra Pradesh state in India. It is situated 400 kilometers (249 mi) east of the state capital, Hyderabad, on the banks of the River Godavari. Known as the Cultural Capital of Andhra Pradesh, Rajahmundry is noted for its versatile Vedic culture and intellect. It is the fourth largest by area and eighth most populous city in Andhra Pradesh. City Population is 343,903 (Census 2011).
REFERENCES
1. Parasuraman,A. Zeithaml,VA and Berry,LL. Journal of Marketing 1985; 49(4) :41-50. 2. Parasuraman,A. Zeithaml,VA and Berry,LL. Journal of Marketing1994;58(1): 111-124.
3. Iacobucci, D., Ostrom, A., & Grayson, K. Journal of consumer psychology 1995; 4(3): 277-303 4. Grönroos, C. European Journal of Marketing 1984;18(4): 36-44.
5. Zeithaml,VA & Bitner,MJ. Services marketing, New York: McGraw Hill: 1996 6. David Holdford, Richard Schulz. Pharmaceutical Research, 1999; 16(9):1344-1351
7. Waleed M. S. Al-Shaqha, Mohamed Zairi. International Journal of Health Care Quality Assurance, 2001;14(7): 282 -301.
8. Janković SM, Maksimović MR, Vusanović A, Kostić IR, Kovacević ZN, Mitrić M. Croat Med J. 2001;42(1):88-91.
9. Skyrius V1, Radziūnas R, Barsteigiene Z, Baranauskas A, Grincevicius J. Medicina (Kaunas). 2003;39(2):143-7
10. Daisy Volmer, KaidiVendla, AndreVetka, J Simon Bell, David Hamilton. The Annals of Pharmacotheraphy . 2008;42(7):1104-11. doi: 10.1345/aph.1K644. Epub 2008 Jun 24.
11. Basak SC, Van Mil JW, Sathyanarayana D. Pharm World Sci. 2009; 31(6):612-8. doi: 10.1007/s11096-009-9307-y. Epub 2009 Jun 25.
12. David P. Nau , Journal of American Pharmacists Association (2003). 2009 Mar- Apr;49(2):154-63. doi: 10.1331/JAPhA.2009.09019.
13. Barnett MJ, Frank J, Wehring H, Newland B, VonMuenster S, Kumbera P, Halterman T, Perry PJ, Journal of managed care pharmacy, 2009;15(1):18-31.
14. Felicity Smith. Pharm World Sci,2009; 31:351–361.
15. Houle SK, Grindrod KA, Chatterley T, Tsuyuki RT, Canadian pharmacist journal, 2014;147(4):209-32. doi: 10.1177/1715163514536678
16. Joseph F Hair, Ronald L Tatham, Rolph E Anderson, William Black. Multivariate Data Analysis. 6th ed. Pearson Prentice Hall, India: 2006
17. Field, A. Discovering Statistics using SPSS. 2nd ed. London: Sage Publications:2005 18. Hu, L. and Bentler, P.M. Structural Equation Modeling, 1999; 6(1): 1-55.
19. Nunnally, J.C. Psychometric theory,2nd ed., Mc-grawHill,NewYork,NY.1978
20. Parasuraman, A., Zeithaml, V. A. & Berry, L. L. Journal of Retailing, 1988; 64(1):12–40. 21. Fornell, C., &Larcker, D. F. Journal of Marketing Research, 1981;18(1):39-50.
22. Looy, B.V., Gemmel, P. and Dierdonck, R.V. Services Management: an integrated approach, 2nd ed, Prentice Hall, Essex: 2003
23. Carman, James M. Journal of Retailing, 1990;66 (1):33-55.
24. Cronin, J. J. Jr., & Taylor, S. A. Journal of Marketing, 1992; 56(3):55-68.
25. Bolton, R. N., & Drew, J. H. Journal of Consumer Research, 1991; 17(4): 375-385.
26. Hu, L. T., &Bentler, P. M. Structural equation modeling: Concepts, issues, and applications,1995: 76–99