Model for Optimization of Speech Recognition
and Performance Analysis
1
Dr .Kadam Vipulsangram K,
2Zine Jyoti P
1,2Dept of Electronics Engg., P.E.S College of Engg., Nagsenvan, Dr. Babasaheb Ambedker Marathwada
University, Aurangabad, MS, India
Abstract
Our research work explore the possibility of the optimization of
speech recognition tool. By introduction of BP Digital filter at
the input section of LPC section from which we receive slight enhancement in the Mainlobe Width from 1.4025 dB to 1.5016 dB with Sidelobe Attenuation as 1.5 dB. This implies the rise & optimization of 7.06 % power of desired speech signals. Then we have tried for LPC Tuning (varying the parameters of emphasis
& de-emphasis digital Filter) For the numerator coefficients as 1, .9999 for emphasis & 1.9000 for de-emphasis filter we observe
that there is again increase in the Mainlobe Width as 1.7269 dB. This implies the rise & optimization of 23.13 % power of desired
speech signals.Finaly we varying the order of the filter in this we have design the 40 order filter which gives the mainlobe width as
2 dB which gives the more enhancement the Width of Mainlobe. This implies the rise & optimization of 42.60 % power of desired speech signals.
Keywords
LPC, Mainlobe, MFCC, OTSR
1.1. Methodology
The work is focused on designing of Optimization Tool for
Speech Recognition (OTSR) by applying some modifications in the basic model of LPC & with the addition of DSP filters , further to implement on a DSP hardware which will give the better performance in noisy environment with high efficiency for
Digital Transmission.
1.2. Contribution of this Model
1.2.1. Simulink Model
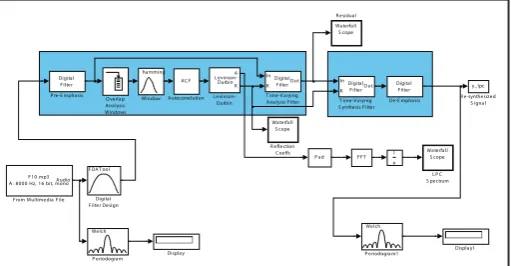
The block diagram below shows the system we implement Figure 1.1shows block diagram of methodology used to design
of OTSR. Digital Filter Pre-Emphasis Overlap Analysis Window, Autocorrelation, Levinson -Durbin Time Varying Analyzing Filter Time Varying Synthesis Filter De-Emphasis Digital Filter LPC OUT Re-Synthesized Signal Reflection Coefficients Digital Filter Imported speech samples
from this PC
P ad hamming Window Digital Filter K In Out
T ime-V arying S ynthesis Filter Digital
Filter K In
Out
T ime-V arying Analysis Filter Waterfall S cope R esidual Waterfall S cope R eflection Coeffs y_lpc R e-synthesized S ignal Digital Filter P re-E mphasis
Welch P eriodogram1 Welch P eriodogram Overlap Analysis Windows 1 u L evinson-DurbinA
K L evinson-Durbin
Waterfall S cope
L P C S pectrum F10.mp3
A: 8000 Hz, 16 bit, monoAudio
From Multimedia File
FFT Display1 Display FDAT ool Digital Filter Design Digital Filter De-E mphasis ACF Autocorrelation
Fig. 1.2: The block diagram shows the system implement using software
Here you implement a speech compression technique known as Linear Prediction Coding (LPC) using DSP System Toolbox™ functionality available at the MATLAB® command line.
1.3. Comparison Results & Performance Analysis
Following are the three main contribution results of our system
1. Introduction of BP Digital Filter at the Input Section
Here we have introduce the Band Pass digital filter with the sampling frequency of 20 KHz, lower cutoff as 60 Hz,10 order
& higher cutoff as 8 KHz. From the table no.1.5 which shows the average of width considering the 80 speech samples of male
& female students, in this we have receive slight enhancement in
the Mainlobe Width (-3dB) from 1.2723 to 1.3674 with Sidelobe Attenuation as 1.5 dB. This implies the rise & optimization of 7 % power of desired speech signals as per the mainlobe is concern. Also from table no.1.6 which shows the average signal to noise ratio considering 80 speechsample signals of male &
female students, in this we achieve the enhancement in signal to
noise ratio from 0.0024 dB to 2.1123 dB.This implies the rise & optimization of 91 % power of desired speech signals as per the signal to noise is concern.
2. LPC Tuning (Varying the Parameters of Emphasis & De-Emphasis Digital Filter)
For the numerator coefficients as 1, .9999 for emphasis & 1.9000 for de-emphasis filter From the table no.1.5 which shows the
average of width considering the 80 speech samples of male &
female students, in this we have receive slight enhancement in the
Mainlobe Width (-3dB) from 1.3674 to 1.5926. This implies the rise & optimization of 15 % power of desired speech signals as per the mainlobe is concern. Also from table no.1.6 which shows the average signal to noise ratio considering 80 speechsample signals
of male & female students, in this we achieve the enhancement
C. Varying the Order of the Filter
In this we have design the 40 order filter.From the table no.4.5 which shows the average of width considering the 80 speech samples of male & female students, in this we have receive slight enhancement in the Mainlobe Width (-3dB) from 1.5926 to 1.6641. This
implies the rise & optimization of 35 % power of desired speech signals as per the mainlobe is concern. Also from table no.1.6
which shows the average signal to noise ratio considering 80 speechsample signals of male & female students, in this we achieve
the enhancement in signal to noise ratio from 2.3017 dB to 3.4898 dB.This implies the rise & optimization of 98 % power of desired speech signals as per the signal to noise is concern.
Following tables shows the comparison of the result achieved with the available model in terms of mainlobe width (-3dB) & Signal to Noise ratio in dB.
Table 1.1: Comparison of Mainlobe width (-3dB) for male samples
Samples Mainlobe width (-3dB)
Male MFCC LPC Contribution-1 Contribution-2 Contribution-3
M1 0.4155 1.4025 1.5016 1.8462 1.9999 M2 0.5231 1.6531 1.6543 1.7257 1.6924 M3 0.7121 1.9229 1.8485 1.9999 1.6717 M4 0.6521 1.7935 1.7949 1.7908 1.6730 M5 0.4156 1.4027 1.5748 1.8948 1.7256 M6 0.0001 0.0103 0.0103 1.7859 1.9999 M7 0.3310 1.2395 1.5155 1.6546 1.7635 M8 0.0006 0.0005 0.0005 1.7598 1.7628 M9 0.4181 1.6531 1.7903 1.7906 1.7114
Table 1.2: Comparison of Mainlobe Width (-3dB) for Female Samples
Samples Mainlobe width (-3dB)
Male MFCC LPC Contribution-1 Contribution-2 Contribution-3
F1 0.0002 0.0006 0.0006 1.7584 1.9999 F2 0.3110 1.5154 1.6532 1.6534 1.6602 F3 0.0002 0.0005 0.0005 1.4634 1.9999 F4 0.4010 1.6778 1.7563 1.6561 1.7330 F5 0.4110 1.6529 1.8908 1.7905 1.7133 F6 0.0002 0.0006 0.0006 1.6047 1.7324 F7 0.0002 0.0006 0.0006 1.8298 1.7267 F8 0.0110 0.5327 1.1214 1.5942 1.6232 F9 0.4189 1.6533 1.7350 1.6572 1.6685
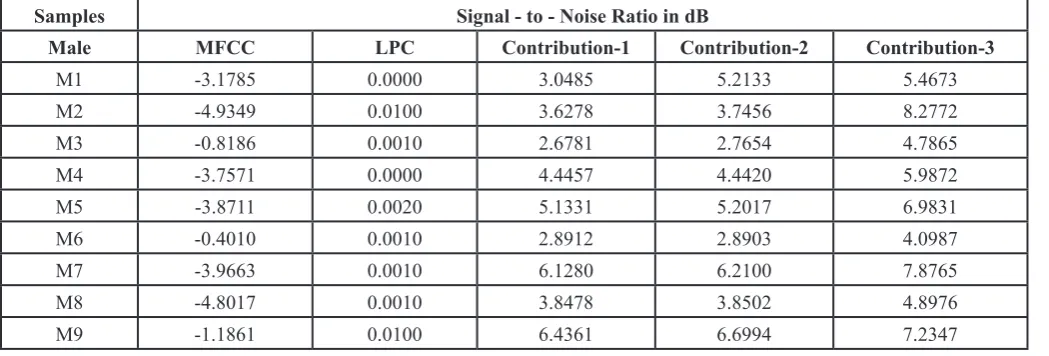
Table 1.3: Comparison of Signal to Noise Ratio in dB for Male Samples
Samples Signal - to - Noise Ratio in dB
Male MFCC LPC Contribution-1 Contribution-2 Contribution-3
Table 1.4: Comparison of Signal to Noise Ratio in dB for Female Samples
Samples Signal - to - Noise Ratio in dB
Male MFCC LPC Contribution-1 Contribution-2 Contribution-3
F1 -0.4488 0.0000 1.2983 1.3092 2.8732 F2 -0.5502 0.0000 2.8631 2.9834 3.9821 F3 -0.4628 0.0010 2.1020 2.1923 3.9823 F4 -3.8711 0.0001 3.4297 3.5423 3.6681 F5 -0.4493 0.0001 3.9012 3.9834 4.9237 F6 -1.6171 0.0010 2.7634 2.8734 3.8721 F7 -1.7907 0.0001 3.9619 3.9926 4.7325 F8 -0.5012 0.0011 1.2398 1.2399 2.9831 F9 -3.0016 0.0010 1.1674 5.6869 6.5421
Table 1.5: Average of Mainlobe Width (-3dB) of Above Samples
Average of Mainlobe width(-3dB) of above samples
MFCC LPC Contribution-1 Contribution-2 Contribution-3
0.3987 1.2723 1.3674 1.5926 1.6641
Table 1.6: Average of Signal-to-Noise Ratio in dB of Above Samples
Average Signal - to - Noise Ratio in dB
MFCC LPC Contribution-1 Contribution-2 Contribution-3
-2.0574 0.0024 2.1123 2.3017 3.4898
Above table shows the comparison results achieved with available model
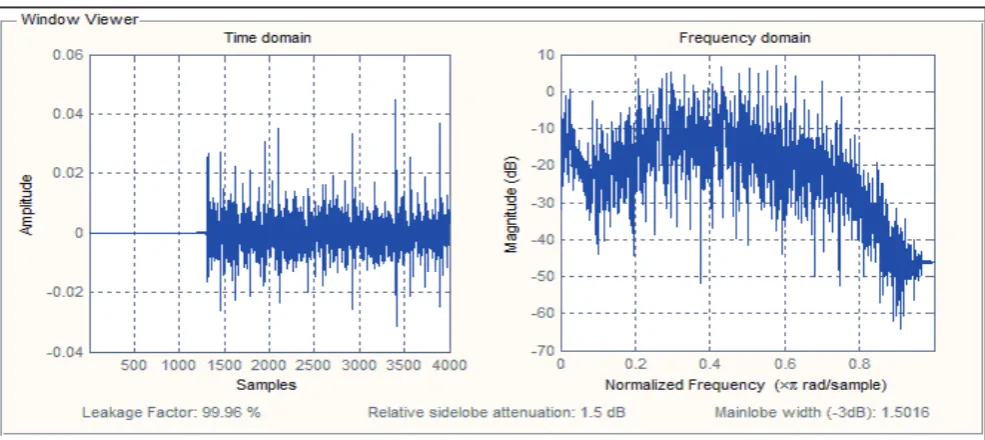
Following figure gives the performance analysis of available MFCC system using software.
Following figure gives the performance analysis of available LPC system using software.
Fig. 1.4: Result of Available Model Using LPC
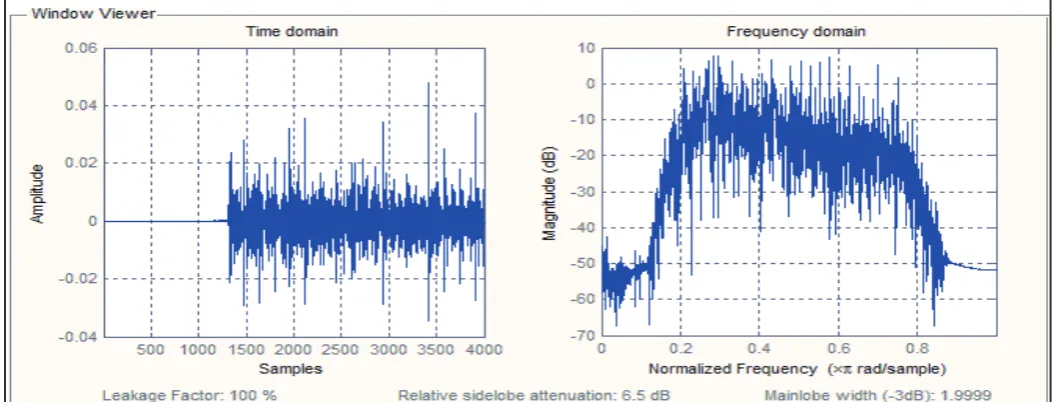
Following figures shows the performance of our contribution.
Fig. 1.5: Contribution-1: Result of Model with introduction of Digital filter at input section.
Fig. 1.7: Contribution-3: Result of Model with varying the order of Digital Filter.
2.1. Performance Analysis of Optimization Tool for Speech Recognition using LPC & Matlab with Simulink environment:
In this we have tried to give the analysis using LPC Technic with Matlab & Simulink environment. We have received the following results as shown in following system block diagrams& output waveforms.
Fig. 2.1: LPC Spectrum using Matlab & Simulink
Fig. 2.3: Residual using Matlab & Simulink
Fig. 2.4: Signal & LPC Spectrum using Matlab & Simulink
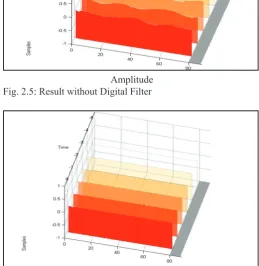
2.2. Reduction of Noise
Following fig shows the spectrum of the output without & with
Amplitude
Fig. 2.5: Result without Digital Filter
Fig. 2.6: Result with Digital Filter
3. Concluding Remarks
We have seen here the implementation of system using software. The implementation used the DSP System Toolbox functionality available at the MATLAB command line. We have compare the achieved result with the existing models MFCC & LPC. From the comparison table we have achieved the rise & optimization of 7 % power considering the mainlobe & 91% power considering
signal to noise ratioof desired speech signals in contribution 1,rise
& optimization of 15 % power considering mainlobe & 95% power considering signal to noise ratioof desired speech signals
in contribution 2, rise & optimization of 35 % power considering
mainlobe & 98% power considering signal to noise ratioof desired speech signals in contribution 3. Also we have compare the result considering the 80 samples of male & female.
IV. Conclusion
We develop our OTSR system which will be operate in noise
environment because human beings are able to recognize speech amazingly well in high levels of background noise. On the other
hand, the performance of Automatic Speech Recognition (ASR)
systems degrades dramatically with increasing noise. Part of the reason for this difference lies in the fact that the auditory system incorporates several features that make it more robust to noise. Finally we conclude with the following
points-We have implemented both software as well as hardware 1.
model for our OTSR & we achieve the optimization of speech
recognition system.
By using Matlab & Simulink we implement the Software 2.
Model whereas the hardware Model is implemented using
Matlab, Simulink, and Code Composer Studio & Hardware
TMS3206711/6713 from Texas Instruments. In both implementations we have achieved the same result which
reflects the stability of our system.
Introduction of BP Digital filter at the input section
3.
Here we have introduce the Band Pass digital filter with the sampling frequency of 20 KHz, lower cutoff as 60 Hz,10
order & higher cutoff as 8 KHz. From the table no.4.5 which shows the average of width considering the 80 speech samples
of male & female students, in this we have receive slight
enhancement in the Mainlobe Width (-3dB) from 1.2723 to 1.3674 with Sidelobe Attenuation as 1.5 dB. This implies the rise & optimization of 7 % power of desired speech signals as per the mainlobe is concern. Also from table no.4.6 which shows the average signal to noise ratio considering 80 speech
sample signals of male & female students, in this we achieve
the enhancement in signal to noise ratio from 0.0024 dB to 2.1123 dB. This implies the rise & optimization of 91 % power of desired speech signals as per the signal to noise is concern.
LPC Tuning (varying the parameters of emphasis & de-4.
emphasis digital Filter)
For the numerator coefficients as 1, .9999 for emphasis & 1.9000 for de-emphasis filter From the table no.4.5 which
shows the average of width considering the 80 speech samples
of male & female students, in this we have receive slight
enhancement in the Mainlobe Width (-3dB) from 1.3674 to 1.5926. This implies the rise & optimization of 15 % power of desired speech signals as per the mainlobe is concern. Also from table no.4.6 which shows the average signal to noise ratio considering 80 speech sample signals of male &
female students, in this we achieve the enhancement in signal
to noise ratio from 2.1123 dB to 2.3017 dB.This implies the rise & optimization of 95 % power of desired speech signals as per the signal to noise is concern.
Varying the order of the filter
5.
In this we have design the 40 order filter. From the table
no.4.5 which shows the average of width considering the
80 speech samples of male & female students, in this we
have receive slight enhancement in the Mainlobe Width (-3dB) from 1.5926 to 1.6641. This implies the rise & optimization of 35 % power of desired speech signals as per the mainlobe is concern. Also from table no.4.6 which shows the average signal to noise ratio considering 80 speech
sample signals of male & female students, in this we achieve
the enhancement in signal to noise ratio from 2.3017 dB to 3.4898 dB.This implies the rise & optimization of 98 % power of desired speech signals as per the signal to noise is concern.
Introduction of BP Digital filter at the input section.
V. Directions for Future work
Based on the work presented in this thesis the directions for future research work couldbe –
The current system can be improved which will accept input both audio as well as video signals. This can be achieved by using advance processors from Texas Instrument considering LPC section also.
Work can be carried out on real time images, Video Signal, Audio
Signals obtained from the satellite.
References
[1] Ahmed, M.S. Dept. of Syst. Eng., King Fahd Univ. of Pet. & Miner., Dhahran,“Comparison of noisy speech enhancement algorithms in terms of LPC perturbation”. Acoustics, Speech and Signal Processing, IEEE Transactions on Date of Publication: Jan 1989, Vol. 37, Issue 1, pp. 121 – 125. [2] Ying Cui; Takaya,“Recognition of Phonemes in a Continuous
Speech Stream By Means of PARCOR Parameter InLPCVocoder”, Electrical and Computer Engineering, 2007. CCECE 2007. Canadian Conference on Digital Object Identifier:10.1109/CCECE.2007.402 Publication Year: 2007,
pp. 1606 – 1609.
[3] McLaughlin. M.; Linder, D. Carney. S,“Design and Test of a Spectrally Efficient Land Mobile Communications System Using LPC”. Selected Areas in Communications, and IEEE Journal on Vol. 2, Issue 4. Digital Object Identifier:10.1109/ JSAC.1984.1146086 Publication Year: 1984, pp. 611 –
620.
[4] Keshavarz, A.; Mosayyebpour, S.; Biguesh, M.; Gulliver, T.A.; Esmaeili M,“Speech-Model Based Accurate Blind Reverberation Time Estimation Using an LPC Filter”, Audio, Speech, and Language Processing, IEEE Transactions on Vol. 20, Issue 6 Digital Object Identifier: 10.1109/ TASL.2012.2191283 Publication Year: 2012 , pp. 1884
–1893.
[5] Bhattacharya, S.; Singh, S.K.; Abhinav, T,“Performance
evaluation of LPC and cepstral speech coder in simulation and
inreal-time”, Recent Advances in Information Technology (RAIT), 2012 1st International Conference on Digital Object Identifier:10.1109/RAIT.2012.6194531 Publication Year: 2012, pp. 826 - 831
[6] Fliege, N.J.,“Mulitrate Digital Signal Processing”, (John Wiley and Sons, 1994). pp. 120-143.
[7] Mitra, S.K.,“Digital Signal Processing”, (McGraw-Hill,
1998). pp. 234-245.