A Comparative Study on DNA Microarray Gene Expression
Data Having Missing Value Estimation Using
KNN Impute and LLS Impute
1
Prasannajit Dash,
2Dr. Maya Nayak
1Dept. of Information Technology, Orissa Engineering College, Bhubaneswar, India 2Dept. of Computer Science and Engg., Orissa Engineering College, Bhubaneswar, India
Abstract
Gene expression data very often contain missing values. In regards to this, effective missing value estimation methods are needful though many algorithms for gene expression data analysis require a complete matrix of gene array values. In this paper, local least square imputation and weighted k-nearest neighbors(KNN) imputation are proposed to estimate missing values in the gene expression data. The proposed local least squares(LLS) imputation method gives a target gene which has missing values through a linear combination of very similar genes. The similar genes are selected by k-nearest neighbors or k coherent genes that have bigger
values of Pearson Correlation coefficients. In our experiments, the
proposed KNN imputation and LLS imputation method applied in e-coli bacteria dataset producing the percentages of missing values in the data.
Keywords
Gene Expression, KNNImpute, LLSImpute, Pearson Correlation
Coefficients, DNA microarray, L2-norm
I. Introduction
Microarray data analysis applied for a number of studies including
cancer classification through class discovery and prediction, identification of genes relevant to a certain diagnosis or therapy
and cancer prognosis. Gene expression data sets very often contain
missing values due to image corruption, insufficient resolution,
dust or scratches on the slides or experimental error during the
laboratory process. As it has been known that the process is time
consuming and costly to repeat the experiment, many algorithms have been developed to recover the missing values. There are many approaches for estimating the missing values. Recently, for the missing value estimation, the weighted k-nearest neighbors imputation(KNNImpute) and the local least squares imputation(LLSImpute) have been introduced. It has been shown that KNNImpute performs better on time-series data or noisy time series data while the weighted k-nearest neighbor imputation works well on time series data with low noise levels. Overall, the weighted k-nearest neighbor based imputation provides a more robust method for missing value estimation.
For gene expression use, G ϵ Rm×n to denote a gene expression
data matrix with m genes and n experiments assuming m >> n. In the matrix G, a row giT ϵ R1×n represents expressions of the i-th
gene in n expressions :
(1)
The missing value of the i-th gene in the l-th location is denoted
as α, i.e.
(2)
The KNNImpute [1-2] method( Troyanskaya et al., 2001) finds
k (k < m) other genes with expressions quite similar to g1 having
values in their first positions not missing. The missing value of
g1 is estimated by the weighted average of values in their first
positions of these k closest genes. Concerned to the weighted average, the contribution of each gene is weighted by the similarity of its expression to that of g1. In this paper, it is introduced as the novel local least squares based imputation methods, where a target gene that gets the missing values which is represented as a linear combination of similar genes. Instead of using all available genes in the data, only similar genes based on a similarity measure are used. The local least squares imputation(LLSImpute)[3] is mostly referred since both the L2- norm and Pearson Correlation
Coefficients are investigated for comparison.
II. Methods
There are two steps in the local least squares imputation. Very first
step is meant for selecting k genes by the L2-norm or by Pearson
Correlation Coefficients [10]. The second step is regression and
estimation.
III. Selection of Genes
In order to gain a missing value α in the first location g1(1) in G
ϵ Rm×n, the k-nearest neighbor gene vectors for g
1 are found for
LLS impute based on the L2-norm.
(3)
The LLS impute [4-5] based on Pearson Correlation Coefficient
[10] takes advantage of the coherent genes. When it has been
found that there seems to be a missing value in the first location
of g1, the Pearson Correlation Coefficient, rij between two vectors g1’ = (g12, ……,g1n)T and g
j’= (g12,…,gjn)T is defined as
(4)
where gj- is the average of values gj’ and σj is the standard deviation of these values. The said components of g that is in conjunction with the missing values are not considered in computing the
coefficients.
The absolute values of the Pearson Correlation Coefficients are
used but opposite signed components of the genes,
i.e. r≈ -1.0 (5)
are selected based on the Pearson Correlation Coefficients. Firstly, all Pearson Correlation Coefficients between g1 and G(1,1) = g1(1)
= α, the k genes with the largest Pearson Correlation Coefficients
in magnitude,
(6)
are found for LLSimpute/PC.
IV. Local Least Square Imputation
In regards to the k-neighboring gene [6-8]vectors the matrix A ϵ Rk×(n-1) and two vectors b ϵ Rk×1 and w ϵ R(n-1)×1 are going to
be formed. So the matrix A is having k rows that consist of the
k-nearest neighbor genes gsiT ϵ R1×n , 1<= i <=k with the first value
deleted, the elements of vector b consists of the first elements of
the k vectors gsiT and the elements of the vector w are the (n-1)
elements of the gene vector g1 whose missing first item is deleted. After the matrix A having the corresponding vectors b and w are
formed, the local least squares solution is formulated as
(7)
Then the missing value α is calculated as a linear combination of first values of genes i.e.
(8)
where (AT)+ is the pseudoinverse of AT.
As per the following example, let us assume that the target gene
g1 has a missing value in the first location as if the missing value
is to be calculated by the k number of similar genes, the vectors
w, b and the gene matrix A are constructed as
(9)
where α is said to be the missing value and gsiT, ..,g
skT are the
required genes which are very similar to the first gene i.e. g1T.
In regards to the starting from the second component to the last component of the said gene vector populated with the k-nearest neighborhood genes i.e. aiT, 1<=i<=k, construct the i-th row vector
of the microarray gene matrix A. Henceforth, the vector w in
regards to the target gene g1T can be shown in a linear combination
i.e.
(10) where xi are the correlation coefficients of linear combination. Henceforth, the missing value α in g1T can be formulated by the
following function:
(11) Consider a case in which these are more than one missing values in a gene vector g1.
The total of q missing values in any location of the first gene g1,
the k – nearest neighbor gene vector for first g1,
(12)
So based on these k-neighborhood gene vectors, the formulated
matrix A ϵ Rk×(n-q), a matrix B ϵ Rk×q and a vector w ϵ R(n-1)×1 are
formed. After the matrices A and B and a vector w are created the
local least squares are calculated as
(13)
Then the vector u = (α1,α2, …, αq)T of q missing values can be
formulated as given below :
(14)
where (AT)+ is the pseudoinverse of AT.
V. KNN Imputation Algorithm
The KNN-based[9] method chooses genes having expression
profiles quite similar to the gene of interest to impute missing values. If for consider A that keeps one missing value in first experiment, this method could find k other genes which possess a value present in experiment one, with expression mostly close to A
in experiments 2-N(where N is the total number of experiments).
A weighted average of values present in experiment one from
the k-closest genes is used as an estimate for the missing value
in gene A.
After examining a number of metrics for gene similarity, may be
Pearson Correlation, Euclidean distance, Variance Minimization, it
has been found that Euclidean distance is the sufficiently accurate
norm in regards that Euclidean distance measure is often sensitive to outliers, which could be present in microarray data.
In regards to estimate the missing value yih in the i-th gene expression vector yi by KNNimpute (Troyanskaya et al, 2001)
first select k number of genes whose expression vectors are similar
to yi. Next, the missing value is estimated as the average of the so called the corresponding entries in the selected k expression vectors.
The similarity measure si(yi) between two expression vectors yi and yj is defined by the reciprocal of the Euclidean distance calculated
over observed components in yi. There are other missing values in yi and yj, it is defined as follows:
(15)
Where oi is the h-th component of yi as observed in the above measurement.
The missing entry value yih is estimated as average weighted by the similarity measure
(16) where Ikih is the index set of k-nearest neighbor genes of the i-th gene, missing the j-th gene which is excluded from Ikih.
VI. Results and Discussions
Performance of the KNN – based imputation method was assessed over different sets of data i.e. both types of data and percentage of data missing and over different values of k. The method is very accurate, with the estimated values showing only 6 – 26% average deviation from true values, depending on the type of data and fraction of values missing. Notably, this KNN impute method is successful in accurate estimation of missing values for genes that are expressed in small clusters.
its number of instances, number of attributes, classes(number of possible values of the output variable and the percentage of values with missing values and instances with missing values. The KEEL(Knowledge Extraction based on Evolutionary Computing) format of each of ten datasets while it is possible to obtain the dataset from KEEL Microarray gene dataset Repository.
The URL of KEEL Dataset repository is as below: http://keel. es/datasets.php
Next, it provides a set of classification dataset(in current scenario i.e. Ecoli+MV.) with missing values induced. They are modified version from those that can be found in the standard classification
data sets category of the KEEL dataset repository for microarray genes. The KEEL repository possess a 10% of missing values that have been randomly removed (only training partitions present missing values, test partitions remains unchanged). For each data set of Ecoli + MV, It is shown that its name and its number of attributes (Real/Integer/Nominal Valued), number of instances, classes(number of possible values of the output variable) and the percentage of values with missing values and instances with missing values.
Table 1. Classification Dataset of Ecoli+10+MV
Name #Attrib utes
(R/I/N) #Instances #Classes % MVs(values)
% MVs (instances)
Ecoli+10
+MV 7/(7/0/0) 3336 8 10.00% 48.2%
The above table shows statistics of EColi+MV-1st to 10th training
dataset.
Each of the dataset is having seven attributes, i.e., @MCG Real,
@GVH Real, @LIP Real, @CHG Real, @AAC Real, @ALML Real, @ALM2 Real in ecoli+MV-10-1training dataset where @
attribute site{cp, im, pp, imU, om, omL, imL, imS}, @inputs
Mcg,Gvh, Lip,Chg, Aac, Alml, Alm2 and output site.
Table 2: Minimum and Maximum Data Range
@relation @ Mcg @ Gvh @Lip @Chg @Aac @Alml @Alm2
EColi+
MV+10 [0.0, 0.89] [0.16, 1.0] [0.48, 1.0] [0.5, 1.0] [0.0, 0.88] [0.03, 1.0] [0.0, 0.99] The above table shows the minimum and the maximum values i.e. ranges of seven attributes in EColi+MV+10 training dataset.
Fig. 1: EColi Microarray Gene Expression Data Set
The above figure shows the Ecoli microarray gene expression
dataset of 10% missing values with 48.2% missing value instances where there are 315 genes as row vectors. The total instances are 3336 for seven real attributes with number of classes is eight.
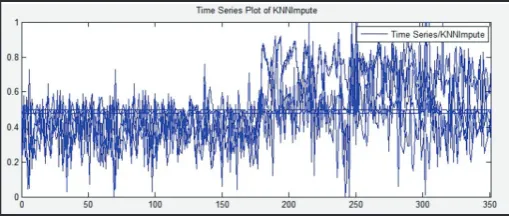
Fig. 2: Time Series Plot of KNN Impute
The above fig. shows time-series plot of KNN imputation method
working on EColi microarray gene dataset.
Fig. 3: Histogram Plot of KNN Impute method
The above figure shows the histogram plotted for KNN imputation
induced target result to EColi microarray gene dataset.
Fig. 4: Autocorrelation Graph of KNNImpute
The above figure shows the autocorrelation graph plotted for KNN
Imputation induced target result to the EColi microarray gene dataset.
Fig. 5: Periodogram of KNNImpute
The above figure shows the Periodogram graph plotted for KNN
Fig. 6: Time Series Plot of LLSImpute Data
The above figure shows the time-series plot of LLS Imputation
method applied on EColi microarray gene expression dataset.
Fig. 7: Histogram Plot of LLSImpute method
The above figure shows the histogram plotted on LLS imputation
induced on resultant set to EColi microarray gene expression dataset.
Fig. 8: Autocorrelation graph of LLSImpute
The above figure shows the autocorrelation graph plotted for LLS
Imputation on resultant set to EColi microarray gene expression dataset.
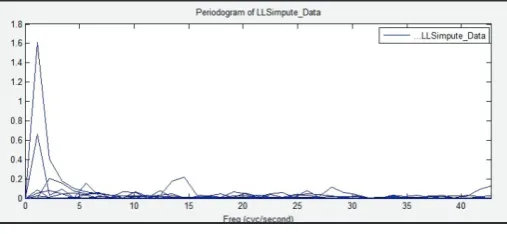
Fig. 9: Periodogram of LLSImpute
The above figure shows the Periodogram graph plotted for LLS
Imputation induced on target resultant set of EColi microarray gene expression data.
VII. Conclusion
We did the development of local least squares imputation and k-nearest neighbor imputation methods successfully for
the missing value estimation of Ecoli DNA microarray gene
expression data. In regards to the genes that are similar to the
target gene with missing values are identified based on Euclidean distance or Pearson Correlation Coefficient, missing values can be
estimated by representing the target gene as a linear combination of related experiments. Even though LLS Imputation showed better performance than KNN impute for all ten datasets tested,
when genes have dominant local similarity structures. However,
our local least squares imputation methods take advantage of the local similarity structures in addition to the optimization process by the least squares, which is one of the most important advance of LLSimpute
References
[1] Alter,O., Brown,P.O. and Botstein, D.,"Singular value
decomposition for genome-wide expression data processing
and modeling", Proc. Natl Acad. Sci. USA, 97, pp. 10101–
10106, 2000.
[2] Alter,O., Brown,P.O., Botstein,D.,"Generalized singular
value decomposition for comparative analysis of
genome-scale expression datasets of two different organisms", Proc. Natl Acad.Sci. USA, 100, pp. 3351–3356, 2003.
[3] Bø,T.H., Dysvik,B., Jonassen,I.,"LSimpute: accurate
estimation of missing values in microarray data with least
squares methods. Nucleic Acids Res., 32, e34, 2004. [4] Cho,J.H., Lee,D., Park, J.H., Lee, I.B.,"New gene selection
method for classification of cancer subtypes considering within class variation", FEBS Lett., 551, 3–7, 2003. [5] Friedland, S., Niknejad, A., Chihara,L.,"A simultaneous
reconstruction of missing data in DNA microarrays", Institute for Mathematics and its Applications Preprint Series, No.
1948, 2003.
[6] Gasch,A.P., Huang, M., Metzner, S., Botstein,D., Elledge, S.J., Brown,P.O.,"Genomic expression responses to DNA damaging agents and the regulatory role of the yeastATRhomolog Mec1p. Mol. Biol. Cell, 12, pp. 2987–
3003, 2001.
[7] Golub, G.H., Van Loan,C.F.,"Matrix Computations", 3rd edn. Johns Hopkins University Press, Baltimore, CA, 1996. [8] Golub, T.R., Slonim, D.K., Tamayo, P., Huard,C., Gaasenbeek,
M.,Mesirov, J.P., Coller, H., Loh, M.L., Downing, J.R., Caligiuri, M.A., Bloomfield, C.D., Lander, E.S.,"Molecular classification of cancer: Class discovery and class prediction by gene expression monitoring", Science, 286, pp. 531–537,
1999
[9] Oba,S., Sato,M., Takemasa,I., Monden, M., Matsubara,
K., Ishii, S.,"A Bayesian missing value estimation method for gene expression profile data", Bioinformatics, 19, pp.
2088–2096, 2003.
[10] Pearson, K.,"Contributions to the mathematical theory of evolution", Phil. Trans. R. Soc. London, 185, pp. 71–110,
Prof.(Dr.) Maya Nayak received her
B.E. degree in Computer Science and Engineering from Bangalore University, Karnataka, India in 1993, the M.E. degree in Computer Science and Engineering from University College of Engineering, Burla, Sambalpur, Odisha, India in 1997,
and the Ph.D.in Computer Science
and Engineering from Biju Pattnaik University of Technology (BPUT), Rourkela, Odisha, India in 2009. She has 20 years of teaching experience in Orissa Engineering College,
Bhubaneswar, Odisha, India. At present she is working as Professor and Head of the Department (Computer Science and Engineering)
in Orissa Engineering College, Bhubaneswar, Odisha, India. She
was also Dean of Academics from 2007 to 2011 Orissa Engineering College, Bhubaneswar. Also she is Additional Principal from 2007 till today. She is also in charge of Library Automation in
Orissa Engineering College, Bhubaneswar from last 8 yrs. She
is also R&D Cell Chief Coordinator in OEC, Bhubaneswar. Her
research interests include digital signal processing, data mining
and soft computing. Currently she is working in field of Neural
Networks.
Prasannajit Dash received his B.E.
degree in Computer Science and Engg. in 1994 from Orissa Engineering College, Utkal University, Bhubaneswar, Odisha, India and the M.Tech.
Degree in Information Technology
from College of Engineering and Technology, Bhubaneswar, Odisha,
India in 2011. He is presently doing Ph.D. in Computer Science from North
Orissa University, Baripada, Odisha,
India. He was a Senior Lecturer with Department of Information Technology in Orissa Engineering College, Bhubaneswar from 2008 to 2012. He is Assistant
Professor in Orissa Engineering College, Bhubaneswar from 2012.
His research interests include Image Processing, Data Mining &
Warehousing, Embedded System and Internet Web Technology.
Currently he is working on Support Vector Machine in field of