Abstract—Maharashtra is one of the worst drought affected states in India, and as a result the agricultural productions has kept low. In the present study Standardized Precipitation Index (SPI) and Normalized Difference Vegetation Index (NDVI) obtained from MODIS data (MOD13Q1) and sunspot number which represents the solar activity has been considered for drought modeling in that part of Krishna Basin which lies in Maharashtra. Two multiple linear regression models for predicting agricultural drought are developed for Kharif season, based on the data for a period of 13 years from 2000 to 2012. In the first model, previous NDVI and SPI values and in the second model Sunspot data along with NDVI and SPI values are used as variables. It was found that the coefficient of determination of the second model has improved over the first model, which suggests the high significance of solar activity in the occurrence of drought. The correlation between NDVI and SPI has been utilized in the study. Highly significant correlations were obtained between current NDVI and SPI of various time lags in the assured rainfall zone and the scarcity Zone. Crop yield model was developed from the predicted NDVI for the major crops and was validated with the actual yield. It was found that the predicted NDVI of both the fortnights of July is highly correlated with the yield of major crops in assured rainfall zone and scarcity zone.
Index Terms—Agricultural drought, crop yield prediction model, MODIS NDVI, sunspot numbers.
I. INTRODUCTION
The back bone of Indian economy is agriculture. Maharashtra being the third largest state in India claims a major share of the country’s agricultural production. More than one-third of the sugar cane production of India is contributed by Maharashtra. But in many parts of Maharashtra, drought has been occurring periodically and with increased severity [1]. The year 2013 witnessed the worst drought in the past 40 years. Due to unexpected crop failure, nearly 4000 farmers committed suicide [2] which counts from 38 suicides in just 3 weeks in a single district. Many of the worst drought affected districts are in the Krishna Basin. In a state where 65% of the population depends on the agricultural sector for their livelihood, the total irrigated area in is only 17.8% of the total cultivated area which is less than half of the national average. This implies that more than 80% of the agriculture in Maharashtra is rain fed. This increases the significance of a model relating NDVI and SPI.
Various drought indices have been developed to monitor drought. A drought index assimilates data on rainfall, snow pack, stream flow and other water-supply indicators into
Manuscript received May 24, 2014; revised July 28, 2014.
The authors are with National Institute of Technology Karnataka, India (e-mail:[email protected], [email protected],
[email protected], [email protected]).
a comprehensible picture. Some of the widely used drought indices include Palmer Drought Severity Index (PDSI), Crop Moisture Index (CMI), Standardized Precipitation Index (SPI), and Surface Water Supply Index (SWSI) and some satellite based drought indices such as Normalized Difference Vegetation Index (NDVI), Vegetation Condition Index (VCI), and Temperature Condition Index (TCI).
Based on these indices many studies have been conducted to monitor and model drought. Some of them being the rainfall anomaly based drought identification [3]. SPI based drought identification has been utilized by [4] to monitor the 1996 drought in the United States of America. Although it is quite a recent index, the SPI was used in Turkey [5], Argentina [6], Canada [7], Spain [8], Korea [9], Hungary [10], China [11] and Europe [12] for real time monitoring or retrospective analysis of droughts. NDVI-rainfall relationship was also used in monitoring drought on a large scale in north east Thailand [13], East Asia [14] and the Central Great Plains of US [15] using NOAA/AVHRR data. Solar activity and drought correlation is underexplored till date and henceforth the current study on drought is based on its correlation with rainfall, vegetation health and solar activity.
Standardized Precipitation Index (SPI) was developed by [16] of the Colorado Climate Centre in 1993. It is the number of standard deviations that the observed value would deviate from the long-term mean, for a normally distributed random variable. Since precipitation is not normally distributed, a transformation is first applied so that the transformed precipitation values follow a normal distribution. The SPI calculation for any location is based on the long-term precipitation record that is fitted to a probability distribution, which is then transformed into a normal distribution so that the mean SPI for the location and desired period is zero. A drought event occurs any time the SPI is continuously negative and reaches intensity of -1.0 or less. The event ends when the SPI becomes positive. Each drought event, therefore, has a duration defined by its beginning and end, and intensity, being the ratio between magnitude and duration of the event.
Normalized Difference Vegetation Index (NDVI) is a good indicator of green biomass, leaf area index and pattern of production [17]. The principle behind this index is that the internal mesophyll structure of healthy green leaves strongly reflects NIR (near infrared) radiation and leaf chlorophyll and other pigments absorb a large proportion of the red VIS (visible red) radiation. This becomes reverse in case of unhealthy or water stressed vegetation. NDVI is calculated by the difference between reflectance in NIR and VIS band of electromagnetic spectrum. NDVI value varies between -1.0 and +1.0. Negative values of NDVI (values approaching -1) correspond to deep water [16]. The typical
B. M. Dodamani, Anoop R., and D. R. Mahajan
range is between about -0.1 (for a not very green area) to 0.6 (for a very green area). NDVI provides an estimate of vegetation health and a means of monitoring changes in vegetation over time.
Sunspots are high magnetic field areas in the sun with comparatively lower temperature with a diameter of about 37000 km and they occur periodically. Many studies revealed that the earth’s climate is significantly related to sunspot activity which is represented by sunspot number. According to the recent researches [18], it is shown that the global temperature would rise as the sunspot number increases. There are more sunspots during the time of increased magnetic activity and as a result sun’s radiant energy is increased and this increases atmospheric temperature. As a result during the period of high sunspot number the probability of occurrence of drought is higher and vice versa. In the present study, Standardised Precipitation Index (SPI) and Normalized Difference Vegetation Index (NDVI) obtained from MODIS data (MOD13Q1) and sunspot number has been considered for drought modelling. Two multiple linear regression models for predicting agricultural drought are developed for Kharif season. Crop yield model was developed from the predicted NDVI for the major crops and was validated with the actual yield.
II. STUDY AREA
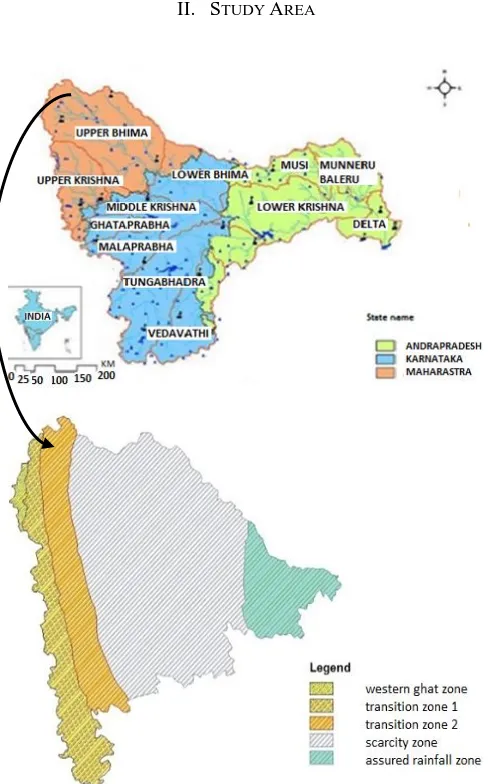
Fig. 1. Study area.
Krishna Basin extends through three states viz, Maharashtra, Karnataka and Andhra Pradesh. For the present study, that part of Krishna basin which lies in Maharashtra is considered. It extends from 15049’ N to 19026’ N latitude and 73020’ E to 76053’ E longitude. The total study area is 69,425 Sq.km. The study area is constituted with a varying topography with the slopes of the Western Ghats in the western parts of the study area and then the mouth of the Deccan plateau towards the east. Mahabaleshwar with an altitude of 1337 m is the top most point in the study area and the Krishna River originates from this point. The area experiences a tropical monsoon type of climate. The presence of Western Ghats blocks the moisture laden winds coming from the Arabian Sea and causes rainfall in the windward side while the major part falls in the rain shadow region of the Western Ghats [19]. The average annual rainfall of the study area is 784 mm and over 90 % of the rainfall occurs during the monsoon season. The average annual temperature is between 250C and 270C.The study area comprises of various soil types such as the black soil, lateritic soil, and red soil along with some patches of alluvium and clayey (montmorilonite) soils.
The entire state of Maharashtra is divided into 9 agro-climatic zones based on the varying soil types, climate and vegetation out of which 5 zones are found in the study area. They are the Western ghat zone, the Transition zone 1, the Transition zone 2, the Scarcity zone and the Assured rainfall zone. The study area and various agro-climatic zones are shown in Fig. 1.
III. METHODOLOGY
The study area and the stream network was delineated using ArcGIS from the Digital Elevation Model (DEM) obtained from the websitehttp://earthexplorer.usgs.gov/. The spatial variation of the average annual rainfall was plotted to check the drought sensitive areas. The assured rainfall zone and scarcity zone was identified to be among the drought sensitive areas due the consistent availability of low rainfall. The rainfall records for a period of 1970 to 2012 of 57 rain gage stations in the study area are used for the calculation of SPI values. The available data was first analysed and the missing data were filled using regression method. The fortnightly rainfall for each station is calculated, with month having two fortnightly rainfall values. The SPI (1, 2, 3, 6 & 9) values were calculated for both fortnights separately for the entire period from 1970 to 2012. From this calculated SPI values, values from 2000 to 2012 was considered for the present study. The growing season of Kharif crops in Maharashtra starts in June and extends up to November. So from the calculated SPI values, the values extending from 2000 to 2012 for the fortnights from June to December was considered. This was done to analyse the variation of meteorological drought in the study area. Then the fortnightly average rainfall for each agro-climatic zones were calculated and corresponding SPI (1, 2, 3, 6 & 9) values were derived to establish zone wise relationship between NDVI and SPI of each zone.
MODIS data provides continuity for time series historical applications. The MODIS NDVI data are computed from atmospherically corrected bi-directional surface reflectance that have been masked for water, clouds, heavy aerosols and cloud shadow [20]. 16 day composite data are used with 250m spatial resolution. The MODIS NDVI data has been obtained for the months from June to December from 2000 to 2012 from the website http://reverb.echo.nasa.gov/.The land use-land cover map was prepared using supervised classification in ERDAS IMAGINE from LANDSAT (L7) image obtained from http://earthexplorer.usgs.gov/and the polygons for the vegetation area were prepared. Then the vegetation area for each agro climatic zone was masked from the MODIS NDVI and the data was extracted using ArcGIS. Thus the MODIS NDVI values corresponding to crop areas for each agro-climatic zones for all the fortnights for each year from 2000 to 2012 was obtained.
Multiple regression model with two variables was built for predicting current NDVI. The variable considered were SPI (1, 2, 3, 6, and 9) of various time lags and NDVI of previous fortnight. The correlation between NDVI and SPI of various time lags were checked using Pearson correlation to fix the independent variable. Since NDVI is an indicator of green biomass and vegetation health, these variables were selected [17]. The vegetation health of current fortnight will be dependent on the rainfall availability and the vegetation health of previous fortnights. Based on this relation a regression model for predicting NDVI was developed. Another multiple regression model with three variables was built by including sunspot number as the third variable. Since the vegetation health of current fortnight will also be dependent on the solar activity of the currents fortnight, sunspot numbers of current fortnight were considered. The daily total sunspot data was obtained from http://www.sidc.be/silso/datafiles for the study period and fortnightly averages for each month in the study period was calculated. (Data credits: WDC-SILSO, Royal Observatory of Belgium, Brussels). Then the predicted NDVI of the better model was used for predicting the yield of major crops in each agro climatic zones and was validated against the actual yield obtained from the website http://www.mahaagri.gov.in/ for a period from 2000 to 2010.
IV. RESULTS AND DISCUSSIONS
A. SPI Values
SPI 3 was considered as it represents the cumulative rainfall of three fortnights and would give a better result for the drought sensitivity. The SPI 3 values obtained for the first fortnight of September was compared for a drought year (2003) and a non-drought year (2004) as peak rainfall is observed during the second fortnight of July and the first fortnight of August. The spatial variation of SPI 3 for the first fortnight of September for a drought year and a non-drought year is shown in Fig. 2(a) and Fig. 2(b) indicate that there was clear difference between the SPI values of both the years. The values remained less than -1 in most of the stations for the drought year and values remained positive indicating wet conditions for all the stations for the
non-drought year. This holds good for all the stations except Palus and Ashti. Hence SPI can be used as a clear indicator for detecting the occurrences of drought in Krishna basin in Maharashtra.
(a) (b)
Fig. 2. SPI 3 for the first fortnight of September for (a) non-drought year 2004 and (b) drought year 2003.
B. NDVI Values
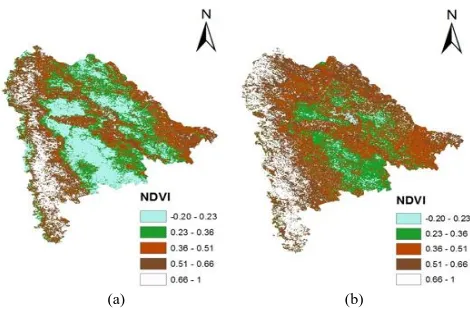
NDVI for the first fortnight of September was compared for both drought year (2003) and non-drought year (2004) as per line with SPI. The NDVI values of non-drought year were more when compared to that of the drought year indicating healthy growth of vegetation during the non-drought year when compared to the non-drought year as shown in Fig. 3(a) and Fig. 3(b). This indicates that the real time NDVI data extracted can be a good indicator of vegetation health and ultimately agricultural drought [17].
(a) (b)
Fig. 3. NDVI for the first fortnight of September for (a) drought year 2003 and (b) non-drought year 2004.
NDVI were compared for all the fortnights for drought years (2001 and 2003) and non-drought years (2004 and 2005) in the study period for all the five agro-climatic zones.
more severe than the 2001 drought, as the NDVI values of 2003 were low as compared to the 2001 values. Hence, NDVI can be used as a successful tool to analyze drought and non-drought conditions in both the assured rainfall zone and in the scarcity zone. This strongly supports the feasibility of a drought model based on NDVI and rainfall in these regions.
Fig. 4. Variation of NDVI with different fortnights in scarcity zone.
Another important observation is that the peak values for NDVI in the western ghat zone and the transition zone is higher when compared to the other zones. This is also due the irrigation done in these zones and due to the availability of higher annual average rainfall when compared to the scarcity zone and the assured rainfall zone. Another reason can be recognized as the presence of more vegetation in the form of tropical forests. This analysis again strengthened the point that scarcity zone and the assured rainfall zones are the critical areas in the study area which are highly prone to agricultural drought.
C. Sunspot Number and Drought Correlation
Sun spot number is an indicator of the solar activity. Sunspots are dark spots in the sun which occur on the sun’s surface with higher magnetic fields and lower temperature. The sunspots number increases which means solar activity is high and solar irradiance would increase and thereby induces more energy to the atmosphere. The global temperature thus increases [21], [22].
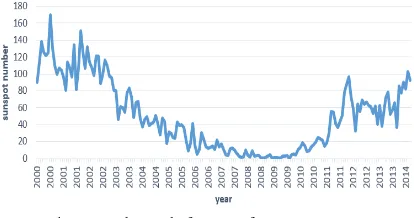
Increased solar acivity is observed during the period of 2000 to 2004 and also from 2011 to 2014 (Fig. 5). As per the drought history, the study area was affected with drought during 2001, 2003 and 2012. Hence Sunspots activity has a proportional trend with the occurance of drought incidents. So the usage of sunspot number as an independent variable in the model is feasible for the study.
Fig. 5. Yearly trend of sunspot from 2000-2012.
Moreover,yearly sunspot data trend and NDVI trend was
not having any direct similarity but when monthly comparisons were performed for sunspots data and the NDVI for all the agroclimatic-zones, significant correlations were observed. The sunspots activity was found comparitively lower during the moths of October, November and December with a general decreasing trend. Correspondingly the NDVI was found higher during these months with a general increasing trend. Also during the months of higher sunspot activity (June, July, August and September), the NDVI values were found to be low. Thus it can be concluded that lower sunspot number corresponds to improved NDVI values. In other words, higher the sunspot number or solar activity, higher is the chance for agricultural drought. An increased solar activity would increase the air temperature and reduces the number of rainy days [21]. The decreasing trend of sunspot number with increaing NDVI values suggest the proportional relationship between solar activity and agricultural drought.
D. NDVI – SPI Correlation
The correlation test between NDVI and SPI of various time scales (1, 2, 3, 6, and 9) has been conducted. SPI 3 and above is expected to have better correlation with NDVI because for the influence of rainfall on the vegetation growth, a minimum of 3 fortnights is required. For the assured rainfall zone, SPI 3 Fig. 6 shows significant correlation till second fortnight of August and from the fist fortnight night of September onwards SPI 6 was found significantly correlated to the NDVI in the study period. Thus it has become evident that for the assured rainfall zone one of the independent variables for the model is SPI 3 till the second fortnight of August and from the first fortnight ofSeptember onwards SPI 6 should be used as the independent variable.
Fig. 6. Correlation between SPI and NDVI for assured rainfall zone.
For the scarcity zone also the same result was obtained. For the transition zones 1 & 2 and the western ghat zones, no significant correlation could be obtained between NDVI and SPI. The reason may be that these regions comes under the command area of the most irrigation projects in upper Krishna basin and are well irrigated areas. Also in western ghat zone the crop cultivation is the least. As a result now it can be concluded that a regression model showing the relationship between NDVI and rainfall cannot be built for the western ghat zone and the transition zones.
E. Correlation between NDVI and SPI of Various Time Lags
been conducted between NDVI and SPI 3 of time lags 1, 2 and 3 to find out highest correlated time lag. Also a correlation test was conducted between NDVI and SPI 6 (Fig. 7) of time lags 1, 2 and 3 for both assured rainfall zone and scarcity zone. Time lag of 1 here represent the value 15 days prior and time lag 2 represents 30 days prior and time lag of 3 represents 45 days prior.
For scarcity zone, it is found that NDVI is highly correlated to SPI 3 of time lag 2 (30 days) till second fortnight of August. From the first fortnight of September onwards SPI 3 with time lag one (15 days) is highly correlated with NDVI. Also SPI 6 of time lag 2 is highly correlated with NDVI up to second fortnight of August and from there on SPI 6 of lag 1 is correlated. Similarly correlation test, reveals that previous NDVI with a time lag of 15 days is having more correlation with the current NDVI.
Fig. 7. Correlation of NDVI with SPI 6 for different time lags.
F. Model for Predicting NDVI
Multiple regression models for predicting NDVI were built for the assured rainfall zone and the scarcity zone based on the above variables for each fortnight of the study period .Independent models were also constructed and validated against the observed values. These models can predict NDVI of a certain fortnight of growing season one fortnight prior. Since, there is a seasonal effect of precipitation on vegetation response, the models were built individually for all fortnights of growing season [23]. For a specific location, it is assumed that vegetation type, soil, and terrain are temporally constant. Since all these factors are location specific and are different in terms of soil, terrain, temperature and rainfall the pattern of precipitation from other zones, impact on NDVI in assured rainfall zone and scarcity zone differs from that of the other zones.
G. Predicted and Observed NDVI
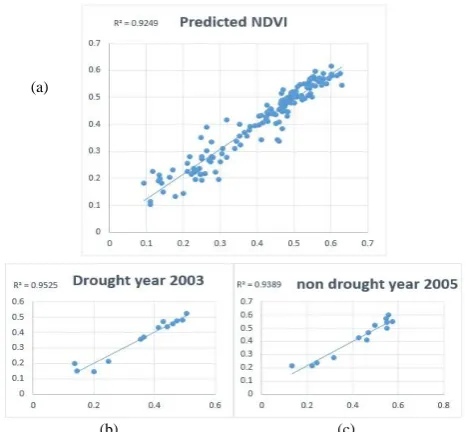
Based on these models, NDVI was predicted from 2000 to 2012 and was validated against the observed NDVI values {see Fig 8(a)}. A coefficient of determination of 95.25% and 93.89% was obtained for drought year and non-drought year respectively for the assured rainfall zone. And for the scarcity zone it was found to be 92.96 % and 96.06% for a drought year and a non-drought year respectively. The coefficient of determination was observed to be 92.49% for assured rainfall zone {see Fig. 8(b) and Fig. 8(c)} and 86.17% for scarcity zone during the study period.
This implies that more than 90% of the drought variability can be explained by the above model in assured rainfall zone. Also when compared to the model without using sunspot data, it became obvious that the coefficient of
determination improved when sunspot data were considered.
This implies that solar activity and sunspot data is correlated with the occurrence of agricultural drought and a vast scope for future study is recommended by taking into account the relationship of drought with solar activity, air temperature and rainfall.
(b) (c)
Fig. 8. (a): Predicted and observed NDVI in assured rainfall zone (model including sunspot data) (b): for drought year (c): non-drought year.
H. Crop Yield Prediction Model
The yields of major crops viz. Jowar, maize and oil seeds in the study area are predicted by developing Crop yield prediction model. A correlation test reveals that predicted NDVI of second fortnight of July was showing the highest correlation with the agricultural productivity and this was selected as the independent variable for the model in the assured rainfall zone. In the scarcity zone, predicted NDVI of first fortnight of July was showing better correlation. So it can be generalized that one can predict the yield of his crops in these zones at the month of July itself using the model.
The predicted yield when validated against the actual yield was found remarkable in both the assured rainfall zone and the scarcity zone. In the assured rainfall zone, most of the crop models were having a coefficient of determination of more than 80%.The model held good for all the years in the study period irrespective of drought or non-drought years. The predicted versus observed yield graph for Jowar in the assured rainfall zone is shown in Fig. 9.
REFERENCES
[1] A. K. Mishra and V. P. Singh, “A review of drought concepts,”
Journal of Hydrology, vol. 391, pp. 202-216, July 2010.
[2] K. Nagaraj, Farmers’ suicides in India: Magnitudes, Trends and
Spatial Patterns, Madras Institute of Development Studies, March 2008.
[3] V. Krishnamurthy and J. Shukla, “Intraseasonal and interannual variability of rainfall over India,” Journal of Climate, vol. 13, pp. 4366-4377, 2000.
[4] M. J. Hayes and M. D. Svoboda, “Monitoring the 1996 drought using Standardized Precipitation Index,” BAMS, vol. 80, pp. 429-438, 1999.
[5] A. U. Komuscu, “Using the SPI to analyse spatial and temporal pattern of drought in Turkey,” Drought Network News, vol. 11, pp. 7-13, 1999.
[6] R. A. Seiler and F. Kogan, “AVHRR based vegetation and temperature condition indices for drought detection in Argentina,”
Advanced Space Research, vol. 21, no. 2, pp. 481-484,1998.
[7] F. Anctil, W. Larouche, and A. A. Viau, “Exploration of the standardized precipitation index with regional analysis,” Canadian Journal of Soil Science, vol. 82, pp. 115-125, 2002.
[8] X. Lana, C. Serra, and A. Burgueno, “Patterns of monthly rainfall shortage and excess in terms of Standardized Precipitation Index for Catalonia,” Int. J. Climatol, vol. 21, pp. 1669-1691, 2003.
[9] S. K. Min, W. T. Kwon, E. H. Park, and Y. Choi, “Spatial and temporal comparisons of drought over Korea with east Asia,” Int. J. Climatol, vol. 23, pp. 223-233, 2003.
[10] P. Domonkos, “Recent precipitation trends in Hungary in the context of larger scale climatic changes,” Nat. Hazards, vol. 29, pp. 255-271, 2003.
[11] H. Wu, M. J. Hayes, A. Weiss, and Q. Hu, “An evaluation of the standardized precipitation index, the China-Z-index and the statistical Z-score,” Int. J. Climatol, vol. 21, pp. 745-758, 2001.
[12] B. L. Hughes and M. A. Saunders, “A drought climatology for Europe,” Int. J. Climatol, vol. 22, no. 13, pp. 1571-1592, 2002. [13] C. Mongkolsawat and P. Thirangoon, “An evaluation of drought risk
area in North-East Thailand using remotely sensed data and GIS,”
GIS Development, 2005.
[14] X. Song and G. Saito, “Early detection system of drought in East Asia using NDVI from NOAA/AVHRR data,” International Journal
of Remote Sensing, vol. 25, no. 16, pp. 3105-3111, 2004.
[15] Z. Wang and P. Wang, “Using MODIS land surface temperature and normalized difference vegetation index products for monitoring drought in the southern great plains, USA,” International Journal of
Remote Sensing, vol. 25, no. 1, pp. 61-72, 2004.
[16] T. B. McKee, N. J. Doesken, and J. Kleist, “The relationship of drought frequency and duration of time scales,” in Proc. Eighth
Conference on Applied Climatology, Anaheim, CA. Boston, MA:
American Meteorological Society, January 1993,pp. 179–186. [17] W. Thavorntam and C. Mongkolsawat, “Drought assesment in
north-east thailand using correlation and regression analysis of NDVI and rainfall,” presented at 7th Annual Conference & Exhibition on
Geospatial Information, Technology and Applications, Kuala Lumpur, Malaysia, 18-20 August, 2008.
[18] L. J. Lane, M. H. Nichols, and H. B. Osborn, “Time series analysis of global change data,” Environ Pollut., vol. 83, pp. 63-68, 1994. [19] S. B. Ratna, “Summer monsoon rainfall variability over
Maharashtra,India,” Pure and Applies Geophysics, vol. 169, pp. 259-273, 2011.
[20] P. S. Thenkabail, M. S. D. N. Gamage, and V. U. Smakhtin, “The use of Remote Sensing data for drought assesment andmonitoring in South-West Asia,” Research Report 85, International Water Management Institute, Colombo, Srilanka, 2004.
[21] K. M. Hiremath, “Influce of solar activity on the rainfall over India,” presented in ILWS Workshop, Goa, 19-24 February, 2006. [22] R. C. Wilson, “Total solar irradiance trend during solar cycles 21
and 22,” Science, vol. 277, pp. 1963-1965, 1997.
[23] D. Dutta, A. Kundu, and N. R. Patel, “Predicting agricultural drought in eastern Rajasthan of India using NDVI and standardised precipitation Index,” Geocarto International, vol. 28, pp. 192-209, 2013.
B. M. Dodamani was born in the state of Karnataka on
August 6, 1967. He obtained his B.E civil degree from B. V. B College of Engineering, Hubli, Karnataka. He obtained his M.Tech (WREM) and PhD (civil) degrees from National Institute of Technology Karnataka, India.
He is now an associate professor in the Dept. of Applied Mechanics and Hydraulics, National Institute of Technology Karnataka, India.
Anoop R. was born in the state of Kerala in India on
July 25, 1988. He obtained his B.Tech degree in civil engineering from TKM College of Engineering, Kollam, Kerala, India under the University of Kerala in 2009.
He worked as a construction engineer in Shapoorji Pallonji& Co. Ltd from 2009 to 2012. He is now doing his final year M.Tech degree in water resource engineering and management in National Institute of Technology, Karnataka, India.
D. R. Mahajan was born in the state of Maharashtra on
December 3, 1971. He obtained his B.E Civil and M.E Civil degrees from College of Engineering Pune, Maharashtra.
He is working as a lecturer in applied mechanics in Government Polytechnic, Karad, Maharashtra. He is a research scholar at National Institute of Technology Karnataka, India.
V. CONCLUSIONS