http://www.sciencepublishinggroup.com/j/ajmie doi: 10.11648/j.ajmie.20160103.25
ISSN: 2575-6079 (Print); ISSN: 2575-6060 (Online)
Communication
Application of Taguchi Method for Optimum Weld Process
Parameters of Pure Aluminum
Makkapati Sahiti, Madur Raghavendra Reddy, Budi Joshi, Boggarapu Nageswara Rao
*Department of Mechanical Engineering, Koneru Lakshmaiah University, Vaddeswaram, Guntur, India
Email address:
[email protected] (M. Sahiti), [email protected] (M. R. Reddy), [email protected] (B. Joshi), [email protected] (B. N. Rao)
*
Corresponding author
To cite this article:
Makkapati Sahiti, Madur Raghavendra Reddy, Budi Joshi, Boggarapu Nageswara Rao. Application of Taguchi Method for Optimum Weld Process Parameters of Pure Aluminum. American Journal of Mechanical and Industrial Engineering. Vol. 1, No. 3, 2016, pp. 123-128. doi: 10.11648/j.ajmie.20160103.25
Received: October 17, 2016; Accepted: December 24, 2016; Published: January 17, 2017
Abstract:
Though many optimization methods have been developed, there is a lack of comparative study regarding the performance of those methods. This paper demonstrates the adequacy as well as the simplicity of the Taguchi method on the selection of optimum process parameters of the MIG welding as well as the TIG welding of pure aluminum by comparing the grey rational analysis results of Joshi and his co-workers. ANOVA results are utilized to identify the optimum weld process parameters (viz. welding current, gas flow and wire feed rate) and estimated the possible optimum ultimate tensile strength of the aluminum weld joint, by means of additive law. The estimates are found to be reasonably in good agreement with test results, when compared to those from the empirical relations of Joshi and his co-workers.Keywords:
ANOVA, MIG Welding, Aluminum, Tensile Strength, TIG Welding1. Introduction
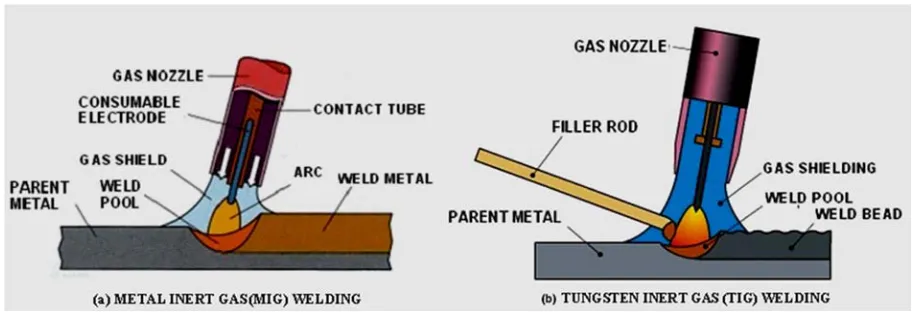
Pure aluminum having poor strength is improved by alloying with other metals. Light weight materials like aluminum alloys possessing high specific strength and corrosion resistance are being used in automotive and aerospace industries. Many components are made by casting and few of them may require welding. They will be loaded statically and dynamically as per requirement. Metal inert gas (MIG) welding and tungsten inert gas (TIG) welding (see Figure 1) are widely used techniques for joining ferrous and non-ferrous metals. Both welding processes initially superheat the parent metals into a liquid state, and finally a filler material is used to fuse the parent metals together. They use a shielding during welding process. MIG welding runs the filler material from a wire coil through the MIG torch. This wire carries the electrical current, and does the actual welding. TIG welding uses a tungsten electrode to superheat the parent metals. The filler material will be dabbed onto the weld puddle. The sharpened tungsten electrode is poking out
the front of the torch when the two metals have reached a liquid state. TIG welding uses pure argon welding gas, whereas MIG welding generally uses a mix of 25% Argon, 75% CO2. TIG welding process is a more versatile than the MIG welding process due to quick changing of the filler material by just grabbing another rod, whereas MIG welding requires a wire change.
Figure 1. Inert gas welding.
Saluja and Moeed [1] have adopted the factorial design approach to examine the MIG welding parameters (viz., welding current, arc voltage, stick-out distance of electrode and welding speed) on aluminum by measuring bead geometry and weld penetration. They have developed a mathematical model for sound quality bead width, bead penetration and weld reinforcement on butt joint. The welding current is found to be the most influencing parameter on the weld geometry. Patel and Gandhi [2] have recorded tensile strength for MIG welding parameters such as welding current, welding speed, flow of shielding gas and arc voltage. It is noted that the tensile strength increases with increasing the welding current. Palani and Saju [3] have examined the TIG welding process parameters (viz., welding speed, current and gas flow rate) on welding of aluminium and used the response surface methodology to conduct the experiments for measuring the strength of weld joints. It is noted that welding current is highly influencing parameter on the tensile strength and percent elongation. Haragopal and Ravindra Reddy [4] have applied Taguchi method to study the effect of gas pressure, current, groove angle and preheat on MIG welding of Al- 65032. Welding current is found to influence the ultimate tensile strength. Gas pressure is found to be the significant parameter for proof stress, elongation and impact energy. Padmanaban and Balasubramanian [5] have studied the effect of pulsed current gas tungsten arc welding process parameters on tensile strength in AZ31B magnesium alloy. The pulse frequency has the greatest influence on tensile strength, followed by peak current, pulse on-time and base current.
Joshi et al. [6] have adopted the full factorial method in their experimental design to generate the tensile strength values for all combination levels of the welding parameters (viz., welding current, gas flow and wire feed rate for MIG welding, whereas welding current and gas flow for TIG welding). The grey relational analysis (GRA) technique has been used to perform parametric optimization. The method of approach followed by Joshi et al. [6] requires more number of experiments. It is preferable to have less number of experiments by adopting the Taguchi’s approach, which uses the orthogonal array to study large number of design
variables by conducting minimum number of experiments. Saxena et al. [7] have examined the influence of MIG welding parameters on tensile strength of AM-40 (EN AW5083) aluminum alloy using Taguchi technique. Welding current and welding voltage are influencing the tensile strength of welded joint. The signal-to-noise (S/N) ratio transformation in the Taguchi’s design of experiments considered by Saxena et al. [7] is on a single value of each test run output response. In fact, Taguchi has created the S/N ratio transformation to consolidate several repetitions into one value to reflect the amount of variation present. Hence, the unwanted S/N ratio transformation adopted by them has no added advantage other than additional computational work. Flux bounded tungsten inert gas welding process is recommended to improve penetration capability of TIG process for joining of aluminum alloys [8-10]. Several optimization methods have been adopted for modeling, control and optimizing the different weld process to achieve a good quality of weld joints [11-18]. There is a lack of comparative study regarding the performance of those methods.
2. Taguchi’s Design of Experiments and
Analysis of Variance
The work-piece is made of pure aluminum (>99.5% Al) of 1xxx series, which is a soft material having low mechanical strength and high conductivity. It has 10mm thickness, 50.8mm width and 125mm length. It is a butt joint with complete penetration groove. The design of experiments involves selection of independent variables or factors (viz., electric current, feed rate and gas flow); selection of number of level setting for each independent variable; selection of orthogonal array; assignment of independent variable to each column of orthogonal array; conducting experiments for measuring the ultimate tensile strength of the butt joint. Table-1 gives the assignment levels of process parameters [6] and the performance output response (viz., the ultimate tensile strength) for the assigned process parameters as per L9 orthogonal array. Analysis of variance (ANOVA) is performed as in Refs.19 and 20 to trace the optimum process parameters for obtaining maximum ultimate tensile strength (UTS) of the weld joint. It is noted from the ANOVA results of Table-2 that electric current, feed rate and gas flow effect on the UTS are 36.8, 30.3 and 32.9% respectively.
Table 1. Performance output response, viz., the ultimate tensile strength (UTS) of the weld joint for the assigned process parameters as per L9
orthogonal array (MIG welding).
Assignment levels of process parameters in MIG welding.
Control Factors (Input parameters)
Designate
d Factor Level -1 Level-2
Level -3
Electric current (Amp) A 135 145 155
Feed rate (ft/min) B 9 10 11
Gas flow (lit/min) C 15 20 25
Performance output response, viz., the ultimate tensile strength (UTS).
Test Run
Levels of input parameters UTS (MPa)
A B C Test [6] Eq.(1) Eq.(2) [6]
1 1 1 1 69.21 68.00 69.29
2 1 2 2 75.46 77.06 73.56
3 1 3 3 78.63 77.31 77.84
4 2 1 2 74.53 73.22 75.60
5 2 2 3 78.12 76.90 79.95
6 2 3 1 70.17 72.72 75.41
7 3 1 3 75.04 77.60 81.92
8 3 2 1 79.12 77.81 77.45
9 3 3 2 84.67 83.45 81.72
Table 2. Analysis of variance (ANOVA) for the UTS (MPa) of the weld joint in MIG welding.
Paramet
ers 1-Mean 2-Mean 3-Mean
Sum of squares
%
contribution
A 74.43 74.27 79.61 55.30 36.8
B 72.93 77.57 77.82 45.57 30.3
C 72.83 78.22 77.26 49.56 32.9
The process parameters for the maximum UTS
corresponding to MIG welding are A3 B3 C2. Here subscripts denote the level of the parameter. Conformation experiments are necessary to find the output responses for the identified optimum process parameters. However, there is a possibility of estimating the optimal output response for the desired process parameters by means of additive law [21]:
(
)
1
ˆ
p
m i m
i
η η η η
=
= +
∑
− (1)Here
η
ˆ
is the optimum value for the output response;m
η
is the overall mean ofη
with 9 test runs;η
i is the mean ofη
at the optimal level for the process parameters (i); and p is the number of process parameters. The empirical relation for ultimate tensile strength (UTS) developed by Joshi et al. [6] for MIG welding is2.4 0.340
1.36
0.583
UTS
=
+
× +
A
× +
B
×
C
(2)The estimated value of the UTS corresponding to the MIG welding is 83.44 MPa, which is found to be in good agreement with the test result of 84.67 MPa in Table1. The mathematical model of Ref.6 given in equation (2) provides the UTS value for the optimum process parameters as 81.72 MPa. Equation (1) can be used for estimation of the output response (in the present study, the UTS) for each test run by considering
η
i as the mean value ofη
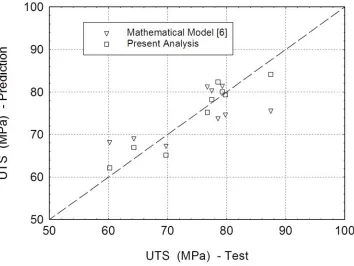
at the level of the process parameter (i). It should be noted that the estimates of the UTS of MIG welding for each test run using equation (1) in Table 1 are reasonably in good agreement with test results as well as those obtained from the empirical relation (2) of Joshi et al. [6]. Figure 2 shows the comparison of experimental and estimated output response, viz., the ultimate tensile strength (UTS) in MIG welding for all possible levels of the input variables. The estimated values of the UTS are found to be in reasonably good agreement with test results as well as the mathematical model [6]. The discrepancy in predictions is mainly due to scatter in the test results of UTS.Table 3. Performance output response, viz., the ultimate tensile strength (UTS) of the weld joint for the assigned process parameters as per L9
orthogonal array (TIG welding).
Assignment levels of process parameters in TIG welding.
Control Factors (Input parameters)
Designated
Factor Level -1 Level-2 Level-3
Electric current (Am) A 210 225 240
Gas flow (lit/min) C 6 7 8
Performance output response, viz., the ultimate tensile strength (UTS).
Test Run
Levels of input
parameters UTS (MPa)
A C Test [6] Eq.(1) Eq.(3) [6]
1 1 1 64.29 66.93 69.08
2 1 2 60.19 62.15 68.20
3 1 3 69.74 65.16 67.32
4 2 1 87.48 84.12 75.62
5 2 2 79.79 79.34 74.74
6 2 3 78.53 82.35 73.86
7 3 1 79.28 80.02 82.16
8 3 2 76.73 75.24 81.28
9 3 3 77.48 78.25 80.40
Table 3 gives the assignment levels of process parameters in TIG welding [6] and the performance of output response (viz., the ultimate tensile strength) for the assigned process parameters as per L9 orthogonal array. Analysis of variance (ANOVA) is performed as in Refs.19 and 20 to trace the optimum process parameters for obtaining maximum ultimate tensile strength (UTS) of the weld joint. It is noted from the ANOVA results of Table 4 that electric current and gas flow effect on the UTS in TIG welding are 93.2 and 6.8% respectively. The process parameters for the maximum UTS corresponding to TIG welding are found to be A2 C1. The estimated value of the UTS corresponding to the TIG
welding is 84.12 MPa, which is found to be in good agreement with the test result of 87.48 MPa in Table 3.
Table 4. Analysis of variance (ANOVA) for the UTS (MPa) of the weld joint in TIG welding.
Parameters 1-Mean 2-Mean 3-Mean Sum of squares
%
contribution
A 64.74 81.93 77.83 483.79 93.2
C 77.02 72.24 75.25 35.05 6.8
The empirical relation for ultimate tensile strength (UTS) developed by Joshi et al. [6] for TIG welding is
17.2 0.436 0.88
UTS= − + × −A ×C (3)
The mathematical model of Ref.6 given in equation (3) provides the UTS value in TIG welding for the optimum process parameters as 75.62 MPa. Equation (1) is used for estimation of UTS for each test run by considering
η
i as the mean value ofη
at the level of the process parameter (i). The estimates of the UTS of MIG welding for each test run using equation (1) in Table-3 are reasonably in good agreement with test results as well as those obtained from the empirical relation (3) of Joshi et al. [6]. Figure 3 shows the comparison of experimental and estimated output response, viz., the ultimate tensile strength (UTS) in TIG welding for all possible levels of the input variables. The estimated values of the UTS are found to be in reasonably good agreement with test results as well as the mathematical model [6]. The discrepancy in predictions is mainly due to scatter in the test results of UTS.An attempt is made to improve the estimations by introducing fictitious input parameters for the same test runs. As per the Taguchi design of experiments, the relation between the number of experiments (
N
Taguchi), and the factors or input parameters with their assigned levels is1 ( 1)
Taguchi
N = +Number of factors× Number of Levels− (4)
When
N
Taguchi=9 and Number of Levels=3, equation (4)gives 4 number of factors that can be accommodated. In MIG welding the number of factors considered in Ref.6 is 3, whereas it is 2 for TIG welding. A fictitious factor F is introduced for MIG welding and two fictitious factors F1 and F2 for TIG welding. ANOVA has been performed for both MIG and TIG welding processes and estimated the UTS for the assigned levels. Equation (1) is used for estimation of UTS for each test run by considering
η
i as the mean value ofη
at the level of the process parameter (i). In case of fictitious parameters, the levels of lowest and highest mean values ofη
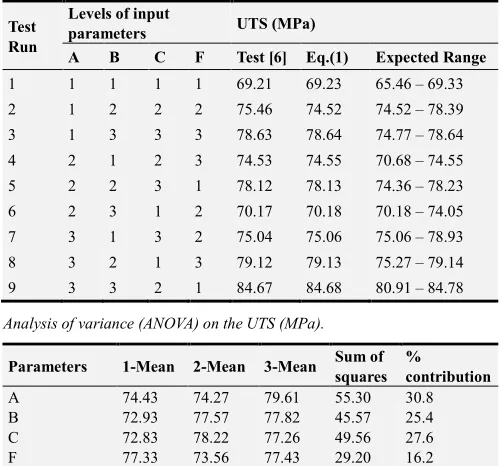
are considered to specify the expected range of the UTS. The estimates of UTS in Tables 5 and 6 are found to be close to the test results. Most of the results are found to be within the expected range of UTS.Table 5. Performance output response, viz., the ultimate tensile strength (UTS) of the weld joint for the assigned process parameters as per L9
orthogonal array (MIG welding).
Assignment levels of process parameters.
Control Factors (Input parameters)
Designated
Factor Level -1 Level-2 Level-3
Electric current (Amp) A 135 145 155
Feed rate (ft/min) B 9 10 11
Gas flow (lit/min) C 15 20 25
Fictitious F f1 f2 f3
Performance output response, viz., the ultimate tensile strength (UTS).
Test Run
Levels of input
parameters UTS (MPa)
A B C F Test [6] Eq.(1) Expected Range
1 1 1 1 1 69.21 69.23 65.46 – 69.33
2 1 2 2 2 75.46 74.52 74.52 – 78.39
3 1 3 3 3 78.63 78.64 74.77 – 78.64
4 2 1 2 3 74.53 74.55 70.68 – 74.55
5 2 2 3 1 78.12 78.13 74.36 – 78.23
6 2 3 1 2 70.17 70.18 70.18 – 74.05
7 3 1 3 2 75.04 75.06 75.06 – 78.93
8 3 2 1 3 79.12 79.13 75.27 – 79.14
9 3 3 2 1 84.67 84.68 80.91 – 84.78
Analysis of variance (ANOVA) on the UTS (MPa).
Parameters 1-Mean 2-Mean 3-Mean Sum of squares
%
contribution
A 74.43 74.27 79.61 55.30 30.8
B 72.93 77.57 77.82 45.57 25.4
C 72.83 78.22 77.26 49.56 27.6
F 77.33 73.56 77.43 29.20 16.2
Table 6. Performance output response, viz., the ultimate tensile strength (UTS) of the weld joint for the assigned process parameters as per L9
orthogonal array (TIG welding).
Assignment levels of process parameters.
Control Factors (Input parameters)
Designated
Factor Level -1 Level-2 Level-3
Electric current (Am) A 210 225 240
Gas flow (lit/min) C 6 7 8
Fictitious F1 f1 f2 f3
Fictitious F2 f4 f5 f6
Performance output response, viz., the ultimate tensile strength (UTS).
Test Run
Levels of input
parameters UTS (MPa)
A C F1 F2 Test [6] Eq.(1) Expected Range
1 1 1 1 1 64.29 65.15 63.97 – 71.52
2 1 2 2 2 60.19 60.21 59.19 – 66.74
3 1 3 3 3 69.74 69.75 62.20 – 69.75
4 2 1 2 3 87.48 87.49 81.16 – 88.71
5 2 2 3 1 79.79 79.80 76.38 – 83.93
6 2 3 1 2 78.53 79.39 79.39 – 86.95
7 3 1 3 2 79.28 79.30 77.06 – 84.61
8 3 2 1 3 76.73 77.59 72.28 – 79.83
9 3 3 2 1 77.48 77.67 75.29 – 82.84
Analysis of variance (ANOVA) on the UTS (MPa).
Parameters 1-Mean 2-Mean 3-Mean Sum of squares
%
contribution
A 64.74 81.93 77.83 483.79 84.3
C 77.02 72.24 75.25 35.05 6.1
F1 74.03 75.05 76.27 8.28 1.4
F2 73.85 72.67 77.98 46.65 8.2
3. Conclusion
References
[1] Saluja R, Moeed KM. Modeling and parametric optimization using factorial design approach of submerged arc bead geometry for butt joint, International Journal of Engineering Research and Applications 2012; 2 (3): 505-508. www.ijera.com/papers/Vol2_issue3/CF23505508.pdf.
[2] Patel BC, Gandhi J. Optimizing and analysis of parameter for pipe welding: A literature review, International Journal of Engineering Research & Technology 2013; 2 (10): 229-234. www.ijert.org.IJERTV2IS100118.
[3] Palani PK, Saju M. Modeling and optimization of process parameters for TIG welding of aluminum65032, International Journal of Engineering Research and Applications 2013; 3 (2): 230-236.
www.ijera.com/papers/Vol3_issue2/AH32230236.pdf. [4] Hargopal G, Ravindra Reddy PVR. Parameter design for MIG
welding of Al- 65032 alloy using Taguchi technique, Journal of Scientific and Industrial Research 2011; 70: 844-850. http://nopr.niscair.res.in/handle/123456789/12679.
[5] Padmanaban G, Balasubramanian V. Optimization of pulsed current gas tungsten arc welding process parameters to attain maximum tensile strength in AZ31B magnesium alloy, Transactions of Nonferrous Metals Society of China 2011; 21(3): 467-476. doi:10.1016/S1003-6326 (11)60738-3. [6] Joshi J, Thakkar M, Vora S. Parametric optimization of metal
inert gas welding and tungsten inert gas welding by using analysis of variance and grey relational analysis, International Journal of Science and Research 2014; 3(6):1099-1103. www.ijsr.net/archive/v3i6/MDIwMTQ0MDU=.pdf.
[7] Saxena V, Parvez M, Saurabh, Optimization of MIG welding parameters on tensile strength of aluminum alloy by Taguchi approach, International Journal of Engineering Sciences & Research Technology 2015; 49 (6): 451-457.
[8] Santhana Babu AV, Girivardhan PK, Ramesh Narayan P, Narayana Murty SVS, Sharma VMJ. Experimental investigations on tensile strength of flux bounded TIG welds of AA2219-T87 aluminum alloy, Journal of Advanced Manufacturing Systems 2014; 13(2): 103-112. DOI: 10.1142/s0219686714500073.
[9] Santhana Babu AV, Girivardhan PK, Ramesh Narayan P, Narayana Murty SVS. Prediction of bead geometry for flux bounded TIG welding of AA2219-T87 aluminum alloy, Journal of Advanced Manufacturing Systems 2016; 15 (2): 69-84. DOI: 10.1142/s0219686716500074.
[10] Santhana Babu AV, Ramesh Narayan P, Narayana Murty SVS. Development of flux bounded tungsten inert gas welding process to join aluminum alloys, American Journal of
Mechanical and Industrial Engineering 2016; 1 (3): 58-63. DOI: 10.11648/j.ajmie.20160103.14.
[11] Benyounis KY, Olabi AG. Optimization of different welding processes using statistical and numerical approaches – A reference guide, Advances in Engineering Software 2008; 39: 483-496. DOI: 10.1016/j.advengsoft.2007.03.012.
[12] Esme U, Bayramoglu M, Kazancoglu Y, Ozgun S. Optimization of weld bead geometry in TIG welding process using grey relation analysis and Taguchi method, Materials and Technology 2009; 43 (3): 143-149.
[13] Prakash J, Tewari SP, Srivastava BK. Shielding gas for welding aluminum alloys by TIG/MIG welding- A review, International Journal of Modern Engineering Research (IJMER) 2011; 1 (2): 690-699.
[14] Chauhan V, Khandoori G, Kumar A. Role of Taguchi design of experiment in optimization of welding process parameters for different materials-A review, International Journal of Advanced Technology & Engineering Research (IJATER) 2014: 146-151.
[15] Eshwar D, Kumar ACS. Taguchi based mechanical property optimization of as weld Al-65032 alloy using TIG welding, IOSR Journal of Mechanical and Civil Engineering (IOSR-JMCE) 2014; 11 (6): 56-62.
[16] Kausal C, Sharma L. To find effects of GMAW parameters on mechanical properties of aluminum alloys, Journal of Engineering Research and Applications 2014; 4 (11): 88-92. [17] Eshwar D, Kumar ACS, Chari BKV. Al-65032 mechanical
property optimization and analysis of heat treated samples based on Taguchi metal inert gas (MIG) welding, International Journal of Scientific Engineering and Technology Research 2015; 4 (9): 1630-1635.
[18] Achebo J, Odinikuku WE. Optimization of gas metal arc welding process parameters using standard deviation (SDV) and multi-objective optimization on the basis of ratio analysis (MOORA), Journal of Minerals and Materials Characterization and Engineering 2015; 3: 298-308. http://dx.doi.org/10.4236/jmmce2015.34032.
[19] Srinivasa Rao B, Rudramoorthy P, Srinivas S, Nageswara Rao B. Effect of drilling induced damage on notched tensile strength and pin-bearing strength of woven GFR-epoxy composites, Materials Science & Engineering A 2008; 472: 347-352.
[20] Singaravelu J, Jeyakumar D, Nageswara Rao B. Taguchi’s approach for reliability and safety assessments in the stage separation process of a multistage launch vehicle, Reliability Engineering & System Safety 2009; 94 (10): 1526-1541. doi:10.1016/j.ress.2009.02.017.
![Table-1 gives the assignment levels of process parameters [6]](https://thumb-us.123doks.com/thumbv2/123dok_us/8571531.1716771/3.595.42.290.495.654/table-gives-assignment-levels-process-parameters.webp)