The delineation of intraprostatic boost regions for radiotherapy
using multimodality imaging
Angela U Pathmanathan, Emma J Alexander, Robert A Huddart &
Alison C Tree
ABSTRACT
Dose-escalation to the prostate improves tumour control but at the expense of increased rectal toxicity. Modern imaging can be used to detect the most common site of recurrence, the intraprostatic lesion (IPL), which has led to the concept of focussing dose-escalation to the IPL in order to improve the therapeutic ratio. Imaging must be able to detect lesions with adequate sensitivity and specificity to accurately delineate the IPL. This information must be carefully integrated into the radiotherapy planning process to ensure the dose is targeted to the IPL. This review will consider the role and challenges of multi-parametric MRI (mp-MRI) and positron emission tomography computed tomography (PET-CT) in delineating a tumour boost to be delivered by external beam radiotherapy (EBRT).
KEYWORDS
Prostate cancer, intraprostatic lesion, dose-escalation, boost, MRI, PET-CT
Background – the rationale behind the intraprostatic boost
Dose-escalation
Increasing the dose to the prostate during radical radiotherapy (RT) has consistently shown improvement in biochemical control [1-6]. A meta-analysis showed that the postulated improvement in biochemical control rate at five years was an increase of 19.2% in high-risk patients between the dose ranges of 70-80Gy [3]. However, dose-escalation to the whole prostate is associated with an increase in bladder and rectal toxicity [4-7].
Patterns of recurrence
Therefore a higher dose to the IPL may reduce biochemical prostate-specific antigen (PSA) failure and it is suggested that improving local control may translate into a reduction in distant metastases [11].
Improved therapeutic ratio
The demonstration of disease recurrence within the DIL has led to the proposal of boosting this region, whilst maintaining a standard dose to the rest of the prostate, in order to improve the therapeutic ratio [12]. The boost dose needs to be at least 80-90Gy in 2 Gray fractions, to reach the top of the tumour control probability (TCP) curve [3, 5]. The aim of treatment would be to increase the TCP without increasing the normal tissue complication probability (NTCP) for the bladder and rectum.
Multifocality
Prostatectomy specimens reveal the multifocality of prostate cancer [13] and when more than one tumour is identified on imaging, boosting several dominant nodules is technically possible [14]. The significance of smaller, incidental tumours however, is unclear. Noguchi et al reported that the secondary tumours identified following radical prostatectomy did not predict for biochemical failure [15]. In a disease where we know some low risk cancers can safely be observed [16, 17], stratification systems have been produced which help to determine intraprostatic disease which can be considered insignificant on template-mapping biopsy procedures [18]. This is an important concept to consider when discussing IPL boost.
Dose Painting
Figure 1. An example of an IPL boost delivered using Cyberknife within the SPARC trial (NCT02145494). Purple shading represents prostate planning target volume (PTV), green shading represents IPL boost
Also unclear is which groups of patients would benefit from an intraprostatic boost. Given the excellent control rates seen from studies such as the CHHiP trial [29], it may be that only higher risk patients will benefit from an intraprostatic boost.
Identification of IPL
Although imaging techniques have previously been reviewed for detection of an IPL, whether an image is sufficient to accurately define the tumour boundary is a separate question. An accurate IPL boost involves several stages, from optimal imaging, accurately transferring this information to the planning CT, correct identification and delineation of the lesion, and then delivering the radiotherapy as intended.
In this article, we will be looking at the use of imaging when delineating a boost for EBRT modalities, specifically concentrating on multiparametric MRI (mp-MRI) and positron emission tomography (PET). For each of these, we consider the limitations, practicalities and challenges of IPL delineation under the following sections
Type of imaging
Limitations and challenges of imaging
Histopathological correlation of contours for boost techniques
Feasibility of boost delivery
Integration of imaging during radiotherapy
MR IMAGING
Multiparametric Imaging
The accuracy of MRI in staging prostate cancer has been extensively studied. Conventional MRI consists of anatomical T2 weighted images (T2W) with prostate cancer exhibiting low T2 signal intensity. Multiparametric MRI (mp-MRI) includes functional data from dynamic contrast-enhanced (DCE), MR spectroscopy (MRS) and/or diffusion weighted imaging (DWI), which can all provide additional information on the tumour to improve the sensitivity and specificity of tumour detection [34-39].
DCE-MRI acquires images whilst contrast is administered and therefore provides information on the perfusion and vascular permeability of a tumour. DWI assesses the motion of water molecules, with tumours showing a restricted diffusion due to increased cellularity. This restriction of diffusion is expressed as the apparent diffusion coefficient (ADC) and has been found to be a predictor of the aggressiveness of a prostate cancer [40, 41]. MRS is a form of metabolic imaging that detects prostate cancer due to the lower levels of intracellular citrate and higher levels of choline compared to benign prostate tissue. There is increased sensitivity for detection of prostate cancer with the addition of MRS [36], however spatial resolution is poor, limiting accurate tumour delineation.
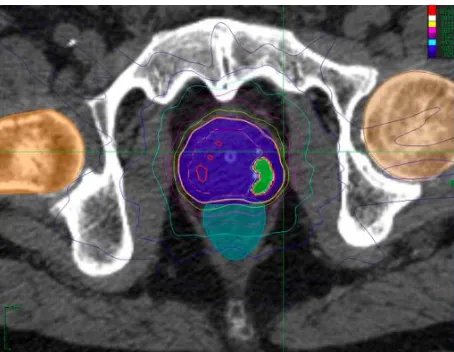
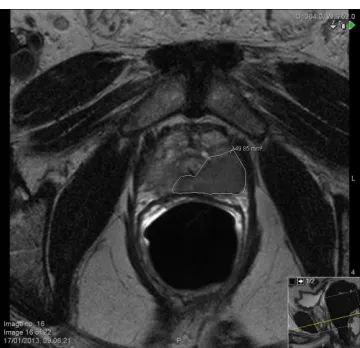
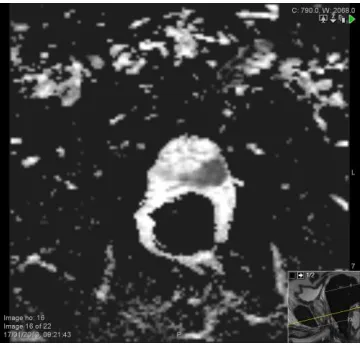
Combining modalities improves the sensitivity compared to T2W images alone [37-39]. Pooled results from studies using the combination of T2W, DWI and DCE-MRI show a sensitivity of 0.74 (95% CI, 0.66–0.81) with specificity of 0.88 (95% CI, 0.82–0.92) [42]. Of the three multiparametric modalities (DWI, MRS and DCE), two appear to be sufficient for maximal sensitivity and adding in the third modality may not be of additional benefit [43]. Current recommendations suggest the use of two functional MRI techniques in addition to standard T2 weighted images [44]. Figure 2 shows an IPL on mp-MRI and PET imaging with an IMRT plan depicting the boost dose for the DELINEATE trial (UKCRN ID 10309).
Figure 2a
Figure 2c
Figure 2d
Limitations and Challenges of MRI for delineation of IPL
Accuracy
The reported accuracy of MR imaging for IPL delineation is variable and dependent on a number of imaging factors as well as tumour characteristics. Technical factors include field strength, b values (which assess the strength of the gradients for DWI), signal- to-noise ratio and whether an endorectal coil (ERC) is used. The latter improves the spatial resolution and has been found to improve the sensitivity, specificity and staging accuracy of prostate cancer [45] but the presence of the coil causes distortion of the prostate, which limits its use in planning radiotherapy.
Low signal on T2W can be seen with prostatitis, haemorrhage, post radiotherapy change and scarring, and distinguishing these from tumour nodules can be challenging.
MRI is limited in the detection of small volume tumours e.g. <0.5cm3 [46],
particularly those of lower Gleason score. This is due to histological characteristics of the tumour focus, such as the ratio of malignant epithelium-to-stroma, which are inherently different in lesions picked up on MRI compared to those that are not detected [47, 48].
Interobserver Variability
The delineated shape and size of the IPL should be consistent, aiming to minimise inter- and intraobserver variability. Steenbergen et al compared the delineated tumours using mp-MRI from six teams from three different centres [49]. These were compared to the histological findings from prostatectomy to assess the accuracy of tumour delineation and interobserver variability. Using the combination of T2W, DWI and DCE images, 18 out of 20 dominant lesions were detected by all groups. However, parts of the dominant lesion were missed and 66 out of 69 satellite lesions were undetected. As discussed previously, the clinical significance of these satellite lesions, most of which were smaller than 0.4cm3, is unclear [15]. Although this data is consistent with the high sensitivity
of detecting tumours with mp-MRI, there was discrepancy of the shape and size of the dominant lesion to be boosted. This may have an impact on local control if the dose to the remaining prostate were to be reduced, or focal therapy techniques used in isolation. However, overall there was good agreement (kappa statistic of 0.61) between observers.
Image Interpretation
Computer aided delineation techniques such as this and others [53, 54] use quantitative features from images to assess whether each voxel is classified as tumour or normal tissue. Further validation is required but these programmes could help to reduce uncertainty in delineation and reduce interobserver variation [55].
Effect of Androgen Deprivation Therapy
The timing of the imaging to be used for definition of the boost is particularly relevant in prostate cancer. Dominant nodules may be easily defined on initial diagnostic imaging, however most patients then receive ADT, which decreases the size of the IPL, and reduces tumour conspicuity [56]. Imaging for DIL delineation for radiotherapy planning could therefore be acquired prior to starting ADT with immediate irradiation, thus necessitating a change in the treatment paradigm. Alternatively, the information from pre-ADT imaging can be ‘mapped’ onto post-ADT imaging using deformable registration techniques. Additionally, it is unknown whether the optimal target is in fact the pre- or post-ADT lesion. The latter would require further investigation into the effect of post-ADT on mp-MRI images and may become clearer when the exact benefits of an IPL boost are confirmed.
Histopathological Correlation of Contours with MRI
The gold standard of any imaging technique is correlation with histopathology, however accurate comparison with imaging is extremely challenging. Even with studies comparing imaged IPLs with ‘whole-mount prostate’ reference histology there are certain limitations such as shrinkage of tissue during fixation and co-registration errors, which may be introduced when aligning histopathology specimens to the equivalent imaging slice. To reduce the impact of such errors one group have used individualised MRI-based custom moulds to aid accurate co-registration of the specimens following prostatectomy [57].
Variability of tumour volume estimation
Data shows a positive correlation between the tumour volume derived from histopathology and the MRI defined volume, with the accuracy of MRI estimation improving with a higher tumour volume [46, 58]. However, even for lesions greater than 0.5cm3, there is still variability [46]. Coakley et al found the MRI
defined tumour volume ranged from 3% to 433% of the actual volume on histopathology [46]. However, this study looked at any Gleason grade of tumour in the specimen and as discussed above, Gleason grade 3+3 may be less distinct on MRI.
Several studies show tumour volume may be under- rather than overestimated on MRI [59-62]. One such study comparing the volume seen on MRI compared to histology in 50 tumours [59], showed underestimation by mp-MRI with the volume being lower by a mean of 47% compared to histopathology. Interestingly, this group found that the underestimation was worse for lesions with a high Gleason score [59, 62], which has the potential to severely impact the outcome for these patients.
Groenendaal et al found that the use of mp-MRI for IPL delineation gave a tumour coverage of 44-89% of the corresponding lesion on whole mount histopathology [60]. The addition of a margin of two voxels (approximately 5mm) improved coverage to 85% or more. Similar results for the margin required have been suggested by other studies. Anwar et al identified prostate foci using MRS and subsequently contoured these lesions using T2W images in patients about to undergo prostatectomy (mp-MRI was not used) [61]. When compared to whole mount histopathology, they found that in order to cover the ‘MRI undercall’ (i.e. the areas underestimated by the readers) that expansion by 5mm at the non-capsular margin would cover 95% of the actual tumour volume.
A similar study comparing MRI contouring to histopathology concluded that a 9mm margin would be adequate to cover all 46 tumours analysed [62]. This differed from the studies above by looking at which margin would be required to cover the entire tumour. The authors suggested 9mm as the non-capsular margin and 3mm for the capsular margin, to take into account extraprostatic extension. However, the maximum Hausdorff Distance (HD), looking at the difference between the MR delineated lesion and histology, was significantly greater for high grade lesions. It must be considered that the 9mm margin suggested, included coverage of Gleason 6 tumours (10/46 lesions). Margins could therefore be stratified based on tumour characteristics, especially as in the absence of de-escalation to the whole prostate gland, coverage of low risk disease is not the objective. For example the same study showed that a smaller margin of 5mm covered 73.9% of tumours, 7mm covered 93.5% of tumours.
From a radiotherapy planning point of view, these studies indicate an intraprostatic margin of 5mm around the MRI defined IPL would be suitable [60, 61]. A further factor to be considered is the administration of ADT, which would shrink the IPL and surrounding prostate, so a smaller margin may subsequently be appropriate.
Feasibility of MRI-defined boost delivery - theoretical
There have been a number of planning studies estimating the TCP, NTCP and investigating the factors that would make an IPL boost feasible. These are outlined in Table 1.
REFERENCE PATIENTS IMAGING TECHNIQUES RADIOTHERAPY TREATMENT FINDINGS
Van Lin (2006)
[63, 64] n=5 1.5T MRI with ERC T2W, MRS, DCE
MR and CT fusion using fiducials IPL delineation by radiologist
Step and shoot IMRT with SIB Plan 1 (boost to IPL):
Prostate + 7mm 70Gy/35f IPL + 5mm 90Gy/35f Plan 2 (no boost to IPL): Prostate + 7mm 78Gy/39f
In 5/5 patients, increased therapeutic ratio with boost plan due to a reduction in rectal NTCP with maintained TCP
Housri (2011)
[64] n=42 overall n=24 had visible IPL
MRI with ERC T2W, DCE, ADC, MRS
Treatment planning MR without ERC in 14/24 patients with IPL.
Manual transfer of MRI information
Step and shoot IMRT with SIB
Prostate + 9mm (5mm post) 75.6Gy/42f IPL + 3mm 151.2Gy/42f
Dose escalation to 151.2Gy achieved in 12/24 and between 94.5Gy-136.1Gy in 9/24
SIB infeasible lesions less than 4.2mm from rectum
SIB more feasible with greater hip-hip width >37.22cm
Ost
(2011) [24] n=12 T2W and/or MRS MR and CT fusion Step and shoot IMRT (3,5,7 field) compared to VMAT Prostate + 4mm D50 > 78Gy
IPL + 0mm D50 >85Gy
SIB feasible with 5,7 field IMRT and VMAT
VMAT superior to IMRT for rectal volumes receiving 20-50Gy
Tree (2013)
[28] n=15 T2W MR and CT fusion
IPL delineation by oncologist and radiologist
SBRT with SIB
Planned for both Cyberknife and RapidArc IPL + 0mm 47.5Gy/5f
Prostate + 5mm (3mm post) 36.25Gy/5f
Boost feasible with both treatment methods
If margins increased to 8mm (5mm post) 37/75 compared to 11/75 of constraints missed Riches (2014)
[65] n=23 overall n=20 had visible IPL
1.5T MRI with ERC T2W, MRS, DCE (pre-ADT) MR and CT fusion using fiducials
Step and shoot IMRT IPL + 2mm 82Gy/37f
Prostate + 3mm (0mm post) 74Gy
TCP significantly higher in boost plan
Rectal NTCP significantly lower in boost plan
Murray
(2014) [26] n=10 1.5T MRI T2W, DWI, DCE
IPL delineation by radiologist MR and CT fusion
VMAT
Prostate + 6mm 42.7Gy/7f (alternate days) IPL + 4mm, prescription dose increased by 5% increments starting at 115%
Plans with proximal SV 32.4-36.5Gy/7f
For prostate alone plus boost- median SIB 53.4Gy/7f (125%) Rectal NTCP increased with IPL boost
Feng (2015)
[66] n=14 n=7 planned (smaller IPL)
1.5T MRI T2W
IPL delineation by radiologist
VMAT (dual arc)
Prostate + 5mm (3mm post) 36.25Gy/5f IPL + 3mm 47.5Gy/5f
The largest of these was published by Housri et al. Nine-field IMRT plans were designed with the aim of delivering a total dose of 151.2Gy to the IPL without violating dose constraints [64]. This was possible in 12 out of 24 patients and in particular, they reported the distance between the IPL and rectum was predictive of whether high dose radiation could be delivered to the IPL, with a plan being infeasible with a distance of less than 4.2mm from the IPL to the rectum.
Riches et al. planned IMRT at a dose of 74Gy to the whole prostate with an additional 8Gy SIB in twenty patients with an IPL identified using mp-MRI [65]. A planned boost was feasible in all patients whilst meeting dose constraints. Radiobiological modelling suggested a significant improvement for the TCP in the boosted plans with a significantly lower rectal NTCP for the boosted plan. This finding has also been reported in other studies [25, 63] and may be due to the redistribution of dose, including hotspots, when a boost is planned.
Feasibility of MRI-defined boost delivery – clinical
Acknowledging the limitations described above, and with the aspiration that MR imaging will continue to increase its accuracy in delineating IPLs, several investigators have assessed the practicalities of delivering radiotherapy with focal dose-escalation. There have been several studies confirming that an MRI-planned radiotherapy boost is practically feasible, can be delivered within dose constraints and is possible without an increase in acute toxicity. These are summarised in Table 2.
The studies in Table 2 have generally shown that an IPL can be selectively dose-escalated with no obvious toxicity penalty. Further randomised studies are needed to confirm this hypothesis.
REFERENCE PATIENTS IMAGING RADIOTHERAPY TREATMENT SUMMARY OF TOXICITY
De Meerleer
(2005) [19] n=15 ADT 87%
L/I/H: not specified
1.5T MRI with ERC T2W
9/15 patients had ERC
Step and shoot IMRT with SIB Verification with daily ultrasound Prostate + 7-10mm 74Gy
IPL +0mm dose 80Gy
Long term follow up not specified Acute: (RTOG)
GI- 20% Gr2, 0% Gr3 GU- 40% Gr2, 7% Gr3 Singh (2007)
[14] n=3 ADT not specified L/I/H: not specified
3T MRI with ERC T2W, MRS, DCE MR and CT fusion using fiducials
Step and shoot IMRT with SIB Fiducials
Prostate + 7mm 75.6Gy/42f IPL +3mm dose 94.5Gy/42f
Follow up at 18, 6 and 3 months 2/3 patients Gr2 acute GU (RTOG) 1/3 patients Gr1 acute GI
All symptoms resolved at 3 months Fonteyne
(2008) [67] n=230 overall n=118 had SIB ADT 98%
L/I/H: 2/40/58%
1.5T MRI with ERC T2W, MRS (in 49%) MR and CT fusion
Step and shoot IMRT with daily ultrasound verification
Prostate + 4mm dose 78Gy/38f IPL + 8mm dose 80Gy/38f
Median follow up 12 months
No increase in acute toxicity with SIB (RTOG)
Miralbell
(2010) [27] n=50 ADT 66%
L/I/H: 10/24/66%
MRI with ERC T2W and DCE
MR and CT fusion (endorectal balloon used for planning CT)
Sequential hypofractionated boost, infrared markers. Prostate dose 64-64.4Gy
28/50 patients 50.4Gy/28f to pelvic nodes 21/50 patients 2f of 5-7Gy boost
29/50 patients received 2f of 8Gy boost
Late (at 5 years): (RTOG) GI- 10% Gr2, 10% Gr3 GU- 12% Gr2, 0% Gr3
Ippolito
(2012) [68] n=40 ADT 100%
L/I/H: 10/42/48%
1.5T MRI with ERC Step and shoot IMRT with SIB Prostate + 10mm 72Gy/40f IPL + 5mm 80Gy/40f
Median follow up 19 months Late: (RTOG/EORTC) GI- 5% Gr2, 2.5% Gr3 GU- 5% Gr2, 2.5% Gr4 Aluwini (2013)
[69] n=50 (n=14 had SIB) ADT 0% L/I/H: 60/40/0%
1.5T MRI (no ERC) T2W
MR and CT fusion using fiducials and foley catheter
SBRT
SIB in patients with visible tumour Prostate + 3mm 38Gy/4f (daily) IPL up to 44Gy/4f (daily)
Late (at 24 months): (RTOG/EORTC) GI- 3% Gr2 GI, 0% Gr3
GU- 10% Gr2 GU, 6% Gr3 GU No difference in toxicity with SIB Pinkawa
(2012) [70, 71] n=67 (n=46 had SIB)ADT 17% L/I/H: not specified
18F-Choline PET-CT IPL defined by tumour to background ratio of >2.0
Prostate + 4-8mm 76Gy/38f IPL + 4mm (3mm post) 80Gy/38f Verification with daily ultrasound
Median follow up 19 months
No significant difference in QoL with addition of SIB
Wong (2011)
[23] n=71 overall n=51 scans positive ADT 24%
L/I/H: 44/42/14%
Indium-111-capromab pendetide imaging
Co-registration with planning scan
Step and shoot IMRT
Verification with daily ultrasound Prostate + 6mm 75.6Gy/42f
IPL + 0mm 82Gy/42f
Median follow up 66 months Late: (Mayo modification of RTOG) GI- 21% Gr2, 0% Gr3
Integration of imaging
Optimal boost delineation requires imaging to be carefully integrated into the planning process [65, 72]. At present, a radiotherapy planning CT provides the electron density data required for dose calculation and hence any additional boost imaging needs to be precisely co-registered with the planning CT to allow fidelity of the boost volume transcription. Even if imaging were to have 100% accuracy, if it is not precisely co-registered into the radiotherapy planning pathway, the IPL will not be faithfully represented.
At present, the optimal method for incorporating the information from MRI, is to ‘fuse’ the CT and MRI dataset. Although this process can be performed manually, software provides deformation algorithms to aid this complicated process, these programmes differ in the steps used to match the images and the degree of flexibility. Given the variability in rectal and bladder volumes and movement of the prostate, as expected, deformable image registration (DIR) is more accurate than rigid techniques [73]. Image registration can introduce a systematic anatomical error although the presence of gold seeds improves this process [72, 74]. Additional complications include MRI artefacts, limitations with the geometric fidelity of MRI and the distortion of the prostate seen when an ERC is used, all of which make accurate delineation of an IPL challenging. The discrepancy introduced by these MRI factors should be limited where possible, for example an endorectal balloon (ERB) can be used for the planning scan and throughout treatment to compensate for the ERC [63] but may not be practical.
The ease of image registration is also dependent on whether the patient was scanned in the radiotherapy treatment position for the secondary image set (in this case MRI) with identical immobilisation including knee wedges, foot stocks and with the same bladder filling protocol and rectal preparation.
If fusion is not possible, images are reviewed side by side to delineate the boost area, known as ‘visual cognitive fusion’. This will add a further uncertainty to this process although this manual transfer method has been used in planning studies [19, 64].
Implementation of tumour dose-escalation
Although the studies detailed here confirm the feasibility of delivering focal dose- escalation, with the potential for increased tumour control with decreased NTCP, additional information is needed. Prospective clinical trials such as the Phase III randomised controlled trial FLAME [75], HEIGHT (clinicaltrials.gov NCT01411332) and the Phase II DELINEATE (UKCRN ID 10309)and SPARC trials (clinical trials.govNCT02145494)will provide the vital information on clinical outcome, toxicity and feasibility of boosting to decide whether focal dose escalation should become standard practice.
PET-CT IMAGING
Acquisition of Images
PET-CT is a form of molecular imaging, requiring injection of a radio-labelled tracer which accumulates based on tissue characteristics. For prostate cancer, differences in choline metabolism have been most frequently exploited for PET imaging. In particular, research has focused on [11C] and [18F] labelled choline
derivatives, taking advantage of the increased turnover of choline in prostate cancer, which is required for phospholipids in the cell membrane. Although 11
C-Choline PET-CT has the advantage of non-urinary excretion, it has a short half life (20 minutes) and requires an onsite cyclotron, which limits it usage. 11C-acetate
has also been explored, however seems less favourable [76]. There are further investigations into other radiotracers including those targeting prostate-specific membrane antigen (PSMA), the synthetic amino acid analogue anti-1-amino-3-F18-fluorocyclobutane-1-carboxylic acid (FACBC) and
F-18-fluoro-5α-dihydrotestosterone (FDHT) which targets the androgen receptor.
PET imaging is not routinely obtained for patients being treated for prostate cancer, although is increasingly used to enhance staging in locally advanced or relapsed disease.
Limitations and Challenges of PET-CT
There have been several studies assessing the role of PET-CT in defining IPLs in prostate cancer, the majority of these use 11C- or 18F-Choline [77-81]. For
example, a study with 11C-Choline PET-CT showed a sensitivity of 66% and
specificity of 81% [77]. However, the uptake of lesions can be variable and the studies are limited by conflicting results and small sample sizes. As a result, there continue to be concerns over the use of PET-CT in radiotherapy planning [82]. As with MRI, false positives can be seen with prostatitis and inflammation secondary to biopsy or treatment [77]. Van den Bergh et al reported that when multiparametric MRI is used, there is no additional benefit of PET-CT
[83], with the accuracy of detecting lesions dependent on the SUV used.
Image interpretation
including inhomogeneity within an IPL, lesion size and motion artefact [84]. Using an absolute SUV value to define the target volume does not take into account the variable background activity of the prostate. Therefore, the two main threshold methods are using a tumour-to-background ratio or percentage of the maximum SUV (SUVmax). Values have been derived from histopathological
studies and are discussed further below.
Spatial resolution
PET-CT has limited spatial resolution, being unable to detect lesions smaller than 5mm. The SUVmax of smaller tumours is less than that of larger ones [81]. The
partial-volume effect (PVE) leads to smaller lesions either being lost or appearing larger (and therefore encompassing normal tissues) but dimmer [85].
Histopathological correlation of delineation using PET-CT
Variability of studies
The accuracy of IPL delineation using PET-CT has been assessed by studies using histopathological correlation. Sensitivity and specificity can vary significantly depending on whether studies use voxel, segments or whole prostate level of analysis as the area of interest. Studies also vary depending on the patient population, the standardised uptake value (SUV) threshold used and the acquisition of images. As noted earlier, there are limitations of these histopathological studies, which must be considered when interpreting results. Amongst the issues to be considered are the accuracy and type of pathology (biopsy or whole mount specimens), the optimal timing of the imaging following tracer injection, and the most appropriate segmentation or thresholding level for defining the IPL.
Timing of PET Imaging
Kwee et al analysed the change in maximum SUV (SUVmax) in malignant and
benign areas in prostate cancer using additional delayed scanning at one hour [78]. SUVmax for malignant areas increased from the initial to delayed scan
whereas the mean SUVmax for benign areas decreased. The difference between
areas marked as ‘dominant malignant’ and ‘probably benign’ was only statistically significant on delayed imaging with the mean malignant-to-benign ratio increasing from 1.4 on the initial images to 1.8 on the delayed images. The additional challenge of using delayed imaging with this modality however, is that
18F-Choline is renally excreted with accumulation of radioactivity within the
bladder, which can complicate image interpretation of the prostate base.
Methods for IPL delineation
A mean tumour-to-background ratio of approximately 2 has been identified in several studies as a method for IPL delineation [77, 78, 81] and was used by Pinkawa et al for delineation of a clinically delivered boost volume [70]. In this study, definition of the IPL was based on a slightly increased tumour to background ratio of >2 in order to increase specificity, although this would lead to a decreased sensitivity with smaller tumours excluded.
An autocontour method based on 60% of the maximum SUV (SUV60) has been
[79, 80, 86]. However, in these studies, the SUV60 was not found to be
significantly better when compared to the other threshold contours [80, 86]. It is also unclear as to which correlation indices are best to compare contours and whether the dice similarity co-efficient (DSC) and Youden Index (YI) adequately assess the clinical significance of overlap. Therefore, although SUV60 had the
highest correlation indices (as per DSC and YI), this requires prospective clinical validation before implementation.
As the percentage of SUVmax threshold increases, specificity increases but
sensitivity decreases as used by Pinkawa et al to increase the specificity for dose-escalation [20].
Comparison of PET-CT with MRI for delineation accuracy
Chang et al [86] used reference contours defined from prostatectomy pathology in 21 patients to compare the accuracy of manual contours from 11C- Choline
PET-CT to manual contours using DW-MRI. They found that PET-CT had significantly better correlation to the reference contours compared to T2W/DW-MRI. A limitation of this study however, was that multiparametric sequences of DCE-MRI or MRS were not included, as per the Barentz recommendations [44] therefore the comparison did not include the optimal set of MR images. This group also found, as previously shown [79, 80], that the SUV60 had the best
correlation to the reference contours and in fact performed significantly better compared to manual delineation by a radiologist using the PET-CT.
Feasibility of Boost Delivery using specific tracers
There have been several studies investigating the feasibility of delivering a dose-escalated boost to the delineated IPL using various specific PET tracers. The clinical study by Pinkawa is outlined in Table 2, with planning studies summarised in Table 3.
REFERENCE PATIENTS IMAGING TECHNIQUES RADIOTHERAPY TREATMENT FINDINGS
Kuang (2015) [25] n=30 18F-Choline PET/CT
Boost defined by 60% and 70% of SUVmax threshold (labelled IDLSUV60%
and IDLSUV70% respectively)
VMAT Plan1:
Prostate + 3-6mm 79Gy/39f Plan 2:
Prostate + 3-6mm 79Gy/39f IDLSUV60% + 3-6mm 100Gy/39f
IDLSUV70% + 3-6mm 105Gy/39f
SIB feasible in all patients TCP significantly higher in boost plan
Slightly lower rectal NTCP in boost plan
Seppala (2009) [22] n=12 11C-Acetate PET/CT
Co-registration with planning scan SUV of 2.0 used for IPL delineation
Step and shoot IMRT Plan 1:
Prostate + 6mm 77.9Gy/41f Plan 2:
Prostate + 6mm 72.2Gy/41f IPL + 6mm 77.9Gy-90Gy/41f
TCP increased for all boost plans Average dose of 82.1Gy to IPL gave the highest probability of
uncomplicated control
Chang (2012) [21] n=8 11C-Choline PET/CT
Co-registration with planning scan Boost defined by 60% and 70% of SUVmax threshold (labelled SUV60% and
SUV70% respectively)
Step and shoot IMRT Plan 1 (standard):
Prostate + 6mm 78Gy/39f Plan 2 (boost plan): Prostate + 6mm 78Gy/39f IPL (SUV60%) + 6mm 84Gy/39f
IPL (SUV70%) + 6mm 90Gy/39f
Plan 3 (boost plan, de-escalation to prostate): Prostate + 6mm 72Gy/39f
IPL (SUV60%) + 6mm 84Gy/39f
IPL (SUV70%) + 6mm 90Gy/39f
SIB feasible in all patients TCP significantly higher for both boost plans compared to standard plan
11C- Choline PET-CT
Chang et al [21] generated IMRT plans for 8 patients using the contouring methods described above [80] to deliver two boost doses within a single plan. PLAN78-90 delivered 78Gy, 84Gy and 90Gy and PLAN72-90 delivered 72Gy, 84Gy
and 90Gy to the whole prostate, SUV60% and SUV70% respectively. All plans were
feasible whilst meeting dose constraints, with the rectal NTCP being non-significantly lower in the boost plan. Both boost plans had a non-significantly higher TCP for the PET defined volume (TCPPET) and the prostatectomy specimen
defined volume (TCPpath) compared to the standard plan where 78Gy was
planned to the whole prostate alone. However, the risk of de-escalating the non-DIL prostate was demonstrated for one of the patients where the TCPpath was
lower in the PLAN72-90 boost plan compared to PLAN78. Overall, using the
histopathology from prostatectomy, they were able to demonstrate increased population TCP with this method. .
18F-choline PET-CT
Kuang et al concluded 18F-choline PET-CT can be used to localise a boost volume
for VMAT plans [25]. Using a similar method to Chang, radiotherapy plans had a two dose level boost of 105Gy defined using the 70% of the SUVmax threshold
(labelled IDLSUV70%)‘nested’ inside a larger boost of 100Gy defined by 60% of the
SUVmax (labelled IDLSUV60%) with the aim of delivering the higher dose to the area
of greater tumour specificity, whilst maintaining a dose of 79 Gy to the whole gland. They reported a higher TCP and a slightly lower rectal NTCP with the addition of a boost compared to a plan delivering 79Gy alone to the prostate.
11C-acetate PET-CT
11C-acetate PET-CT was used by Seppala et al to define the IPL using an absolute
SUV of 2.0 in a planning study of 12 patients [22]. They similarly confirmed an improved TCP with IMRT plans delivering a SIB up to 90Gy, without increasing the NTCP. However, a meta-analysis has concluded that 11C-acetate should not be
used for IPL localisation due to poor sensitivity and specificity [76].
Just as for MRI planning, the higher TCP seen with dose-escalation to the IPL is on the assumption that the imaging perfectly defines the target. Dose modelling has demonstrated that any additional benefit in TCP due to a SIB will be dependent on the sensitivity of imaging [87].
Integration of Imaging
With combined PET-CT images, the process of image registration is simpler compared to that needed for CT-MRI fusion. However, the PET imaging component is acquired in several phases so there will still be some discrepancy with bladder and bowel filling and prostate position. PET-CT images are obtained without the distortion from ERC discussed previously and can be used in patients with contraindication to MRI.
The importance of accurate delivery with IGRT has already been discussed. The optimal technique for tumour segmentation and delineation with PET-CT is not yet clear. Further investigation and validation of proposed methods such as tumour to background and SUV60 is required with rigorous histopathological
assessments and robust follow up of outcomes. An expansion margin may be additionally required to cover the IPL adequately, similar to those described above for MRI [60-62].
OTHER IMAGING
An Indium-111-capromab pendetide scan (ProstaScint) uses an FDA-approved monoclonal antibody to target upregulated prostate-specific membrane antigen (PSMA) receptors on prostate cancer cells. This tracer shows much promise in both the staging of de novo prostate cancer and in detecting recurrent disease. It has been used in a prospective trial to localise an IMRT planned boost (see Table 2) [23]. Results including biochemical control and toxicity were reported as favourable but further studies are needed to confirm the accuracy of localisation. The study used a prostate/muscle ratio of signal intensity 3:1, but similar to the choline studies, the optimal threshold for contouring would need further investigation. There are conflicting results on the reliability of localising prostate cancer [88, 89] however research continues into other agents that target PSMA.
FUTURE PERSPECTIVE
Combining imaging modalities
A combination of imaging may be helpful, which would optimally use one modality with high sensitivity and a second with high specificity. Imaging techniques are constantly evolving and refinements in MR or PET technique may increase our confidence in IPL delineation. Combining several modalities may further increase the fidelity of our contouring.
Patient stratification
In addition, imaging patients during a radiotherapy course for an early response assessment may predict those likely to fail biochemically, identifying patients who would benefit from further dose-escalation. This escalation could then be given using adaptive radiotherapy to the existing plan or as a hypofractionated boost at the end of treatment. Further research is ongoing to search for such imaging biomarkers.
Differential Dose
Rather than having a single dose to the entire IPL, several planning studies discussed here have demonstrated how more than one boost dose can be delivered to the IPL using PET-CT [21, 25]. This can maintain the maximum dose within the area of higher specificity, whilst having a fall off for the dose closer to organs at risk. The same approach could be used with mpMRI, based on guidelines for the interpretation of MR imaging [44] or validated models which predict tumour presence [52]. This model by Groenendaal et al for example suggests three levels; a GTV, a high-risk CTV and low-risk CTV (i.e. standard prostate dose) based on high, intermediate and low tumour probability respectively. Alternatively a multiple dose level approach could be considered when imaging is used to identify a sub-volume of more aggressive or radio-resistant disease within the IPL.
MRI workflow
MR currently is the preferred modality for boost delineation. As there are some limitations of image registration with CT, an MRI only workflow would eliminate this systemic error. Planning using MRI images alone has its own challenges, including the lack of electron density information required for dose calculations and distortion, however there are several methods described and being developed for this such as ‘pseudo’ or ‘synthetic’ CT [91, 92].
IGRT improves accuracy of radiotherapy delivery, but most commonly used methods, such as CBCT and gold seeds do not take into account intra-fraction movement, which contributes to the margin to be added and impacts the therapeutic ratio. Imaging during treatment further improves the accuracy of treatment, allowing gating or adaptation. Development of combinations of a linear accelerator or cobalt machine with on board MRI imaging [93, 94] may further improve inter- and intra-fraction imaging.Furthermore, acquisition of MR images during treatment may mean the boost regions could be directly visualised during beam delivery, increasing accuracy, calculation of delivered dose and facilitating adaptive planning strategies.
What is the objective of imaging a dominant lesion?
with intermediate or high risk disease, a boost to the IPL may increase TCP with little or no effect on toxicity. In this case, the optimal imaging modality may not need to be sensitive to low risk Gleason 6 disease, which will be adequately treated with conventional dose. A deficit of the current literature is the lack of understanding of the correlation between imaging findings with high risk pathology only. In addition, mpMRI and PET imaging have not been robustly compared, to help determine the optimal imaging modality for IPL delineation.
If the identification of the IPL is a prelude to de-escalating or even not treating the rest of the prostate gland, then there is still some way to go before we can be confident that our chosen imaging modality identifies all intra-prostatic disease or indeed that which requires treatment.
CONCLUSION
Dose-escalation to an MRI or PET-CT defined IPL is theoretically feasible, but further studies are needed to confirm the optimal imaging techniques which will faithfully represent the IPL in the radiotherapy planning process. Early clinical data suggest acceptable toxicity when DIL boosts are delivered with sophisticated radiotherapy techniques and state-of-the-art IGRT. Prospective clinical data is required to confirm which patient groups would benefit and to quantify any improvement in the therapeutic index.
EXECUTIVE SUMMARY
Rationale behind intraprostatic boost
Dose-escalation to the whole prostate improves biochemical control but at the expense of increased toxicity
Local recurrence occurs at the site of the primary tumour, therefore a boost to the IPL may improve the therapeutic ratio
MRI for IPL delineation
Although mp-MRI improves the accuracy of tumour detection, there are a number of limitations including a mismatch between different MRI techniques, false positive findings and the effect of ADT on imaging
The interpretation of MR images is operator and training dependent and prone to interobserver variation, even in the presence of published scoring systems
Histopathological correlation studies indicate that IPL volumes delineated by MRI tend to underestimate the true tumour volume, with studies suggesting a margin of 5-9mm to cover the ‘undercall’
Clinical and planning studies have shown that a boost to an IPL is feasible, with acceptable levels of toxicity and the potential to improve the TCP
The IPL must be accurately transferred through the radiotherapy planning process by using the fusion of images, and treatment must be delivered using high quality IGRT
PET-CT for IPL delineation
Image interpretation is variable; IPL delineation can be manual or automated, with methods used to define the IPL based on a percentage of the SUVmax or a tumour to background ratio
The limited clinical and planning studies indicate that a boost is feasible to a PET-CT defined IPL, with the possibility of using differing SUV thresholds to varying dose levels
The IPL must be faithfully represented throughout the planning process and treatment delivered accurately with IGRT
Future Perspectives
Data is needed from prospective trials to confirm the benefits of delivering a boost to the IPL and to confirm the best imaging, contouring methods, boost dose and radiotherapy techniques
A combination of imaging, pathology and biomarkers could be used to stratify patients and individualise treatment to identify those patients who will benefit from focal dose-escalation
ACKNOWLEDGEMENTS/ FINANCIAL DISCLOSURE
With thanks to Professor David Dearnaley and Dr Nicholas van As for kindly providing images from the DELINEATE and SPARC studies.
The Royal Marsden Hospital and the Institute for Cancer Research work in partnership as a National Institute for Health Research (UK) Biomedical Research Centre. We gratefully acknowledge their support.
The authors report no conflict of interest.
REFERENCES
1. Pollack A, Zagars GK, Starkschall G et al. Prostate cancer radiation dose response: results of the M. D. Anderson phase III randomized trial.Int. J.
Radiat. Oncol. Biol. Phys. 53(5), 1097-1105 (2002).
2. Peeters STH, Heemsbergen WD, Koper PCM et al. Dose-Response in Radiotherapy for Localized Prostate Cancer: Results of the Dutch
Multicenter Randomized Phase III Trial Comparing 68 Gy of Radiotherapy With 78 Gy.J. Clin. Oncol. 24(13), 1990-1996 (2006).
3. Viani GA, Stefano EJ, Afonso SL. Higher-Than-Conventional Radiation Doses in Localized Prostate Cancer Treatment: A Meta-analysis of
Randomized, Controlled Trials.Int. J. Radiat. Oncol. Biol. Phys. 74(5), 1405-1418.
4. Kuban DA, Tucker SL, Dong L et al. Long-Term Results of the M. D. Anderson Randomized Dose-Escalation Trial for Prostate Cancer.Int. J.
Radiat. Oncol. Biol. Phys. 70(1), 67-74.
5. Zietman AL, Desilvio ML, Slater JD et al. Comparison of conventional-dose vs high-dose conformal radiation therapy in clinically localized
adenocarcinoma of the prostate: A randomized controlled trial.JAMA
294(10), 1233-1239 (2005).
MRC RT01 randomised controlled trial.Lancet Oncol. 15(4), 464-473 (2014).
*long-term follow up confirming the benefit of dose escalation 7. Peeters ST, Heemsbergen WD, Van Putten WL et al. Acute and late
complications after radiotherapy for prostate cancer: results of a multicenter randomized trial comparing 68 Gy to 78 Gy.Int. J. Radiat.
Oncol. Biol. Phys. 61(4), 1019-1034 (2005).
8. Cellini N, Morganti AG, Mattiucci GC et al. Analysis of intraprostatic failures in patients treated with hormonal therapy and radiotherapy: implications for conformal therapy planning.Int. J. Radiat. Oncol. Biol.
Phys. 53(3), 595-599 (2002).
9. Pucar D, Hricak H, Shukla-Dave A et al. Clinically Significant Prostate Cancer Local Recurrence After Radiation Therapy Occurs at the Site of Primary Tumor: Magnetic Resonance Imaging and Step-Section Pathology Evidence.Int. J. Radiat. Oncol. Biol. Phys. 69(1), 62-69 (2007).
10. Arrayeh E, Westphalen AC, Kurhanewicz J et al. Does local recurrence of prostate cancer after radiation therapy occur at the site of primary tumor? Results of a longitudinal MRI and MRSI study.Int. J. Radiat. Oncol.
Biol. Phys. 82(5), e787-e793 (2012).
11. Kuban DA, Levy LB, Cheung MR et al. Long-Term Failure Patterns and Survival in a Randomized Dose-Escalation Trial for Prostate Cancer. Who Dies of Disease? Int. J. Radiat. Oncol. Biol. Phys. 79(5), 1310-1317 (2011). 12. Nutting CM, Corbishley CM, Sanchez-Nieto B, Cosgrove VP, Webb S,
Dearnaley DP. Potential improvements in the therapeutic ratio of prostate cancer irradiation: dose escalation of pathologically identified tumour nodules using intensity modulated radiotherapy.Br. J. Radiol. 75(890), 151-161 (2002).
*early planning study showing an improved therapeutic ratio with intraprostatic boost
13. Villers A, Mcneal JE, Freiha FS, Stamey TA. Multiple cancers in the
prostate. Morphologic features of clinically recognized versus incidental tumors.Cancer. 70(9), 2313-2318 (1992).
14. Singh AK, Guion P, Sears-Crouse N et al. Simultaneous integrated boost of biopsy proven, MRI defined dominant intra-prostatic lesions to 95 Gray with IMRT: early results of a phase I NCI study.Radiat. Oncol. 2, 36-36 (2007).
15. Noguchi M, Stamey TA, Mcneal JE, Nolley R. Prognostic Factors for Multifocal Prostate Cancer in Radical Prostatectomy Specimens: Lack of Significance of Secondary Cancers.J. Urol. 170(2, Part 1), 459-463 (2003). 16. Selvadurai ED, Singhera M, Thomas K et al. Medium-term Outcomes of
Active Surveillance for Localised Prostate Cancer.Eur. Urol. 64(6), 981-987 (2013).
17. Klotz L, Vesprini D, Sethukavalan P et al. Long-Term Follow-Up of a Large Active Surveillance Cohort of Patients With Prostate Cancer.J. Clin. Oncol.
33(3), 272-277 (2015).
19. Meerleer GD, Villeirs G, Bral S et al. The magnetic resonance detected intraprostatic lesion in prostate cancer: planning and delivery of intensity-modulated radiotherapy.Radiother. Oncol. 75(3), 325-333 (2005).
20. Pinkawa M, Attieh C, Piroth MD et al. Dose-escalation using intensity-modulated radiotherapy for prostate cancer – Evaluation of the dose distribution with and without 18F-choline PET-CT detected simultaneous integrated boost.Radiother. Oncol. 93(2), 213-219 (2009).
21. Chang JH, Lim Joon D, Lee ST et al. Intensity Modulated Radiation Therapy Dose Painting for Localized Prostate Cancer Using 11C-choline Positron Emission Tomography Scans.Int. J. Radiat. Oncol. Biol. Phys. 83(5), e691-e696 (2012).
22. Seppälä J, Seppänen M, Arponen E, Lindholm P, Minn H. Carbon-11 acetate PET/CT based dose escalated IMRT in prostate cancer.Radiother. Oncol.
93(2), 234-240 (2009).
23. Wong WW, Schild SE, Vora SA et al. Image-Guided Radiotherapy for Prostate Cancer: A Prospective Trial of Concomitant Boost Using Indium-111–Capromab Pendetide (ProstaScint) Imaging.Int. J. Radiat. Oncol. Biol.
Phys. 81(4), e423-e429 (2011).
24. Ost P, Speleers B, De Meerleer G et al. Volumetric Arc Therapy and Intensity-Modulated Radiotherapy for Primary Prostate Radiotherapy With Simultaneous Integrated Boost to Intraprostatic Lesion With 6 and 18 MV: A Planning Comparison Study.Int. J. Radiat. Oncol. Biol. Phys.
79(3), 920-926 (2011).
25. Kuang Y, Wu L, Hirata E, Miyazaki K, Sato M, Kwee SA. Volumetric Modulated Arc Therapy Planning for Primary Prostate Cancer With Selective Intraprostatic Boost Determined by 18F-Choline PET/CT.Int. J.
Radiat. Oncol. Biol. Phys. 91(5), 1017-1025 (2015).
26. Murray LJ, Lilley J, Thompson CM et al. Prostate Stereotactic Ablative Radiation Therapy Using Volumetric Modulated Arc Therapy to Dominant Intraprostatic Lesions.Int. J. Radiat. Oncol. Biol. Phys. 89(2), 406-415 (2014).
27. Miralbell R, Mollà M, Rouzaud M et al. Hypofractionated Boost to the Dominant Tumor Region With Intensity Modulated Stereotactic Radiotherapy for Prostate Cancer: A Sequential Dose Escalation Pilot Study.Int. J. Radiat. Oncol. Biol. Phys. 78(1), 50-57 (2010).
*Study demonstrating feasibility of IPL boost with 5 year follow up and disease free survival
28. Tree A, Jones C, Sohaib A, Khoo V, Van As N. Prostate stereotactic body radiotherapy with simultaneous integrated boost: which is the best planning method? Radiat. Oncol. 8 228-228 (2013).
29. Dearnaley D, Syndikus I, Mossop H et al. Comparison of hypofractionated high-dose intensity modulated radiotherapy schedules for prostate cancer: Results from the Phase III randomized CHHiP Trial
(CRUK/06/016). J. Clin. Onc. 34, suppl 2S;abstr 2 (2016).
31. Villeirs GM, Vaerenbergh K, Vakaet L et al. Interobserver Delineation Variation Using CT versus Combined CT + MRI in Intensity–Modulated Radiotherapy for Prostate Cancer.Strahlenther. Onkol. 181(7), 424-430 (2005).
32. Debois M, Oyen R, Maes F et al. The contribution of magnetic resonance imaging to the three-dimensional treatment planning of localized prostate cancer.Int. J. Radiat. Oncol. Biol. Phys. 45(4), 857-865 (1999).
33. Rasch C, Barillot I, Remeijer P, Touw A, Van Herk M, Lebesque JV. Definition of the prostate in CT and MRI: a multi-observer study.Int. J.
Radiat. Oncol. Biol. Phys. 43(1), 57-66 (1999).
34. Fütterer JJ, Heijmink SWTPJ, Scheenen TWJ et al. Prostate Cancer Localization with Dynamic Contrast-enhanced MR Imaging and Proton MR Spectroscopic Imaging.Radiology. 241(2), 449-458 (2006).
35. Haider MA, Van Der Kwast TH, Tanguay J et al. Combined T2-Weighted and Diffusion-Weighted MRI for Localization of Prostate Cancer.AJRAm. J.
Roentgenol. 189(2), 323-328 (2007).
36. Scheidler J, Hricak H, Vigneron DB et al. Prostate Cancer: Localization with Three-dimensional Proton MR Spectroscopic Imaging—Clinicopathologic Study.Radiology. 213(2), 473-480 (1999).
37. Isebaert S, Van Den Bergh L, Haustermans K et al. Multiparametric MRI for prostate cancer localization in correlation to whole-mount
histopathology.J. Magn. Reson. Imaging. 37(6), 1392-1401 (2013). 38. Wu L-M, Xu J-R, Ye Y-Q, Lu Q, Hu J-N. The Clinical Value of
Diffusion-Weighted Imaging in Combination With T2-Diffusion-Weighted Imaging in
Diagnosing Prostate Carcinoma: A Systematic Review and Meta-Analysis.
AJRAm. J. Roentgenol 199(1), 103-110 (2012).
39. Turkbey B, Pinto PA, Mani H et al. Prostate Cancer: Value of
Multiparametric MR Imaging at 3 T for Detection—Histopathologifc Correlation.Radiology. 255(1), 89-99 (2010).
40. Desouza NM, Riches SF, Van As NJ et al. Diffusion-weighted magnetic resonance imaging: a potential non-invasive marker of tumour
aggressiveness in localized prostate cancer.Clin. Radiol. 63(7), 774-782 (2008).
41. Henderson DR, De Souza NM, Thomas K et al. Nine-year Follow-up for a Study of Diffusion-weighted Magnetic Resonance Imaging in a Prospective Prostate Cancer Active Surveillance Cohort.Eur. Urol.
doi:10.1016/j.eururo.2015.10.010 (2016).
42. De Rooij M, Hamoen EHJ, Fütterer JJ, Barentsz JO, Rovers MM. Accuracy of Multiparametric MRI for Prostate Cancer Detection: A Meta-Analysis.AJR
Am. J. Roentgenol. 202(2), 343-351 (2014).
43. Riches SF, Payne GS, Morgan VA et al. MRI in the detection of prostate cancer: combined apparent diffusion coefficient, metabolite ratio, and vascular parameters.AJR Am. J. Roentgenol. 193(6), 1583-1591 (2009). 44. Barentsz JO, Richenberg J, Clements R et al. ESUR prostate MR guidelines
2012.Eur. Radiol. 22(4), 746-757 (2012).
*Guidelines discussing the mp-MRI sequences required and scoring techniques
endorectal–pelvic phased-array coils.Eur. Radiol. 17(4), 1055-1065 (2006).
46. Coakley FV, Kurhanewicz J, Lu Y et al. Prostate Cancer Tumor Volume: Measurement with Endorectal MR and MR Spectroscopic Imaging.
Radiology. 223(1), 91-97 (2002).
47. Rosenkrantz AB, Mendrinos S, Babb JS, Taneja SS. Prostate Cancer Foci Detected on Multiparametric Magnetic Resonance Imaging are
Histologically Distinct From Those Not Detected.J. Urol. 187(6), 2032-2038 (2012).
48. Langer DL, Kwast THVD, Evans AJ et al. Intermixed Normal Tissue within Prostate Cancer: Effect on MR Imaging Measurements of Apparent
Diffusion Coefficient and T2—Sparse versus Dense Cancers.Radiology.
249(3), 900-908 (2008).
49. Steenbergen P, Haustermans K, Lerut E et al. Prostate tumor delineation using multiparametric magnetic resonance imaging: Inter-observer variability and pathology validation.Radiother. Oncol. 115(2), 186-190 (2015).
50. Weinreb JC, Barentsz JO, Choyke PL et al. PI-RADS Prostate Imaging – Reporting and Data System: 2015, Version 2.Eur. Urol. 69(1), 16-40 (2016).
51. Groenendaal G, Van Den Berg CaT, Korporaal JG et al. Simultaneous MRI diffusion and perfusion imaging for tumor delineation in prostate cancer patients.Radiother. Oncol. 95(2), 185-190 (2010).
52. Groenendaal G, Borren A, Moman MR et al. Pathologic Validation of a Model Based on Diffusion-Weighted Imaging and Dynamic Contrast-Enhanced Magnetic Resonance Imaging for Tumor Delineation in the Prostate Peripheral Zone.Int. J. Radiat. Oncol. Biol. Phys. 82(3), e537-e544 (2012).
*Statistical voxel-based model for prediction of tumour
53. Viswanath SE, Bloch NB, Chappelow JC et al. Central Gland and Peripheral Zone Prostate Tumors have Significantly Different Quantitative Imaging Signatures on 3 Tesla Endorectal, In Vivo T2-Weighted Magnetic
Resonance Imagery.J. Magn. Reson. Imaging. 36(1), 213-224 (2012). 54. Vos PC, Barentsz JO, Karssemeijer N, Huisman HJ. Automatic
computer-aided detection of prostate cancer based on multiparametric magnetic resonance image analysis.Phys. Med. Biol. 57(6), 1527 (2012).
55. Dinh CV, Steenbergen P, Ghobadi G et al. Magnetic resonance imaging for prostate cancer radiotherapy.Phys. Med. 32(3), 446-451 (2016).
56. Groenendaal G, Van Vulpen M, Pereboom SR et al. The effect of hormonal treatment on conspicuity of prostate cancer: Implications for focal boosting radiotherapy.Radiother. Oncol. 103(2), 233-238 (2012). 57. Turkbey B, Mani H, Shah V et al. Multiparametric 3T prostate magnetic
resonance imaging to detect cancer: histopathological correlation using prostatectomy specimens processed in customized magnetic resonance imaging based molds.J. Urol. 186(5), 1818-1824 (2011).
59. Le Nobin J, Orczyk C, Deng F-M et al. Prostate tumour volumes: evaluation of the agreement between magnetic resonance imaging and histology using novel co-registration software.BJU international 114(0), E105-E112 (2014).
60. Groenendaal G, Moman MR, Korporaal JG et al. Validation of functional imaging with pathology for tumor delineation in the prostate.Radiother.
Oncol. 94(2), 145-150 (2010).
*comparison of tumour delineation on MRI with histopathology findings 61. Anwar M, Westphalen AC, Jung AJ et al. Role of endorectal MR imaging
and MR spectroscopic imaging in defining treatable intraprostatic tumor foci in prostate cancer: Quantitative analysis of imaging contour
compared to whole-mount histopathology.Radiother. Oncol. 110(2), 303-308 (2014).
* study considering the discrepancy between MRI delineation and pathology and margins that could be used
62. Le Nobin J, Rosenkrantz AB, Villers A et al. Image Guided Focal Therapy of Magnetic Resonance Imaging Visible Prostate Cancer: Defining a
3-Dimensional Treatment Margin Based on Magnetic Resonance Imaging-Histology Co-Registration Analysis.J. Urol. 194(2), 364-370 (2015).
63. Van Lin ENJT, Fütterer JJ, Heijmink SWTPJ et al. IMRT boost dose planning on dominant intraprostatic lesions: Gold marker-based three-dimensional fusion of CT with dynamic contrast-enhanced and 1H-spectroscopic MRI.
Int. J. Radiat. Oncol. Biol. Phys. 65(1), 291-303 (2006).
64. Housri N, Ning H, Ondos J et al. Parameters favorable to intraprostatic radiation dose escalation in men with localised prostate cancer.Int. J.
Radiat. Oncol. Biol. Phys. 80(2), 614-620 (2011).
65. Riches SF, Payne GS, Desouza NM et al. Effect on therapeutic ratio of planning a boosted radiotherapy dose to the dominant intraprostatic tumour lesion within the prostate based on multifunctional MR parameters.Br. J. Radiol. 87(1037), 20130813 (2014).
66. Feng Y, Welsh D, Mcdonald K et al. Identifying the dominant prostate cancer focal lesion using image analysis and planning of a simultaneous integrated stereotactic boost.Acta Oncol. 54(9), 1543-1550 (2015). 67. Fonteyne V, Villeirs G, Speleers B et al. Intensity-Modulated Radiotherapy
as Primary Therapy for Prostate Cancer: Report on Acute Toxicity After Dose Escalation With Simultaneous Integrated Boost to Intraprostatic Lesion.Int. J. Radiat. Oncol. Biol. Phys. 72(3), 799-807 (2008).
68. Ippolito E, Mantini G, Morganti AG et al. Intensity-modulated radiotherapy with simultaneous integrated boost to dominant intraprostatic lesion: preliminary report on toxicity.Am. J Clin. Oncol. 35(2), 158-162 (2012). 69. Aluwini S, Van Rooij P, Hoogeman M, Kirkels W, Kolkman-Deurloo I-K,
Bangma C. Stereotactic body radiotherapy with a focal boost to the MRI-visible tumor as monotherapy for low- and intermediate-risk prostate cancer: early results.Radiat. Oncol. 8 84-84 (2013).
71. Pinkawa M, Holy R, Piroth MD et al. Intensity-Modulated Radiotherapy for Prostate Cancer Implementing Molecular Imaging with 18F-Choline PET-CT to Define a Simultaneous Integrated Boost.Strahlenther. Onkol.
186(11), 600-606 (2010).
72. Huisman HJ, Fütterer JJ, Lin ENJTV et al. Prostate Cancer: Precision of Integrating Functional MR Imaging with Radiation Therapy Treatment by Using Fiducial Gold Markers.Radiology. 236(1), 311-317 (2005).
73. Thornqvist S, Petersen JB, Hoyer M, Bentzen LN, Muren LP. Propagation of target and organ at risk contours in radiotherapy of prostate cancer using deformable image registration.Acta Oncol. 49(7), 1023-1032 (2010). 74. Parker CC, Damyanovich A, Haycocks T, Haider M, Bayley A, Catton CN.
Magnetic resonance imaging in the radiation treatment planning of localized prostate cancer using intra-prostatic fiducial markers for computed tomography co-registration.Radiother. Oncol. 66(2), 217-224 (2003).
75. Lips IM, Van Der Heide UA, Haustermans K et al. Single blind randomized Phase III trial to investigate the benefit of a focal lesion ablative
microboost in prostate cancer (FLAME-trial): study protocol for a randomized controlled trial.Trials 12 255-255 (2011).
*trial protocol for a prospective study delivering an SIB
76. Mohsen B, Giorgio T, Rasoul ZS et al. Application of 11C-acetate positron-emission tomography (PET) imaging in prostate cancer: systematic review and meta-analysis of the literature.BJU International. 112(8), 1062-1072 (2013).
77. Farsad M, Schiavina R, Castellucci P et al. Detection and Localization of Prostate Cancer: Correlation of 11C-Choline PET/CT with Histopathologic Step-Section Analysis.J. Nucl. Med. 46(10), 1642-1649 (2005).
78. Kwee SA, Wei H, Sesterhenn I, Yun D, Coel MN. Localization of Primary Prostate Cancer with Dual-Phase 18F-Fluorocholine PET.J. Nucl. Med.
47(2), 262-269 (2006).
79. Park H, Meyer CR, Wood D et al. Validation of automatic target volume definition as demonstrated for (11)C-Choline PET/CT of human prostate cancer using multi-modality fusion techniques.Acad. Radiol. 17(5), 614-623 (2010).
80. Chang JH, Joon DL, Lee ST et al. Histopathological correlation of 11C-choline PET scans for target volume definition in radical prostate radiotherapy.Radiother. Oncol. 99(2), 187-192 (2011).
81. Reske SN, Blumstein NM, Neumaier B et al. Imaging Prostate Cancer with 11C-Choline PET/CT.J. Nucl. Med. 47(8), 1249-1254 (2006).
82. Picchio M, Giovannini E, Crivellaro C, Gianolli L, Muzio ND, Messa C. Clinical evidence on PET/CT for radiation therapy planning in prostate cancer.Radiother. Oncol. 96(3), 347-350 (2010).
83. Van Den Bergh L, Koole M, Isebaert S et al. Is There an Additional Value of 11C-Choline PET-CT to T2-weighted MRI Images in the Localization of Intraprostatic Tumor Nodules? Int. J. Radiat. Oncol. Biol. Phys. 83(5), 1486-1492 (2012).
84. Zaidi H, El Naqa I. PET-guided delineation of radiation therapy treatment volumes: a survey of image segmentation techniques.Eur. J. Nucl. Med.
85. Soret M, Bacharach SL, Buvat I. Partial-Volume Effect in PET Tumor Imaging.J. Nucl. Med. 48(6), 932-945 (2007).
86. Chang JH, Lim Joon D, Davis ID et al. Comparison of [11C]choline Positron Emission Tomography With T2- and Diffusion-Weighted Magnetic
Resonance Imaging for Delineating Malignant Intraprostatic Lesions.Int. J.
Radiat. Oncol. Biol. Phys. 92(2), 438-445 (2015).
87. Niyazi M, Bartenstein P, Belka C, Ganswindt U. Choline PET based dose-painting in prostate cancer - Modelling of dose effects.Radiat. Oncol. 5, 23-23 (2010).
88. Ellis RJ, Kim EY, Conant R et al. Radioimmunoguided imaging of prostate cancer foci with histopathological correlation.Int. J. Radiat. Oncol. Biol.
Phys. 49(5), 1281-1286 (2001).
89. Mouraviev V, Madden JF, Broadwater G et al. Use of 111In-Capromab Pendetide Immunoscintigraphy to Image Localized Prostate Cancer Foci Within the Prostate Gland.J. Urol. 182(3), 938-948 (2009).
90. Chopra S, Toi A, Taback N et al. Pathological Predictors for Site of Local Recurrence After Radiotherapy for Prostate Cancer.Int. J. Radiat. Oncol.
Biol. Phys. 82(3), e441-e448 (2012).
91. Jonsson JH, Karlsson MG, Karlsson M, Nyholm T. Treatment planning using MRI data: an analysis of the dose calculation accuracy for different treatment regions.Radiat. Oncol. 5 62-62 (2010).
92. Dowling JA, Lambert J, Parker J et al. An Atlas-Based Electron Density Mapping Method for Magnetic Resonance Imaging (MRI)-Alone
Treatment Planning and Adaptive MRI-Based Prostate Radiation Therapy.
Int. J. Radiat. Oncol. Biol. Phys. 83(1), e5-e11 (2012).
93. Lagendijk JJW, Raaymakers BW, Raaijmakers AJE et al. MRI/linac integration.Radiother. Oncol. 86(1), 25-29 (2008).