Effect Of Growth Lettuce Varieties With
Automation System Application Temperature And
Humidity Sensor Using Microcontroller Wemos
Yanuar Nurdiansyah, Yudha Alif Auliya, Muhammad Tajuddin
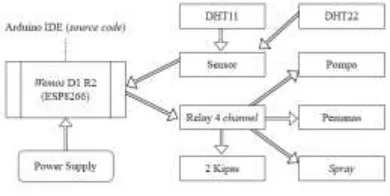
Abstract : Designing a temperature and humidity sensor automation system using a prototype model is a step in building a smaller scope (lab scale) refers to real conditions where further implementation (original scale) is easier to implement if it is based on a prototype system because in addition to combining the conditions of the design also produced several versions of the series according to the lab scale to be used. Us ing an Arduino type wemos microcontroller as the center of the system arrangement with various types of tools as optimizing the temperature and humidity needed by lettuce varieties, including DHT sensors for data collection (collect data) and used as a benchmark in determining the condition of the tool. Testing two DHT sensors calibrated with a digital multimeter with certain conditions to find the smallest error value. Sensors that generate value to thorough's highest on a predetermined condition to be used in the stage of the study the growth of lettuce varieties. Every data collected by sensors (collect data) is processed and sent to a website to be displayed periodically (real time) with the provisions of the connected Wi-Fi network. Furthermore, testing on the growth of lettuce varieties used two growing media, with treatment (automation system) and without treatment. Using 8 plant samples each of the planting media there were 4 plants, for 14 days the optimal growth was searched between the two planting media by comparing based on graphs of growth of lettuce varieties both in terms of height increase and width of leaves per day.
Keywords: system prototype, collect data, sensor performance, lettuce varieties
————————————————————
1.
INTODUCTION
Climate change is one of the causes of good or bad productivity in agriculture. The delay in the rainy season and the progress of the dry season can be based on climate change in Indonesia and cause the planting calendar to change (Ministry of Agriculture, 2015). Uncertain environmental factors, especially in terms of temperature and humidity can affect the growth and development of vegetables and fruits. Lettuce (Lactuca sativa L) vegetable varieties that contain lots of substances beneficial to human health (Grubben and Sukprakarn, 1994). The optimum temperature for lettuce growth at 25°C to 28°C (Darmawan, 1997) and humidity ranges from 80% to 90% (Krisna et al., 2017). Lettuce can also grow in cold and tropical regions, lettuce marketing increases along with economic growth and population (Cahyono, 2014). One effort to increase the production of lettuce sustainably is to use hydroponic technology. In regulating the temperature and humidity in a hydroponic home, problems often arise due to mismatch between the normal environmental conditions (temperature and humidity) of vegetable plants and the conditions in a hydroponic home, consequently having an impact on their growth and development. The worst conditions have an impact on disability to production failure. Besides, in some cases the performance of sensors (different sensors) there are also some differences or incompatibility to collect data on environmental conditions (temperature and humidity). Continuous monitoring and using several different sensors within a certain period is needed for this problem, which is certainly difficult for officers or farmers to continuously observe the environmental conditions for 24 hours (Royan, 2017). Reviewing the problems that occur, it is necessary to have a monitoring system control parameters based on a wireless sensor network environment, with managing huge data (collect data) whether it is organized or unorganized is a major challenging task for the organizations or individual. In these situations, there is a need for applications and
software‘s that are cost efficient with high computational power (Parimi, 2020).
This research will focus on designing a prototype system and adding a sensor performance calibration analysis using an automatic control system so that environmental conditions that affect growth can be collected and collected continuously (real time) using several sensors related to the data collect (temperature and humidity). The agriculture data (collect data) will be analyzed to optimize and modify of environment around and referred to as the growing media with treatment (Muangprathub, 2019). The system designed will use the concept of the Internet of Things that refers to conditions of temperature and humidity so that the data taken is matched with the native habitat of the plant (normal conditions using a special digital meter reference).
2.
DESIGN AND IMPLEMENTATION
Using the design stages of the prototype system aims to make the research carried out structured, including:
2.1.Prototype development
Efforts to improve the optimization of temperature and humidity, as shown in Figure 1 using 2 fans, sprayers, heaters, and pumps as supporting hydroponics.
Figure 1 final prototype version
and temperature (DHT) sensor includes a thermistor or NTC (Negative Temperature Coefficient) and a capacitive humidity sensor (Sunehra, 2020). Therefore, a plastic separator is needed between the sprayer and heater, so that plants under the sensor are exposed to water then it needs to be given a distance between net pot (pipe) with plastic separator. The location of the second fan in the upper right of the place of origin of the sprayer is shown in Figure 2, besides optimizing the temperature on both sides it also helps the direction of water from the sprayer.
Figure 2 design implementation of the final version
2.2.Arduino IDE programming
In addition to being relatively simple and easy to do programming, it is also because processing that uses C language can make it easier to learn and apply it (Agus Wirawan et al, 2017). The integration procedure between the tools used temperature and humidity automation based on collect data is carried out by the dht11 sensor, the next step is to make a connection between the device and the program on Arduino, as for the steps taken, namely:
1) Download the ESP8266 wi-fi library on the Arduino IDE
(application).
The ESP8266 wi-fi library functions as an intermediary between arduino (wemos) and PC. The library is already available in the Arduino IDE application but needs to be searched and downloaded, after completion the library is ready to use (dony, 2020).
2) Download DHT sensor library
Functioning as an intermediary between Arduino (wemos) with DHT sensors for temperature and humidity, without using this library dht11 cannot collect data.
3) Connect Arduino (wemos) with PC.
4) Using jack cable (male and female).
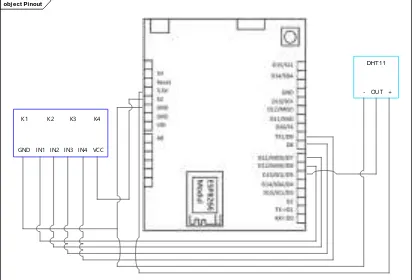
Connecting channel relay and DHT11 sensor with wemos, the series of pins that are used as shown in Figure 3. Wemos microcontroller with additional wi-fi in the middle, the left side is a 4 channel relay and the right side of the wemos is the DHT11 sensor.
Figure 3 design pin (port)
The dht11 sensor has three pins that will be connected to wemos, the negative symbol on the dht11 sensor is ground (GND), the positive symbol is for 3.3V voltage and the pin out to D5 is initialized in IDE programming. As for the relay requires a voltage of 5V and attached to the VCC, the next ground (GND) on the relay mounted ground (GND) at wemos. Successively pins D6 through D9 are connected with IN1 to IN4 with outputs K1 through K4 for the condition of the device.
5) Arduino program
Write the program code in Arduino IDE software based on the pin that has been installed, to initiate the system as shown in Figure 4. "In1" refers to a relay with output "k1" and so on up to "k4" for "in4”.
Figure 4 Initialization of pin (wemos and relays)
Figure 5 Initializing the output pin
After adjusting the pin position the next step is to initialize the temperature and humidity control device based on the output of the relay shown in Figure 5 and at the same time as a reference to the condition of the tool, on or off. The final step in this stage is to determine the temperature and humidity limits based on the literature study for the condition of the tool (figure 7), while the temperature and humidity initialization obtained from the dht11 sensor data collection can be seen in Figure 6.
Figure 6 Collect DHT11 sensor data (temperature and humidity)
Figure 7 Initialization of tool conditions based on collect data
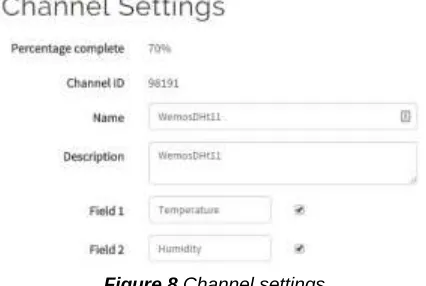
2.3.Showing collect data (thingspeak) obj ect Pinout
DHT11
K1 K2 K3 K4
GND IN1 IN2 IN3 IN4 VCC
The server from thingspeak website is a vital device and should be given more attention when it is active. In the server stored important data in the form of databases and web application documents and must active for a long time and doing a heavy process (Wijaya, 2019). The initial step is to create a new account on ThingsPeak. Then create a new channel and add two columns to display temperature and humidity data from the DHT11 (fields) sensor. Figure 8 shows the channel and column settings interface used (fields).
Figure 8 Channel settings
The program code written on the Arduino IDE which refers to Figure 8 is seen in Figure 9, "Apikey" is a key obtained from the thingsPeak website. The SSID name and password used must be correct so Arduino (wemos) can be connected to wi-fi to send data to the thingspeak server.
Figure 9 Server initialization
Furthermore, determining the position of the collected data will be displayed still referring to Figure 8, "t" as the temperature displayed in field1 and "h" as humidity displayed in field2 for the whole as in Figure 10.
Figure 10 Initializing the display to collect sensor data
3.
EVALUATION TEST RESULT
3.1.Sensor performance test
Sensor testing in this study uses 3 main tools to get the results that are close to the highest accuracy and the smallest error based on temperature and humidity collect data, while the tools used are Digital multimeter as a reference, dht11, and dht22 sensors. Before calibrating the sensor the first step is to make the program code on the Arduino IDE so that both sensors (dht11 and dht22) can collect data appropriately.
Figure 11 initialization of pin and sensor type
Pin D5 for sensor dht11 and D4 for dht22, shown in Figure 11. This is to avoid exchanging collect data. Furthermore, the initialization of the reading of the sensor value as shown in Figure 12, the output settings according to both sensors and the update period uses 10 seconds as shown in Figure 13.
Figure 12 Initialization retrieves data on the sensor
Figure 13 Initialisation of output and update interval
Figure 14 Results of the two sensor outputs
Tests on both sensors (dht11 and dht22) produced an average value based on both conditions of temperature and humidity. The dht11 sensor is still classified as a higher level of accuracy than the dht22 sensor in collecting data if calibrated with a digital multimeter calculated the error value obtained by the dht11 sensor is -0.93 for temperature conditions and -3.48 according to humidity conditions, while the dht22 sensor obtains an error value from temperature conditions reaching -1,0299 and -6.26 for humidity conditions.
3.2.Green Lettuce Growth Test
Tests and analysis of the planting media are carried out to find out how much impact is caused by the work of temperature and humidity control devices. Behavior is carried out under 2 conditions, namely with the controller (planting media A) and without the controller (media B) carried out for 14 days after transplanting the seeds in the planting media (HST). Based on the observational variables used, namely; plant height and width of lettuce leaves. Observations on plant height are used to measure the effect of the environment and treatment (dick temperature and humidity) which is applied while the observation of the leaves is based on its function as a light receiver and where the photosynthesis process takes place in green lettuce plants (Qurrotul Aini, 2010). Plant height can be calculated from the base of the stem to the tip of the longest leaf (Mas'ud, 2009), while the width of the leaf uses 2 samples calculated from the two outermost edges. Testing the growth of green lettuce plants using 4 samples, planting media categories A and B each amounted to 4 plants then the growth of the two is compared.
1. Growth in plant height
Based on Figure 15 the comparison of the growth of green lettuce in sample number one was seen to fluctuate between one another, but on the last day (14) the height of plant media B was higher even though it was only a few centimeters adrift.
Figure 15 Growth of green lettuce height in two treatments (plant one)
Lettuce in sample number two to four was seen dominated by planting media A although in sample number three and four the initial height of the plant was superior to planting media B a few centimeters, until the final measured value was still dominated by planting media A shown in figures 16, 17, 18.
Figure 16 Growth of green lettuce height in two treatments (plant two)
Figure 17 Growth of green lettuce height in two treatments (plant three)
Figure 18 Growth height of green lettuce in two treatments (plant four)
0 5 10
1 2 3 4 5 6 7 8 9 10 11 12 13 14
Ti
ng
gi
ta
na
m
an
(c
m
)
Waktu (hari)
Tinggi (A) Tinggi (B)
0 10 20
1 2 3 4 5 6 7 8 9 10 11 12 13 14
Ti
ng
gi
ta
na
m
an
(c
m
)
Waktu (hari)
Tinggi (A) Tinggi (B)
0 5 10
1 2 3 4 5 6 7 8 9 10 11 12 13 14
Ti
ng
gi
ta
na
m
an
(c
m
)
Waktu (hari)
Tinggi (A) Tinggi (B)
0 10 20
1 2 3 4 5 6 7 8 9 10 11 12 13 14
Ti
ng
gi
ta
na
m
an
(c
m
)
Waktu (hari)
2. Growth in the width of the first leaf
Every day the leaf width in the first sample experiences almost equal competition seen in Figure 19, although the initial value when the plant is transferred to the growing media is wider on the planting medium B the final value obtained for planting media A is wider by several centimeters.
Figure 19 Growth of green lettuce leaf width in two treatments (plant one)
Based on sample plants number two to four (figures 20, 21, 22) the measured final value is dominated by planting media A although some days fluctuate between the two growing media.
Figure 20 Growth of green lettuce leaf width in two treatments (plant two)
Figure 21 Growth of green lettuce width in two treatments (plant three)
Figure 22 Growth of green lettuce leaf width in two treatments (plant four)
3.
GROWTH IN THE WIDTH OF THE SECOND
LEAF
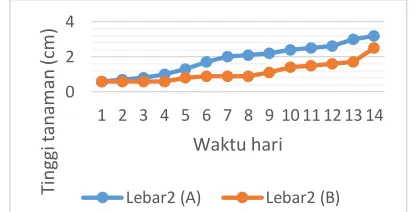
According to Figure 23, it is explained that leaf measurement at the beginning of the lettuce was moved to be seen wider on the planting medium B, counted from the 7th day to the 11th day the value resulting from the width of the lettuce leaves of the two media reached the same number. But for the final value (14 days) it looks wider on the B planting media.
Figure 23 Growth of leaf width in two treatments (plant one)
Figure 24 Growth of leaf width in two treatments (plant two)
Measurement of leaf width in the second plant was seen to get a balanced value for growth every day, but on the 11th day towards the 12th day, the width of the leaf in medium A followed by reaching a value of 2cm can be proven in Figure 24. Until the end of leaf measurement, media A remained wider than media B. According to figures 25 and 26 the value produced from each measurement day was dominated by leaf width in planting media A compared to planting media B until the last day (day 14).
0 5
1 2 3 4 5 6 7 8 9 1011121314
Ti ng gi ta na m an (c m ) Waktu (hari)
Lebar1 (A) Lebar1(B)
0 2 4
1 2 3 4 5 6 7 8 9 10 11 12 13 14
Ti ng gi ta na m an (c m ) Waktu (hari)
Lebar1 (A) Lebar1(B)
0 2 4
1 2 3 4 5 6 7 8 9 10 11 12 13 14
Ti ng gi ta na m an (c m ) Waktu (hari)
Lebar1 (A) Lebar1(B)
0 2 4
1 2 3 4 5 6 7 8 9 10 11 12 13 14
Ti ng gi ta na m an (c m ) Waktu (hari)
Lebar1 (A) Lebar1(B)
0 2 4
1 2 3 4 5 6 7 8 9 10 11 12 13 14
Ti ng gi ta na m an (c m ) Waktu hari
Lebar2 (A) Lebar2 (B)
0 2 4
1 2 3 4 5 6 7 8 9 10 11 12 13 14
Ti ng gi ta na m an (c m ) Waktu hari
Figure 25 Growth of leaf width in two treatments (plant three)
Figure 26 Growth of leaf width in two treatments (plant four)
After all measurements of height, leaf widths one and two have been made it can be said that the growing media A makes the plants grow faster. But seen in the resulting value for the comparison of measurements of the first plant, the untreated growing media grows faster than the height and width of the second leaf but does not apply to the width of the first leaf because planting media A is still wider. It also occurs in the second plant, the difference is only the planting media B is superior to the height of the lettuce plant. It can be said that different levels of shade (media) or by optimizing conditions can cause differences in light intensity, temperature, and humidity. The higher the shade level, the light intensity and temperature decrease while the humidity increases (Hakim et al, 2019).
4.
CONCLUSION
Based on the design (analysis and testing) carried out in the previous chapter, the conclusions that can be drawn from this study are as follows:
1. The dht11 sensor for temperature and humidity can be
used to collect data with the main provisions of the pin or port that is connected to the wemos as a microcontroller according to the initialization of the Arduino IDE program where errors often occur under these conditions. While website delivery results collect the data used in this study is very useful in remote monitoring and storage of recent data. Likewise, to find errors, whether or not the temperature and humidity control device is seen from the dht11 sensor data collected. The most important thing on the website (thingspeak) is the stability of the wi-fi network so that it can collect data in real time (conducive) without reducing the data from the sensors used.
2. Software and hardware-based design using a
prototype system are needed to adjust conditions and
circumstances that often change. Using a prototype system so that the design carried out provides a clear picture of the scope to be faced (actual scale).
3. Testing the performance of temperature and humidity
sensors (dht11 and dht22) calibrated with a digital multimeter produces the tool with the best accuracy, however, according to data obtained from the study literature with the results obtained from the sensor test research is inversely proportional. That is because the scope or condition (temperature and humidity) of the research makes the dht11 sensor produce a smaller error value, if using conditions (temperature and humidity) more extreme scale allows the dht22 sensor to be more accurate in collecting data.
4. Based on data obtained from the literature study as a
basis for determining the condition of the tool (temperature and humidity) or applied treatment (automation) can optimize plant growth both height and width of green lettuce. According to the green lettuce growth test for 14 days the planting media with treatment (A) dominated the growth in terms of height, the width of the first and second leaves but in some other aspects, the planting media without treatment (B) received a higher value. This happens because the placement of the humidity regulator (heater) only uses one position, namely in the middle of the lettuce plant, so it can be ascertained the outermost side (left or right) does not get the optimal humidity regulation.
5.
REFERENCES
[1] Agus Wirawan I Made dkk (2017). Sistem Pemantauan
Suhu Lab Jarak Jauh Berbasis Arduino.
SEMNASVOKTEK, Denpasar-Bali.
[2] Bahtera firmawan dony (2019). Implementasi Simple
Multi Attribute Rating Technique pada Sistem
Pemilihan Kelayakan Lahan Tanam Tembakau
Menggunakan Arduino. Universitas Jember, Jember.
[3] Cahyono, B. (2014). Teknik Budidaya Daya dan
Analisis Usaha Tani Selada. CV Aneka Ilmu. Semarang.
[4] Darmawan, I, A. (1997). Pengaruh Topoklimat terhadap
produksi dan Kualitas Selada (Lactuca sativa L.). Universitas Gadjah Mada, Yogyakarta.
[5] Grubben, G. J. H. and S. Sukprakarn. (1994). Lactuca
sativa L., p. 186-190. In J. S. Siemonsma and K. Piluek (Eds.). Plant Resourches of South-East Asia No 8 Vegetables. PROSEA. Bogor, Indonesia.
[6] Hakim M. A. R dkk (2019) Pertumbuhan dan Produksi
Dua Varietas Selada (Lactuca sativa L) pada Berbagai
Tingkat Naungan dengan Metode Hidroponik.
Universitas Diponegoro, J. Agro Complex 3(1):15-23.
[7] Krisna, B., E. T. S. Putra, R. Rogomulyo, D. Kastono.
(2017). Pengaruh pengayaan oksigen dan kalsium terhadap pertumbuhan akar dan hasil selada keriting (Lactuca sativa L.) pada hidroponik rakit apung. Jurnal Vegetalika, 6 (4): 14-27.
[8] Mas’ud hidayati (2009). Sistem hidroponik dengan
nutrisi dan media tanam berbeda terhadap
pertumbuhan dan hasil selada. Media litbang Sulteng 2(2): 131-136
[9] Muangprathub Jirapond et al (2019). IoT and
agriculture data analysis for smart farm. ScienceDirect, Computer and Electronics in Agriculture 156, 467-474 0
2 4
1 2 3 4 5 6 7 8 9 10 11 12 13 14
Ti ng gi ta na m an (c m ) Waktu hari
Lebar2 (A) Lebar2 (B)
0 2 4
1 2 3 4 5 6 7 8 9 10 11 12 13 14
Ti ng gi ta na m an (c m ) Waktu hari
[10]Parimi Sashikala, Chakraborty Samyadip (2020). Application of Big Data & Iot on Personalized Healthcare Services. International Journal of Scientific & Technology Research Vol.9, Issue 03
[11]Qurrotul Aini Rakhmi, dkk, (2010). Penerapan
Bionutrien KPD pada Tanaman Selada Keriting (Lactuca sativa var. crispa). Jurnal Sains dan Teknologi Kimia, Vol 1, No.1, Hal 73-79
[12]Royan Da’imul, dkk 2017. Analisis Performa Sistem
Pemantauan Suhu dan Kelembaban Berbasis Wireless Sensor Network. Universitas Brawijaya, Vol. 1, No 12.
[13]Sunehra Dhiraj, Siddireddygari Shreeya (2020). Patient
Health Monitoring System Using Arduino Mega 2560 and Thingsboard Server. International Journal of Scientific & Technology Research Vol.9, Issue 03
[14]Wijaya Rico et al (2019) Temperature and Humidity