IJSRR, 8(1) Jan. – Mar., 2019 Page 2358
Research article Available online www.ijsrr.org
ISSN: 2279–0543
International Journal of Scientific Research and Reviews
Identification of Hazardous Road Locations for Vulnerable Road Users
Using Kernel Density
Pankaj Prajapati
1and Bharati Lele
*2 1Civil Engineering Department, Faculty of Technology & Engineering, The M S University of Baroda, Vadodara Email: [email protected]
2
SJMSOM, Indian Institute of Technology Bombay Email: [email protected]
ABSTRACT
Compared to other road users, the vulnerable road users i.e. the pedestrians, bicyclists, and motorised two-wheeler riders are more prone to injury as they are not protected by vehicle shell. These road users tend to account for a much higher proportion of road traffic injury and deaths in the low income and the middle-income countries, than the high income countries. Kernel density maps are plotted and hazardous road intersections and midblock segments are presented. This paper discusses the pattern of hazardous road locations, land-use around such locations and other significant parameters for different cases. The paper discusses possible remedial measures to improve the safety after studying the role of associated spatial and non-spatial factors in traffic crashes. Most of the locations with high density of road accidents for all the three types of vulnerable road users are four-lane divided major roads of the city. The presence of hazardous road locations for pedestrians along the mid-block sections show poor road crossing infrastructures. High priority should be given to improve pedestrian safety by providing better road crossing facilities for pedestrians. Within city area, it is also recommended to incorporate pedestrian timing in the traffic signal to increase their safety. This paper helps the policy makers to take appropriate remedial measures in terms of traffic management to reduce injury crashes and to allocate the fund judiciously to set the priority for improvement.
KEYWORDS
: Vulnerable road users, GIS, Hazardous road locations, kernel density estimation*Corresponding author:
Bharati Lele
Research Scientist,
SJMSOM, Indian Institute of Technology Bombay
IJSRR, 8(1) Jan. – Mar., 2019 Page 2359
I
NTRODUCTIONDuring 2016, a total of 4,80,652 road accidents were reported1 in India. Of these 1,36,071
(28.3 per cent) were fatal accidents. The number of persons killed in road accidents were 1,50,785 i.e.
an average of one fatality per 3.2 accidents. The proportion of accident victims from pedestrian,
bicyclists and motorised two-wheeler riders in 2016 was 10.5%, 1.7% and 34.8% respectively.
In urban areas, sustainable proportion of trips up to 1-2 km are performed by foot. Compared
to other road users, vulnerable road users; i.e. pedestrians, bicyclists, and motorised two-wheeler
riders are more prone to injury as they are not protected by vehicle shell. These road users tend to
account for a much higher proportion of road traffic injury and deaths in low income and
middle-income countries, than high middle-income countries. In India, the share of vulnerable road accidents
accounts for 47% of total road accidents in year 2016. It is necessary to identify the hazardous road
locations of road traffic crashes and to explore influence of spatial factors. The paper discusses
possible remedial measures to improve the safety after studying the role of associated spatial and
non-spatial factors in traffic crashes.
The identification of accident location, analysis and treatment of hazardous road locations are
widely regarded as one of the most effective approach to road accident prevention. The development
of urban transport system has not kept pace with the traffic demand both in terms of quality and
quantity. As a result, the use of personalized transport mainly two wheelers and intermediate public
transport is growing at a rapid speed in medium sized Indian cities. The advancements in GIS is able
to manipulate and visually display numerous types of data for easy comprehension. GIS is a
technology for managing and processing location and related information. It visually displays the
results of traffic accident analysis has been pursued towards improving the efficiency and
effectiveness of traffic accident countermeasures. Also, GIS would make analysis less time
consuming and less tedious which otherwise would become very labour intensive. Thus, GIS will
offer a platform to maintain and update accidents record database and use it for further analysis.
Various road safety strategies and countermeasures have been used at different stages of
network development. This method of seeking to prevent road accidents mainly involves conscious
planning, design and operation roads. One of the most important factors in this method is the
systematic identification and treatment of hazardous locations. The main objective of the study
presented in this paper is to develop a model necessary to identify these hazardous locations on roads
commonly termed as black spots. In general, the various factors that cause accidents can be broadly
IJSRR, 8(1) Jan. – Mar., 2019 Page 2360
implement the road related factors for predicting the accident-prone points on roads and thus help in
identifying the required remedial measures.
Methodologies for predicting accidents have been widely studied in the past. The prediction
models are mostly causative types in which the number of accidents is taken as a function of number
of independent variables. Recently there have been studies to identify accident-prone locations using
GIS. The most common methodological approach used in the research efforts to model interaction
between the highway geometries, traffic characterization and accident frequency is regression
analysis. The ease of modelling readily favours the regression approaches. However, such methods
are highly dependent on traffic flow data like average daily traffic (ADT) and data collected by the
traffic police from the accident sites. But traffic flow data rarely available in sufficient quantity or
accuracy to justify these regression approaches. Moreover, the traffic police may not be able to
collect all the necessary data required to carry out the analysis using that data.
This paper presents a methodology using Kernel density estimation of traffic crash data in
Geographical Information Systems based on one-year (2012) traffic crashes of medium size city,
Vadodara. Minor, major and fatal traffic crash data used in this study are collected from Vadodara
police department. Traffic crash location of each crash has been worked out based on description
given in the First Information Report (FIR) of police record. Minor, major and fatal traffic crash are
geo-registered on GIS platform over road network of the city. Kernel density maps are plotted and
hazardous road intersections and midblock segments are presented.
L
ITERATURER
EVIEWDensity analysis takes known quantities of some phenomena and spreads it across the
landscape based on the quantity that is measured at each location and the spatial relationship of the
measured quantities. Kernel density estimation2 considered a more refined statistical hot spot
identifier when compared to cluster analysis. It involves placing a symmetrical surface over each
individual point, evaluating the distance from that point to a referenced location based on
mathematical function, and summing the value of all surfaces for that referenced location.
Xie and Yan presented a case study4 of road accidents (year 2005) of Bowling Green,
Kentucky and introduced a new approach to estimate the density of accident points. The road
network space was represented with basic linear units of equal network length, termed as lixel (linear
pixel). All the accidents were assigned to lixels, nearest road segment on which accident was
happened. The density value of centre point of a lixel was computed as the sum of kernel-function
derived densities from all the source lixels within a specified search bandwidth. The importance of
IJSRR, 8(1) Jan. – Mar., 2019 Page 2361
250, 500, 1000 and 2000 m. It was observed that narrow bandwidths (20, 100, and 250 m) may
produce patterns suitable for presenting hotspots at smaller scales. As search radius increases from
20 to 2000 m, the local hotspots gradually combined with their neighbours and larger cluster
appeared. It was noted that maps at wider search bandwidth (500, 1000 and 2000 m) seemingly give
better sense of locations of the hotspots at larger spatial scales.
Erdogan et al.5 have studied the road accidents occurred on highway within Afyonkarahisar
district of Turkey. The analysis was based on 7634 accidents recorded during 1996 to 2006 on 400
km highway. Accident magnitude values have been calculated per 0.5 x 0.5 km2 areas with a 500 m
bandwidth for every year period based on quadratic kernel function with ArcGIS.
Anderson6 presented a methodology using kernel density estimation to study spatial pattern
of injury related to road accidents based on police data from 1999 to 2003 for London. He has also
later employed clustering methodology using environmental data to determine casual indicators. He
has demonstrated different spatial levels of road accidents and classified clusters on the basis of
similar attributes. These clusters were then organised into groups, based on similarity of clusters. The
hierarchical process allowed a classification of the road accidents within hotspots or of the
environmental and land use of hotspot area.
Prasanna kumar et al.7 conducted GIS based study using accident data for the year 2008
collected from Thiruvananthapuram city (a South India city). Total 1468 accidents were geocoded as
x and y coordinated along with attribute data such as place, month, date, day, time, vehicle type,
reason, fatality etc. Moran’s I spatial autocorrelation test has been used for spatial pattern analysis.
When a Moran’s Index comes near +1.0, it is considered as a clustered data, while an index comes
near -1.0 data considered as dispersed data. The accident data exhibits clustered pattern when
Moran’s Index comes greater than 0 and pattern is dispersed when the index is less than 0. The
results of spatial analysis finally shown accident hotspots and cold spots. Authors have analysed
accidents near religious and educational institutions (spatial) and accidents occurred during monsoon
and non-monsoon period (temporal).
Rankavat and Tiwari9 carried out a study using road accident data for Delhi for year
2006-2009. They have identified accident prone-locations for pedestrians. It was concluded based on
geographic distribution of pedestrian victims, the widespread insecurity people experiencing in Delhi
while walking. It was observed that roundabout have less number of accidents and clusters of
accidents found at intersections and at the foot of flyovers.
Kernel Density Estimation11 is a non-parametric method to estimate the probability density
function of a variable that produces a smooth density surface of point events over a 2-D geographic
IJSRR, 8(1) Jan. – Mar., 2019 Page 2362
by computing event intensity as density estimation. The kernel function is usually expressed as a
function of the ratio between distance and search radius (bandwidth). The hotspot analysis focussed
on highlighting areas which have higher than average road accidents. The clustering analysis has
been carried out using road accident data for year 2013 for the state of Indiana
DATA
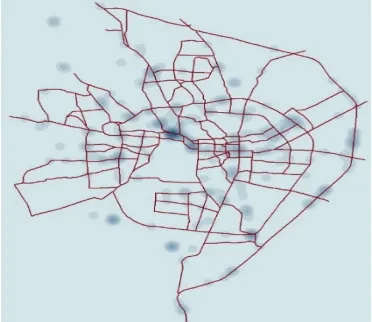
The road network of the city is digitised using Google Map for Vadodara city and then
imported as a shape file in ArcGIS. The road network shown is digitised for major roads and urban
highways; not the roads classified as streets. The part of National Highway 48 (previously known as
NH 8) is part of the analysis as it is fall under the municipal limits of city. Many victims of road
accidents on this NH 48 are residents of the city. The locations were determined based on FIR
description, which has been collected from police department. Later with the help of Google Map,
the final location of accident has been determined. Every possible attempt has been made to locate
the accident spot in terms of latitude and longitude as accurate as possible. Later the Excel worksheet
having location data imported in ArcMap module with X, Y data option. The X and Y points
represent longitude and latitude of accident place respectively. The other data related to accidents
like date, time, road type, collision type and collision spot as well as victim detail like age, gender,
injury severity, etc. were recorded as attribute data. These maps are output from ArcGIS software
and these maps also helped to decide whether the crash is on mid-block or on intersection by GIS
query.
There were 764 traffic injury crashes recorded within urban limits of Vadodara city in year
2012; out of which 45% were minor crashes, 41% major crashes and 14% fatal crashes. Almost 75%
crashes occurred on mid-block, while in 36% crashes, victims were non-motorised road users. The
maps were generated using Kernel density, which shows hotspots for pedestrians, bicyclists, and
motorised two-wheeler riders separately. This paper discusses the pattern of hazardous road locations,
land-use around such locations and other significant parameters for different cases. This paper helps
the policy makers to take appropriate remedial measures in terms of traffic management to reduce
injury crashes and to allocate the fund judiciously to set the priority for improvement.
Total number of road accidents reported in all 16 police stations of Vadodara city is 764 from
which minor, major and fatal accidents were 45%, 41% and 14% respectively. There are total 1100
people injured in road accidents; out of which 862 were male and 238 were female. About 86%
pedestrian accidents were occurred on mid-block and 9% on intersection. In 50% pedestrian
accidents, motorised two-wheeler was the impacting vehicle. The maximum pedestrian accidents
IJSRR, 8(1) Jan. – Mar., 2019 Page 2363
The highest accident risk to bicyclists is from M2W users as in 66% accidents, following by car as
an impacting vehicle. The proportion of minor, major and fatal bicycle accident was 63%, 34% and
3%. Majority of the victims were from the young age group bicycle users. The highest 63% bicycle
riders were going on work while accident occurred. Social trip and shopping trip have share of 8%
and 10% respectively in bicycle accident. Hit from back was the main collision type. There were
75% bicycle accidents observed on mid-block.
Total 605 motorised two-wheeler users injured and 54 killed in 487 road accidents. The
proportion of minor, major and fatal road accidents was 45%, 45% and 10% respectively. The most
affected victim type is motorised two-wheeler (M2W) and is approached 64% (487) while second
most affected victim type was pedestrians 25% (192).
SPATIAL
DATA
ANALYSIS
The kernel density estimation carried out by spatial analyst tool helps in determining spread
of road accidents on road network. It identifies the clusters that defines the area of higher accident
risk. Based on spatial dependency, this tool work out the areas having increased likelihood of
accidents. This helps in understanding geometric details of the road and land-use nearby these risky
clusters. The principle of Kernel function (Anderson 2009) to find out density estimates from
individual kernels for spread of accident spots can be given by
where, f(x,y) is the density estimate at the location x,y (expressed as longitude and latitude of
accident spot), n is number of observed accidents, h is bandwidth or kernel size, isdistance between
the location (x,y) and the location of ith observation
The effect of placing these kernels over accident points is to create a smooth and continuous
surface. Each kernel is a circular area of specific bandwidth or search radius. The kernel method
divides the entire study region into predetermined number of cells and applies circular
neighbourhood around each point (depicts an accident). The quadratic kernel function12 then applied
that goes from being highest at the point of accident to zero at the neighbouring boundary. Individual
cell value is assigned to each cell and this is a value of kernel function at the centre. The final density
of each cell is calculated by adding its individual cell values. When the search radius is increased
(see Figure 1) the circular neighbourhood will include more point features and the result in smoother
IJSRR, 8(1) Jan. – Mar., 2019 Page 2364 Fig. 1 Diagram explaining how kernel density estimation function work13
RESULTS AND DISCUSSION
Separate kernel density maps were generated for pedestrian, bicycle and motorised
two-wheeler riders’ accidents to identify hazardous locations for the victims of these vulnerable road
users. The reason for preparing separate map is the different possible causes for occurring of road
accident with these road users
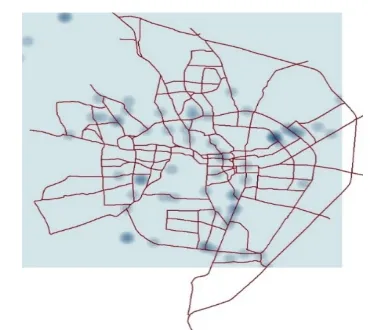
Fig. 2 Kernel density map for pedestrian accidents
The density map for pedestrian accident shows higher accident density on road near railway
station and education campus of University. There is heavy pedestrian movements of commuters
around railway station and heavy pedestrian movements of students near University’s academic area.
Some mid-block sections of National Highway-48 where some development has taken place on
outskirt of the city. Other areas having higher density of accidents are around main government
hospital of the city and some sections having very high commercial activities along road-side.
Maximum pedestrian accidents (86% out of total pedestrian accidents) have been observed on
IJSRR, 8(1) Jan. – Mar., 2019 Page 2365 Fig. 1 Kernel density map for Bicycle accidents Fig. 2 Kernel density map for motorised
two-wheeler (M2W) accidents
The mid-block sections witnessed 75% road accidents out of total bicycle accidents, while
19% accidents were observed on intersections. The proportion of bicycle accidents on National
Highway, major roads and streets was 6%, 71% and 23% respectively. High density of bicycle
accidents is exhibited on four-lane divided roads where traffic is very high.
The proportion of motorised two-wheeler accidents on NH, major roads and other roads was
12.5%, 61.4% and 26% respectively. More than 70% M2W accidents were observed on mid-block,
while 24% accidents were on intersections. Locations with high density of M2W accidents are more
on wide divided roads either having on-street parking or road-side commercial activities.
Most of the locations with high density of road accidents for all three types of vulnerable road
users are four-lane divided major roads of the city. The presence of hazardous road locations for
pedestrians along mid-block sections shows poor road crossing infrastructures. High priority should
be given to improve pedestrian safety by providing better road crossing facilities for pedestrians.
Within city area, it is also recommended to incorporate pedestrian timing in the traffic signal to
increase their safety. Speed is the major responsible for road accidents and as speed is increasing, the
accident severity also increases. The accident trend and spatial spread of M2W also shows that their
contribution is very high in total road accidents. It is very much needed to reduce the speed of traffic
flow by providing speed breaker at all identified locations. The police records should have additional
details like exact accident location recorded by GPS, road pavement condition at crash like wet or
dry, whether helmet and seat belt was worn by M2W rider and car user or not. Precise location of
accident will help to decide the role of geometric design of particular spot along with spatial analysis.
The accidents within high density area and outside this area can be evaluated separately as
the causes and accident patterns of these two categories of accidents may be different3. Different
approach should be taken for remedial measures to be worked out by further study to reduce the road
IJSRR, 8(1) Jan. – Mar., 2019 Page 2366
REFERENCES
1. Ministry of Road Transport and Highways, Road Accidents in India – 2016, Technical
Report, Government of India, 2017
2. Maantay, J., Ziegler, J.: GIS for the Urban Environment. Part 2, Case Study, ESRI Press,
California 2006; 10
3. Geurts, K., Thomas, I., Wets, G.: Understanding spatial concentrations of road accidents
using frequent item sets. Accident Analysis and Prevention. 2005; 37: 787—799
4. Xie, Z., Yan, J.: Kernel Density Estimation of traffic accidents in a network space.
Computers, Environment and Urban Systems. 2008; 32: 396--406
5. Erdogan, S., Yilmaz, I., Baybura, T., Gullu, M.: Geographical information systems aided
traffic accident analysis system case study: city of Afyonkarahisar. Accident Analysis and
Prevention, 2008; 40:174—181
6. Anderson, T.K.: Kernel density estimation and K-means clustering to profile road accident
hotspots. Accident Analysis and Prevention, 2009; 41: 359–364
7. Prasanna kumara, V., Vijitha, H., Charuthaa, R., Geethaa, N.: Spatio-Temporal Clustering of
Road Accidents: GIS Based Analysis and Assessment Procedia Social and Behavioral
Sciences, 2001; 21:317–325
8. Steenberghen, T., Dufays, T. , Thomas, I., Flahaut, B.: Intra-urban location and clustering of
road accidents using GIS: a Belgian example , International Journal of Geographical
Information Science, 2004; 18(2): 169-181
9. Rankavat S., Tiwari, G.: Pedestrian Accident Analysis in Delhi using GIS. Journal of the
Eastern Asia Society for Transportation Studies, 2013; 10:1446 – 1457
10. Fekadu, G, Quezon, E T.: Identification of Road Traffic Accident Blackspot locations and its
countermeasures in Oromia Region, East Wollega Zone. International Journal of Scientific &
Engineering Research, 2016; 7(10): 1372--1379
11. Abdulhafedh, A.: Identifying Vehicular Crash High Risk Locations along Highways via
Spatial Autocorrelation Indices and Kernel Density Estimation. World Journal of Engineering
and Technology, 2017; 5: 198-215
12. Silverman, B.: Density Estimation for statistics and Data Analysis. 1st ed. 19886, Chapman
and Hall London.
13. Bailey, T.C., Gatrell, A.C.: Interactive Spatial Data Analysis. John Wiley and Sons, New