522 |
P a g e
STUDY OF PERVIOUS CONCRETE WITH VARIOUS
CEMENT CONTENT
M. Uma Maguesvari
1, V.L.Narasimha
2 1Research Scholar, Dept. of Civil Engg, Pondicherry Engineering College, Puducherry, (India)
2Professor, Dept. of Civil Engg, Pondicherry Engineering College, Puducherry,( India)
ABSTRACT
This study presents the effect of variation of cement content on uniformly graded coarse aggregate on the
properties of porous concrete. Materials used are OPC Type I and uniformly graded aggregate of size 19.5mm
to 9.5mm and 9.5mm to 4.75. Mixes were prepared with the water cement ratio of 0.34 and cement content
varies from 200kg/m3 to 450kg/m3 by incrementing cement content as 50kg/m3. Their mechanical properties and
Coefficient of permeability was determined by using falling head method. The relationship between the strength
and permeability with voids are discussed and the optimum mixes are arrived.
Keywords
:
Angularity, Compressive strength, Flexural strength, Permeability, Pervious concrete, Split tensile
strength.
I.
INTRODUCTION
Pervious concrete is a special concrete that contains continuous voids which are intentionally incorporated into concrete, allows water from precipitation and other sources to pass through, which in turn reduces the runoff from a site and recharging ground water levels. Porous concrete also called pervious concrete, no-fine concrete, gap graded concrete, enhanced porosity concrete is a macro-porous concrete. Urbanization and the resulting increase in urban storm water led to an increase in runoff and pollution. The natural process of rainfall infiltration has been diverted and decreased. Decreasing the infiltration rate causes deduction in recharging groundwater which has led to a number of environmental concerns, decreasing the base flow in streams and drying up of small streams. Pervious concrete is made by omitting the fine aggregate from the concrete mixture. The size of the connected pores in pervious concrete range from 2 to 8mm in diameter with void content between 15 to 35%[1].Porous concrete can be used in numerous applications such as permeable concrete for pavement, base course, concrete bed for vegetation or living organism, noise absorbing concrete, thermal insulated concrete and other civil engineering and architectural applications. Porous concrete is made of attached single-size aggregate by Portland cement. Aggregate is the main part of the concrete volume. Chemical properties of porous concrete are similar to the dense concrete. In porous concrete sufficient paste, which is created by controlled amounts of water and cementation materials, coats and binds the aggregate particles and create a highly permeable and well drained system. Since the aggregate strength is usually high, the strength of the thin paste around the aggregate particles
523 |
P a g e
strength therefore depends primarily on the properties of the paste and the interface between the paste and the aggregate[2,3]. Optimum range of water cement ratio for both strength and permeability point of view ranges from 0.30 to 0.38[4,5]. High range Water reducer and thickening agent are introduced in the concrete to improve its strength and workability [6]. Addition of styrene butadiene latex is found to improve the compressive strength but reduce permeability[7,8]. Latex polymer, Styrene Butadiene rubber and sand up to 7% are introduced in concrete to improve its strength. It reduces permeability which shows the void content is less still within an acceptable range greater than 15%. Compressive strength varies from 7 to 15 MPa[9]. To improve the strength of pervious concrete, three components must be improved, the strength of the paste, the paste thickness around the aggregate, and the interface between the aggregate and the paste.
Studies also focused on microstructure of pervious concrete by scanning electronic microscope and its interfacial structure [10-13]. Attempts have also been made to improve the fatigue strength of Porous concrete and toughness of pervious concrete [14]. Study also made to focus on the use of geo polymer binder for making pervious concrete using natural and recycled aggregate [15,16]. Slipping characteristics of pervious concrete walking surfaces in icy conditions using kinetic biomechanical analysis was also carried out[17].Increasing cement content in a mixture does not necessarily contribute to increasing strength[18]. In addition, the high cement content will cause the mixture to become sticky and may lead to increased risk of shrinkage and cracking problems. Therefore, cement content should be balanced to achieve the required performance while minimizing risk of these problems. The cement content of a mixture is commonly perceived to control concrete strength. Based on this perception, the objective of this study is to investigate the effects of variation of cement content on pervious concrete and its properties.
II.
MATERIALS AND PROPERTIES
Constituent used were cement, crushed gravel as coarse aggregate and water. Type I Portland cement conforming to ASTM C 150 was used in all mixes, Crushed gravel was used as coarse aggregate, uniformly graded aggregate of size 19.5mm to 9.5mm and 9.5mm to 4.75. Table 1 presents the physical properties of materials.
T
ABLE1.
Physical Properties of Materials
Properties Value
Specific gravity (SSD)of Coarse aggregate 2.71 Specific gravity (OD)of Coarse aggregate 2.70 Specific gravity of cement 3.15
2.1 Angularity
524 |
P a g e
T
ABLE2.
Angularity Number for Various Sizes of aggregate
2.2 Mix proportion
Experimental work was carried out based on above concept of angularity number , cement content of 450kg/m3to 200kg/m3, water cement ratio of 0.34 [4,19].
Mixes corresponding to two different aggregate sizes are proportioned as per IS: 10262-2008 by absolute volume method. Mixes are designed as A1 to A6 and B1 to B6. A total of 12 mixes were studied. Details of these mixes are presented in Tables 3 and 4.
T
ABLE3:
Designation of the Mixes
T
ABLE4
:
Mix Proportions of Pervious Concrete
III.
RESULTS AND DISCUSSION
3.1 Strength Parameter
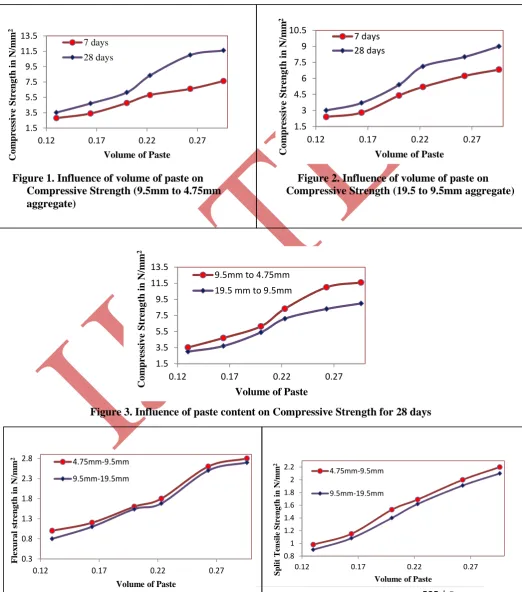
Compressive strength test were conducted in accordance with ASTM C 39. Cubes of specimen of size 100 mm x 100 mm x 100 mm were prepared for each mix. After 24 hours the specimens were de molded and cured in water for 24ºC until testing. “Fig 1 and 2” shows the compressive strength of 7 and 28 days for different paste content for two sizes of aggregate 4.75 to 9.5 mm and 19.5 to 9.5mm .Smaller size aggregate shows higher compressive strength than larger size aggregate due to its specific surface area . Specific surface area of smaller size aggregate is more than larger size aggregate. Increase in volume of paste in aggregate causes increase in compressive strength at both the sizes of aggregates. As indicated in “Fig 3” the influence of binder content increases in the mix causes increases in compressive strength. It shows that both the sizes of aggregates follow the same trend. Compressive strength varies from 3 to 11.6 N/mm2.
Mix Details Angularity Number
A – Size of aggregate 19.5 mm to 9.5 mm 7 B – Size of aggregate 9.5 mm to 4.75 mm 4
Cement Content
Size of aggregate
19.5 mm to 9.5mm
9.5mm to 4.75mm
200 A1 B1 250 A2 B2 300 A3 B3 350 A4 B4 400 A5 B5 450 A6 B6
Name of the Mix
Material quantity(Kg/m3)
Cement Content
Coarse aggregate
525 |
P a g e
Figure 5. Influence of volume of paste on Split
tensile Strength
0.8 1 1.2 1.4 1.6 1.8 2 2.2
0.12 0.17 0.22 0.27
Sp lit T ens ile Str eng
th in N/m
m
2
Volume of Paste
4.75mm-9.5mm
9.5mm-19.5mm
Figure 4. Influence of volume of paste on
Flexural Strength
0.3 0.8 1.3 1.8 2.3 2.80.12 0.17 0.22 0.27
F lex ura l st re ng
th in N/m
m
2
Volume of Paste 4.75mm-9.5mm
9.5mm-19.5mm
Figure 2. Influence of volume of paste on
Compressive Strength (19.5 to 9.5mm aggregate)
1.5 3 4.5 6 7.5 9 10.5
0.12 0.17 0.22 0.27
Co m pre ss iv e St re ng th in N/m m 2
Volume of Paste 7 days
28 days
Figure 1. Influence of volume of paste on
Compressive Strength (9.5mm to 4.75mm
aggregate)
1.5 3.5 5.5 7.5 9.5 11.5 13.50.12 0.17 0.22 0.27
Co m press iv e Str eng
th in N/m
m
2
Volume of Paste
7 days 28 days
flexural strength was obtained from three point method according to ASTM C 78 the test were carried out after 28 days of curing on the beam sample of size 100 mm x 100 mm x 500mm. Split Tensile strength was obtained in accordance with ASTM C 496. Cylindrical specimens of 100 mm x 200 mm were cast and tested after 28 days curing, both the graphs shows the similar trend. Similarly with respect to size of aggregate, smaller size shows more flexural and split tensile strength than larger size aggregate
1.5 3.5 5.5 7.5 9.5 11.5 13.5
0.12 0.17 0.22 0.27
Co m press iv e Str eng
th in N/m
m
2
Volume of Paste 9.5mm to 4.75mm 19.5 mm to 9.5mm
526 |
P a g e
3.2
Permeability
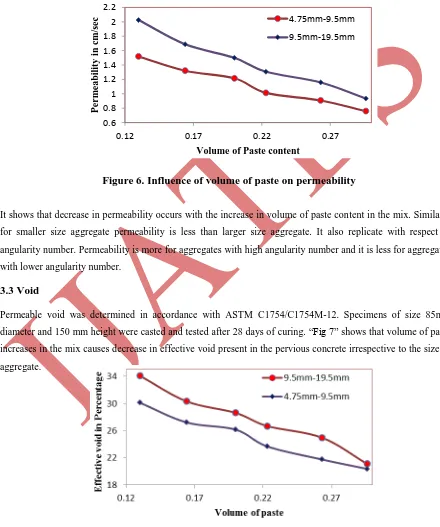
Permeability of pervious mixes was determined by using falling head permeability method based on earlier study [11]. Specimen of size 80 mm diameter and 150 mm length were casted and tested after 28 days of curing. The most distinguished feature of pervious concrete is its high permeability, which is a measure of the ease by which fluid may flow through the material under a pressure gradient. Results of permeability of the pervious concrete mixtures are represents in “Fig 6”. Permeability mainly depends upon the size of interconnected pores, which present in pervious concrete.
Figure 6. Influence of volume of paste on permeability
It shows that decrease in permeability occurs with the increase in volume of paste content in the mix. Similarly for smaller size aggregate permeability is less than larger size aggregate. It also replicate with respect to angularity number. Permeability is more for aggregates with high angularity number and it is less for aggregates with lower angularity number.
3.3 Void
Permeable void was determined in accordance with ASTM C1754/C1754M-12. Specimens of size 85mm diameter and 150 mm height were casted and tested after 28 days of curing. “Fig 7” shows that volume of paste increases in the mix causes decrease in effective void present in the pervious concrete irrespective to the size of aggregate.
Figure 7. Influence of volume of paste on Effective Void
0.60.8 1 1.2 1.4 1.6 1.8 2 2.2
0.12 0.17 0.22 0.27
P
er
m
ea
bil
it
y
in cm
/s
ec
Volume of Paste content
4.75mm-9.5mm
527 |
P a g e
Figure 9. Influence of Effective Void
percentage on compressive strength (9.5 to
4.75mm aggregate)
Figure 8. Influence of Effective Void percentage
on compressive strength (19.5 to 9.5mm
aggregate)
y = 0.8314x R² = 0.9071 1 2.5 4 5.5 7 8.5 10
2 4 6 8 10 12
Ca lcula ted co m press iv e st re ng th
Experimental Compressive strength
y = 77.93e-0.095x
R² = 0.9085
2.5 3.5 4.5 5.5 6.5 7.5 8.5 9.5 10.5
20 25 30 35
Co m press iv e st re ng
th in N/m
m
2
Effective Void in %
y = 175.84e-0.13x R² = 0.9841
3 5 7 9 11 13
20 22 24 26 28 30
C o m press iv e st re ng
th in N
/m
m
2
Effective Void in %
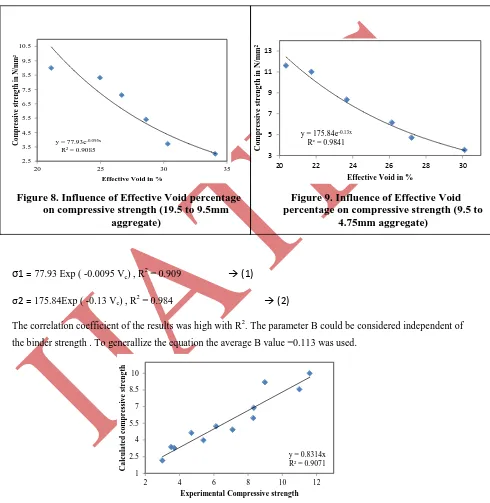
The results on compressive strength of various volume of paste content and effective void are plotted in “Fig 8 and 9”. The relationship between compressive strength and effective void of pervious concrete was influenced by volume of paste. The effective void become larger,the compressive strength of pervious concrete was reduced . The relationship between binder strength and effective void ratio for the two sizes of aggregate could be expressed as (1,2)
σ
1 =
77.93 Exp ( -0.0095 Ve) , R 2= 0.909
(1)
σ2 =
175.84Exp ( -0.13 Ve) , R2 = 0.984
(2)
The correlation coefficient of the results was high with R2. The parameter B could be considered independent of the binder strength . To generallize the equation the average B value =0.113 was used.
Figure 10. Compressive strength between experimental and calculated values
528 |
P a g e
The graph of the calculated results were plotted with the experimental results shown in “Fig.10” indicated the applicability of equation (3).
3.5 Relation between permeability and strength
“Fig.11”shows relationship between compressive strength and permeability, it shows that increase in void content causes increase in permeability irrespective of aggregate size.
y = 28.118e-1.178x
R² = 0.8897 0
2 4 6 8 10 12 14
0.6 1.1 1.6 2.1
C
o
m
pr
essiv
e
St
re
ng
th
in N
/m
m
2
Permeability in cm/sec
Figure 11. Permeability with Compressive strength
3.6 Relation between permeability and void
The relation between theoretical void and permeability are shown in “Fig 12”. It shows that when the value of void increases and the corresponding permeability increases irrespective of the size of aggregates. Permeability varies from 0.76 cm/s to 2.03 cm/s.
y = 0.2093e0.0675x
R² = 0.9762 0.5
0.7 0.9 1.1 1.3 1.5 1.7 1.9 2.1
18 23 28 33
P
er
m
ea
bil
it
y
in
cm
/se
c
Effective Void in percentage
529 |
P a g e
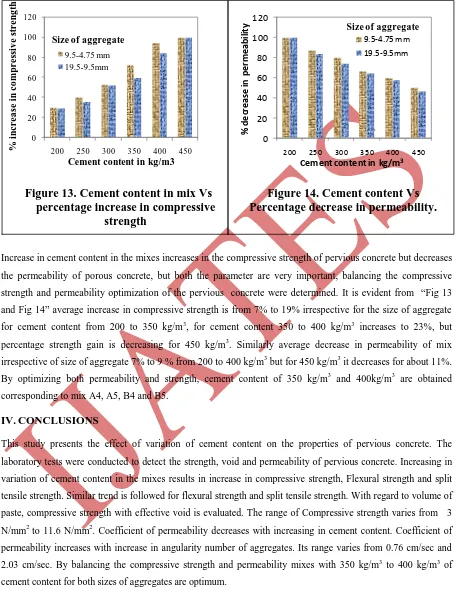
Increase in cement content in the mixes increases in the compressive strength of pervious concrete but decreases the permeability of porous concrete, but both the parameter are very important, balancing the compressive strength and permeability optimization of the pervious concrete were determined. It is evident from “Fig 13 and Fig 14” average increase in compressive strength is from 7% to 19% irrespective for the size of aggregate for cement content from 200 to 350 kg/m3, for cement content 350 to 400 kg/m3 increases to 23%, but percentage strength gain is decreasing for 450 kg/m3. Similarly average decrease in permeability of mix irrespective of size of aggregate 7% to 9 % from 200 to 400 kg/m3 but for 450 kg/m3 it decreases for about 11%. By optimizing both permeability and strength, cement content of 350 kg/m3 and 400kg/m3 are obtained corresponding to mix A4, A5, B4 and B5.
IV.
CONCLUSIONS
This study presents the effect of variation of cement content on the properties of pervious concrete. The laboratory tests were conducted to detect the strength, void and permeability of pervious concrete. Increasing in variation of cement content in the mixes results in increase in compressive strength, Flexural strength and split tensile strength. Similar trend is followed for flexural strength and split tensile strength. With regard to volume of paste, compressive strength with effective void is evaluated. The range of Compressive strength varies from 3 N/mm2 to 11.6 N/mm2. Coefficient of permeability decreases with increasing in cement content. Coefficient of permeability increases with increase in angularity number of aggregates. Its range varies from 0.76 cm/sec and 2.03 cm/sec. By balancing the compressive strength and permeability mixes with 350 kg/m3 to 400 kg/m3 of cement content for both sizes of aggregates are optimum.
Figure 13. Cement content in mix Vs
percentage increase in compressive
strength
Figure 14. Cement content Vs
Percentage decrease in permeability.
0 20 40 60 80 100 120
200 250 300 350 400 450
%
in
c
r
e
a
se
i
n
c
o
m
p
r
e
ss
iv
e
st
r
e
n
g
th
Cement content in kg/m3 Size of aggregate
9.5-4.75 mm 19.5-9.5mm
0 20 40 60 80 100 120
200 250 300 350 400 450
%
de
cr
e
as
e
in
pe
rm
e
abi
lit
y
Cement content in kg/m3
Size of aggregate
530 |
P a g e
REFERENCES
Journal Papers:
[1].Jing Yang & Guoliang Jiang, 2003. Experimental study on properties of pervious concrete pavement materials. Cement and Concrete Research, 33 , pp 381–386.
[2]. P. Chindaprasirt , S. Hatanaka , T. Chareerat , N. Mishima & Y. Yuasa, 2008. Cement paste characteristics and porous concrete properties. Construction and Building Materials ,22 , PP 894-901. [3.]P. Chindaprasirt, S. Hatanaka, N. Mishima, Y. Yuasa & T. Chareerat, 2009. Effects of binder strength and
aggregate size on the compressive strength and void ratio of porous concrete. International Journal of Minerals, Metallurgy and Materials , 16, N0. 6,pp 714-719.
[4]. C. Lian & Y. Zhuge, 2010. Optimum mix design of enhanced permeable concrete – An experimental investigation. Construction and Building Materials, 24 , pp 2664–2671.
[5].C. Lian, Y. Zhuge & S. Beecham, 2011. The relationship between porosity and strength for porous concrete. Construction and Building Materials, 25, pp4294–4298.
[6].M. Aamer Rafique Bhutta , K. Tsuruta & J. Mirza, 2012. Evaluation of high-performance porous concrete properties. Construction and Building Materials, 31, 67 – 73.
[7]. Baoshan Huang, Hao Wu, Xiang Shu & Edwin G. Burdette, 2010. Laboratory evaluation of permeability and strength of polymer-modified pervious concrete. Construction and Building Materials , 24, pp 818-823.
[8].Bradley J. Putman & Andrew I. Neptune, 2011. Comparison of test specimen preparation techniques for pervious concrete pavements. Construction and Building Materials, 25, pp 3480 –3485.
[9]. Xiang Shu , Baoshan Huang, Hao Wu, Qiao Dong & Edwin G. Burdette, 2011. “Performance comparison of laboratory and field produced pervious concrete mixtures. Construction and Building Materials, 25 ,pp3187–3192 .
[10].Milani S. Sumanasooriya & Narayanan Neithalath, 2011. Pore structure features of pervious concretes proportioned for desired porosities and their performance prediction. Cement & Concrete Composites, 33, pp778-787.
[11].Narayanan Neithalath , Jason Weiss & Jan Olek, 2006. Characterizing Enhanced Porosity Concrete using electrical impedance to predict acoustic and hydraulic performance. Cement and Concrete Research ,36 ,pp 2074-2085.
[12].Narayanan Neithalath, Milani S. Sumanasooriya & Omkar Deo, 2010. Characterizing pore volume, sizes, and connectivity in pervious concretes for permeability prediction. Materials Characterization , 61, pp 802 – 813.
531 |
P a g e
concrete. Construction and Building Materials, 42, 97-104.
[15].Tawatchai Tho-in ,Vanchai Sata , Prinya Chindaprasirt a, Chai Jaturapitakkul, 2012. Previous high-calcium fly ash geopolymer concrete. Construction and Building Materials ,30 ,pp 366–371.
[16]. Vanchai Sata , Ampol Wongsa, Prinya Chindaprasirt, 2013. Properties of pervious geopolymer concrete using recycled aggregates. Construction and Building Materials, 42, pp 33–39.
[17]. Gregory W.King,Adam P.Bruetsh,John T.Kevern,2013. Slip-related characterization of gaint kinetics:Investigation of pervious concrete as a slip-resistant walking surface, Safety science,57,pp 52-59. [18]. Wassermann, R., Katz, A., and Bentur, A, 2009. Minimum cement content requirements: a must or a
myth?. Materials and Structures, No. 42, pp973–982.