THE CONTRIBUTION OF FUNCTIONAL BRAIN NETWORKS AND OSCILLATIONS TO THE DEVELOPMENT OF COGNITIVE CONTROL
by
Scott Allen Marek
BS, John Carroll University, 2012
Submitted to the Graduate Faculty of The School of Medicine in partial fulfillment
of the requirements for the degree of Doctor of Philosophy
University of Pittsburgh 2017
UNIVERSITY OF PITTSBURGH SCHOOL OF MEDICINE
This dissertation was presented
by
Scott Allen Marek
It was defended on April 3, 2017 and approved by
Julie A. Fiez, Professor, Psychology Kirk I. Erickson, Associate Professor, Psychology
Peter J. Gianaros, Professor, Psychology
Avniel Singh Ghuman, Assistant Professor, Neurological Surgery
Timothy Verstynen, Assistant Professor, Psychology, Carnegie Mellon University Dissertation Director: Beatriz Luna, Staunton Professor, Psychiatry & Psychology
Copyright © by Scott Allen Marek 2017
Adolescence is a qualitatively unique period of development when cognitive control abilities are available but are unreliably engaged, which can lead to risk-taking behavior impacting survival. The specific neural mechanisms contributing to the maturation of cognitive control remain poorly understood. To address this issue, we employed functional magnetic resonance imaging (fMRI) and magnetoencephalography (MEG) to study brain networks and oscillations underlying cognitive control development in both the resting state and during a cognitive flexibility task. In the first study, we found that the organization of brain networks was established prior to adolescence. However, a network of brain regions anchored in the anterior cingulate cortex (ACC) and anterior insula (aIns) significantly increased its influence over other brain networks via increased network integration during the resting state, resulting in faster correct responses on a cognitive control task. In the second study, we leveraged increased temporal resolution using MEG to further probe resting state connectivity changes with age. We found similar medial prefrontal regions became less coupled in their interactions with the rest of the brain, specifically in the theta band (5-9 Hz oscillations), and were related to developmental decreases in
THE CONTRIBUTION OF FUNCTIONAL BRAIN NETWORKS AND OSCILLATIONS TO THE DEVELOPMENT OF COGNITIVE CONTROL
Scott Allen Marek, PhD
impulsivity. As such, these results suggest there are developmental increases in the flexibility of resting state connectivity, which may afford less effortful instantiation of cognitive control. The third study directly tested age-related changes in brain oscillations during a cognitive flexibility paradigm. We found evidence of strong induction of theta band oscillations in the ACC when task switching that scaled positively with average reaction time. Similar to our resting state MEG findings, we found that the prominence of ACC theta band rhythms decreased with development, suggesting that during cognitive flexibility, adolescents need to engage greater cognitive control to switch between cognitive demands compared to adults. Taken together, these results inform a model of adolescent development such that the specialization of medial prefrontal systems plays a primary role in developmental improvements in cognitive control as they strengthen their integration with other networks. Increased network integration affords these regions the ability to more flexibly engage other brain regions, supporting the maturation of cognitive control.
TABLE OF CONTENTS
PREFACE ... XV
1.0 INTRODUCTION ... 1
1.1 ADOLESCENT BRAIN DEVELOPMENT ... 1
1.2 IMMATURE COGNITIVE CONTROL SYSTEMS ... 2
1.3 A NETWORK APRROACH TO BRAIN ANALYSES ... 3
1.4 FUNCTIONAL BRAIN NETWORK DEVELOPMENT ... 5
1.5 BRAIN NETWORKS UNDELRYING COGNITIVE CONTROL ... 6
1.6 OSCILLATIONS AND THEIR COMPONENTS: AMPLITUDE AND PHASE ... 8
1.7 MECHANISMS UNDERLYING IMPROVEMENTS IN COGNITIVE CONTROL: A MODEL... 11
1.8 DEVELOPMENT OF TASK SWITCHING ... 14
1.9 SUMMARY AND OVERVIEW ... 15
2.0 THE CONTRIBUTION OF NETWORK ORGANIZATION AND INTEGRATION TO THE DEVELOPMENT OF COGNITIVE CONTROL ... 16
2.1 BACKGROUND ... 16
2.2 METHODS ... 18
2.2.2 Task Design... 19
2.2.3 Eye Tracking ... 20
2.2.4 MR Data Acquisition ... 21
2.2.5 RS-fMRI Preprocessing... 21
2.2.6 Functional Network Parcellation... 22
2.2.7 Individual and Group Correlation Matrices ... 23
2.2.8 Network Detection and Comparison ... 23
2.2.9 Connectivity Strength Changes during Adolescence ... 25
2.2.10 Developmental Changes in Participation Coefficient at the Network Level ... 25
2.2.11 Long-Term Fluctuation in Network-level Participation Coefficient... 26
2.2.12 Relating Changes in Integration to the Development of Inhibitory Control ... 26
2.2.13 Identifying Specific Nodes Increasing in Participation Coefficient ... 27
2.2.14 Age-related Changes in the Distribution of Regional Participation Coefficient ... 28
2.2.15 Computations and Visualizations ... 28
2.3 RESULTS ... 28
2.3.1 Development of Functional Network Organization ... 28
2.3.2 Connectivity Strength Changes during Adolescence ... 34
2.3.3 No Changes in Distance-dependent Connectivity through Adolescence 36 2.3.4 Developmental Trajectories of Network-level Integration ... 37
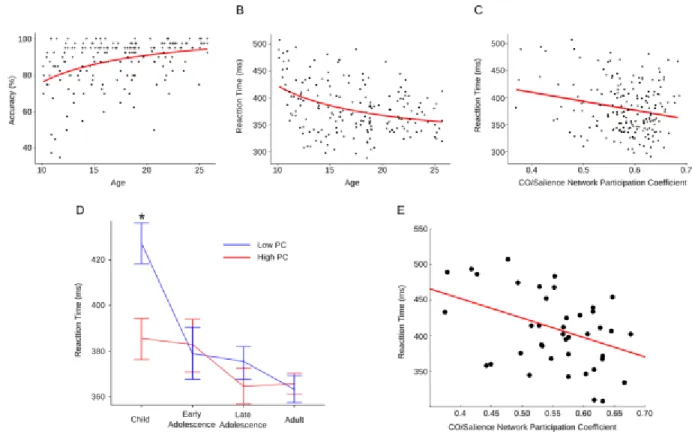
2.3.5 Cingulo-Opercular/Salience Network Integration Moderates the
Relationship between Age and Antisaccade Latency ... 41
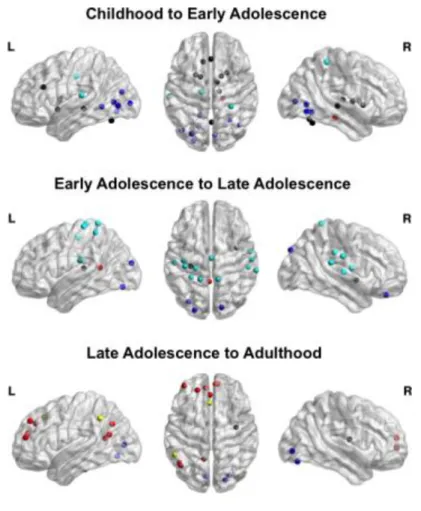
2.3.6 Developmental Patterns of Regional Integration ... 44
2.3.6.1 Childhood to Early Adolescence ... 45
2.3.6.2 Early Adolescence to Late Adolescence ... 46
2.3.6.3 Late Adolescence to Adulthood ... 47
2.4 INTERIM DISCUSSION ... 47
2.4.1 Developmental Stability in Functional Brain Network Organization ... 48
2.4.2 Age-related Changes in Connectivity Strength ... 49
2.4.3 Increased Integration of the Cingulo-opercular/Salience Network ... 50
2.4.4 Cingulo-opercular/Salience Network Integration Moderates Age-related Improvements in Inhibitory Control ... 52
2.4.5 The Role of Resting-state Coupling in Network Integration ... 53
2.4.6 Limitations ... 54
2.4.7 Summary ... 55
3.0 OSCILLATIONS, NETWORKS, AND THEIR RELATIONSHIP WITH THE DEVELOPMENT OF IMPULSE CONTROL ... 56
3.1 BACKGROUND ... 56
3.2 METHODS ... 58
3.2.1 Subjects ... 58
3.2.2 Structural MRI Acquisition ... 59
3.2.3 MEG Acquisition ... 59
3.2.5 Regions of Interest (ROIs)... 61
3.2.6 Measure of Neural Coupling: The Phase-locking Value (PLV) ... 61
3.2.7 Determining Age-related Changes in Coupling ... 62
3.2.8 Posterior-to-anterior Gradient of Decoupling across Development ... 63
3.2.9 Specific ROI Interactions Driving Regional Changes in PLV ... 63
3.2.10 Control for Power ... 64
3.2.11 Head Movement Correction... 65
3.2.12 Relationship between Impulsivity and Theta-band Phase Locking ... 65
3.3 RESULTS ... 66
3.3.1 Developmental Differences in Global Cortical Phase Locking ... 66
3.3.2 Regional Changes in PLV ... 68
3.3.3 Greatest Rate of Change in PLV is Specific to the Theta Band and to the Resting state ... 72
3.3.4 Network-level Changes in PLV... 73
3.3.5 Pairwise Decreases in Phase Locking ... 75
3.3.6 PLV Mediation of Age and Impulsivity ... 77
3.4 INTERIM DISCUSSION ... 79
4.0 DEVELOPMENT OF COGNITIVE FLEXIBILITY ... 83
4.1 BACKGROUND ... 83
4.2 METHODS ... 85
4.2.1 Subjects ... 85
4.2.2 Task Design... 85
4.2.4 MEG Acquisition ... 88
4.2.5 MEG Data Processing... 88
4.2.6 MEG Deconvolution ... 89
4.2.7 Head Model, Inverse Model, and Warping ... 90
4.2.8 Regions of Interest ... 91
4.2.9 Average Time Courses ... 92
4.2.10 Frequency Components of Task Switching ... 93
4.2.11 Time/Frequency decomposition ... 93
4.2.12 Brain regions predicting trial-to-trial differences in reaction time ... 94
4.2.13 Relationship between power, age, and average reaction time ... 95
4.3 RESULTS ... 96
4.3.1 Behavior ... 96
4.3.2 Regional effects of task switching ... 97
4.3.3 Frequency Components ... 99
4.3.4 Temporal specificity of increases in power during task switching ... 101
4.3.5 Regional contributions to trial-to-trial fluctuations in reaction time during task switching ... 102
4.3.6 Relationship between average power and average RT during task switching ... 107
4.3.7 Relationship between power and age during task switching ... 108
4.3.8 Interaction between power and age on RT during task switching ... 109
4.4.1 Differential contributions of the ACC, DLPFC, and IPL in task
switching ... 112
4.4.2 Developmental decreases in theta/alpha power ... 114
4.4.3 Summary ... 115 5.0 GENERAL DISCUSSION ... 117 5.1 CLOSING REMARKS ... 121 APPENDIX A ... 123 A.1 FIGURES ... 123 A.2 TABLES ... 125
A.3 WORKING MEMORY TASK... 127
A.4 TASK MEG DATA PREPROCESSING ... 128
A.5 ACC THETA BAND OSCILLATIONS ARE NOT ADAPTIVE ... 130
LIST OF TABLES
Table 1. Demographics ... 30
Table 2. Regions displaying the greatest decreases in theta band PLV during adolescence ... 71
Table 3. ROI MNI coordinates ... 92
Table 4. Stable network organization is not dependent on network density ... 125
LIST OF FIGURES
Figure 1. Oscillatory components: amplitude and phase ... 9
Figure 2. A model of the maturation of cognitive control. ... 13
Figure 3. Development of network organization. ... 31
Figure 4. Comparison of NMI to a null distribution ... 33
Figure 5. Connectivity strength changes as a function of network organization ... 35
Figure 6. Developmental changes in connectivity strength are not a function of distance. ... 37
Figure 7. Development of network integration. ... 39
Figure 8. Relationship between increased cingulo-opercular/salience network integration and cognitive control ... 42
Figure 9. Regional increases in participation coefficient... 45
Figure 10. Workflow schematic ... 67
Figure 11. Theta-band phase-locking decreases across development. ... 68
Figure 12. Regional decrease in phase locking in the theta band. ... 70
Figure 13. Band specific posterior-to-anterior gradients. ... 73
Figure 14. Network changes in phase-locking. ... 74
Figure 16. Orbitofrontal/anterior temporal theta-band phase-locking mediates the relationship
between age and impulsivity. ... 79
Figure 17. MEG switch task design ... 87
Figure 18. Spatiotemporal effects of task switching. ... 98
Figure 19. Frequency components of task switching... 100
Figure 20. Time/Frequency decomposition of switch vs. non-switch contrast. ... 102
Figure 21. Regions displaying significantly more ability to predict RT in the switch vs. non-switch condition in the time-domain... 105
Figure 22. Regions displaying significantly more ability to predict RT in the switch vs. non-switch condition in the frequency domain as a function of time. ... 106
Figure 23. Changes in power across development in switch vs. non-switch trials. ... 109
Figure 24. Interaction between ACC theta band power and age predicting average RT switch cost. ... 111
Figure 25. Interaction between right aIns alpha band power and age predicting average RT switch cost. ... 111
Figure 26. Normalized mutual information between individual subjects and adults. ... 123
Figure 27. Participation coefficient is robust to network density. ... 124
PREFACE
To my parents, Leonard and Karen Marek – Thank you for always keep me on the right path and providing the most stable and loving upbringing a child could ever ask for. You both were undoubtedly the most critical aspect of my personal development.
To my brother, Ryan Marek – You have always taken the responsibility of an older brother seriously. Thank you for paving the way for me, always wandering into uncharted water before me, despite your worrisome and overly cautious nature! Onward and upward!
To my girlfriend, Jusmita Saifullan – To say that your strength and resilient nature is inspirational is a vast understatement. A person of your character is rare, and I’m incredibly grateful that fate had us run into each other on a rainy January morning. Our future is brighter than a quasar, and I cannot wait to be alongside you making both of our dreams come true. To my good friend Will Foran – Without you none of this work would have been possible. You’ve play a truly integral role in my development throughout graduate school, and always made sure I had enough junk food!
To my advisor, mentor, and Pittsburgh mom, Dr. Beatriz Luna – I came wandering into your lab not having the faintest idea of development; thank you for taking a chance on me. Your lab has been a blessing more so than you know, and I’ll be forever grateful to you for getting my career as a scientist off the ground. We’ve undoubtedly accomplished some great science, and I look forward to continuing our collaboration long into the future.
1.0 INTRODUCTION
1.1 ADOLESCENT BRAIN DEVELOPMENT
Brain changes during adolescence are unique and critical for determining adaptive adult level control1. Decades of research support the idea that the adolescent brain is qualitatively and
quantitatively different from either the child or adult brain. Gross brain morphology is in place by childhood; however, there are continued refinements in the form of synaptic pruning and increased myelination of major white matter tracts throughout adolescence and beyond2–5. By
adolescence core brain processes are on line, supporting the ability to engage cognition at adult levels; however, performance in cognitive control tasks is not adult levels as adolescents engage these systems in an inconsistent manner. As such, by adolescence the ability to make complex decisions is available, but its lack of reliability may undermine goal directed behavior believed to underlie risk-taking behavior that has an impact on mortality6. Importantly, adolescence is a
critical period of development in which many psychiatric disorders emerge7, including
schizophrenia, which has a strong link to deficiencies in neural oscillations related to cognitive control8. Therefore, characterizing the neural basis of normative development of brain networks
and their oscillations is imperative for informing the neural basis concerning the emergence of psychiatric disorders.
1.2 IMMATURE COGNITIVE CONTROL SYSTEMS
Cognitive control refers to an emergent phenomenon characterized by the ability to voluntarily coordinate behavior within a noisy and variable environment to support goal-driven behavior9.
Inhibitory control and working memory are key components of cognitive control. Importantly, these systems interact in a coordinated fashion during moment-to-moment cognition10. Inhibitory
control describes the function of suppressing reflexive, goal-incompatible responses, while working memory refers to the active maintenance of information that guides goal-directed behavior. Critically, these components of cognitive control are available early in childhood11.
Results reliably show that what continues to develop into adolescence is the rate at which accurate responses are made, decreases in reaction times, and decreases in the variability of reaction times11,12. Therefore, development is likely characterized by the refinements in the
interactions between existing control systems, rather than the emergence of new networks. The neural basis for changes in aspects of cognitive control that support its reliable instantiation are not understood, limiting our ability to understand impaired development, such as in psychopathology.
fMRI studies have been inconclusive as to the mechanisms by which cognitive control refinements occur. This likely stems from the inherent inability of fMRI to speak directly to neural mechanisms. Developmental fMRI studies, which have primarily focused on lateral prefrontal cortex, have shown both increases and decreases in the blood-oxygen-level dependent (BOLD) signal between groups during control tasks, likely resulting from inhomogeneous tasks and different classification of age groups13. Here, we address these limitations by rigorously
we probe changes in brain network function by using MEG as a complementary tool to fMRI, capitalizing on the excellent temporal resolution of MEG. This approach affords us the ability to probe connectivity and oscillatory mechanisms underlying cognitive control development at frequencies relevant to inter-regional communication at the timescales from which control constructs emerge (i.e., milliseconds). As such, the central aim of this dissertation is to directly address potential network and oscillatory mechanisms underlying the development of cognitive control through adolescence.
1.3 A NETWORK APRROACH TO BRAIN ANALYSES
In 1995, Biswal and colleagues noted that spontaneous BOLD oscillations in the ultra-slow frequency domain (0.01-0.10 Hz) were highly correlated in time between the left and right primary motor cortices while subjects were not engaged in any particular task14. Highly
synchronized ultra-slow frequency oscillation between disparate regions of the brain have come to be termed resting-state networks. Since 1995, resting state BOLD activity has been used to determine networks of correlated BOLD oscillations, including sensory networks, such as the visual network, as well as cognitive networks, such as the cingulo-opercular and fronto-parietal control networks15 and the brain’s default mode network16.
This conceptualization of brain functioning enabled the introduction of graph theoretical analyses to neuroscience, enabling neuroscientists to describe and quantify this high dimensional data, known as the human connectome17. As such, the brain can be conceptualized as a collection
of brain regions (nodes) and their temporal correlation (links). Network approaches are a powerful way to understand brain functioning for several reasons. First, measuring the statistical
dependency between the oscillations of each region and every other region enables analysis of data across regional, network, and whole-brain scales. Next, these approaches provide a common framework for understanding and simplifying spatiotemporal aspects of whole-brain oscillations across conditions of rest and task.
Much like human social networks, the brain is organized into a small-world topology; that is, a high degree of clustering, with sparse connectivity to other clusters. The segregation of brain regions with strong internal correlations into a cluster is referred to as a network. The way in which all nodes in the brain cluster into segregated networks is referred to as network organization. Analytically, the clustering of nodes into networks is often accomplished via ‘community detection’ algorithms (e.g., see refs18,19). The networks resulting from these
algorithms have proven to be highly reproducible across algorithms, parcellations, and scanning sites20–22.
Some nodes within a network only engage in strong correlations within the network, while others exhibit strong correlations to nodes of other networks as well. These nodes are said to display a high level of network integration23,24. Nodes engaging in a high level of network
integration are sometimes referred to as hubs. A similar network organization has been shown to be present in both the task state and resting state; however, patterns of coupling within and between networks are less static in non-random ways, such that they strongly predict patterns of co-activation across various task conditions25.
1.4 FUNCTIONAL BRAIN NETWORK DEVELOPMENT
Functional networks are apparent by 2 years of age26–29. Small-worldness is present throughout
childhood and adolescence, as in adulthood30. Within these small-world networks, the
organization of hubs has been found to be different in infancy compared to adulthood shifting from predominance in sensory to association cortex31,32. By childhood, the organization, number,
and connectivity of the hub architecture is at adult levels30,33,34. The relatively early stabilization
of hub architecture suggests a foundational architecture in network connectivity that provides a backbone for network integration. A proxy of increased integration has been demonstrated in increased resting correlation strength between prefrontal hubs and non-hubs regions from childhood to adolescence when adult connectivity is mostly reached30. This period of integration
parallels increases in white matter integrity of frontoparietal tracts35, engagement of top-down
networks supporting cognitive control36, and performance in cognitive control tasks11.
At the network level, cognitive control would be underlied by the effective integration of segregated networks supporting its components, such as those involved in inhibitory control, working memory, and performance monitoring. Initial studies investigating changes in segregation and integration found that children have a greater number of short-range connections and fewer long-range connections compared to adults, suggesting that with development there is a shift in predominance of local to distributed circuit engagement that may reflect increases in network integration34,37–39. These findings were subsequently undermined by the discovery that
in-scanner head motion, which is greater in children than adults, resulted in spurious effects that biased short-range connections40,41. In our first study, we address this issue and resolve the
organization of functional brain networks42 and quantitatively defining integration based on
network measures sensitive to network organization24,43. While this new approach has not been
applied, based on the reliance of cognitive control on distributed circuitries that incorporate disparate specialized networks, the prediction is that with developmental changes, network organization would mature relatively early in development, while integration would continue to strengthen into adulthood when cognitive control is at its peak.
It is becoming increasingly apparent that brain networks deviate from this mostly static state over the course of a typical resting state acquisition (i.e., within minutes), though the degree to which this is the case is debated44. Regardless, recent work in fMRI has shown that resting
state networks exhibit increased variability throughout development45,46. EEG studies further
support this notion, noting that signal complexity increases throughout childhood and adolescence47. That said, the frequency spectra contributing to this finding remain unsolved. In
Chapter 3, we will address this hole in the literature by analyzing the phase component of oscillations between large-scale networks. The ability for networks to integrate is an enduring aspect of network development, suggesting that communication across specialized networks may be a primary feature of age-related improvements in cognitive control. The studies within this dissertation will begin to uncover the mechanisms by which these network interactions contribute to refinements in cognitive control abilities.
1.5 BRAIN NETWORKS UNDELRYING COGNITIVE CONTROL
In 2003, Braver and colleagues used a mixed block-event related fMRI task switching paradigm to dissociate brain regions contributing to sustained cognitive control from those underlying
more transient cognitive control processes48. Results from this study concluded that the anterior
prefrontal cortex is involved in sustained control, while the superior parietal lobes are involved in more transient control. Several years later, Dosenbach and colleagues used graph theoretical techniques introduced to neuroscience by Sporns and colleagues and found these regions are core nodes of two distinct networks operating in parallel15,49. Specifically, the anterior prefrontal
cortex was a part of a broader network encompassing the anterior cingulate cortex, bilateral insula, and frontal operculum. This network of regions, coined the cingulo-opercular network, supports sustained cognitive control. Supporting transient aspects of cognitive control is the frontoparietal network, which includes the superior parietal lobes as core nodes of a broader network encompassing the dorsolateral prefrontal cortex, middle cingulate cortex, and inferior parietal lobes. One widely cited view of these networks is that they’re involved with tasks that are involved in many forms of cognition, including language, reading, math, and working memory. Therefore, these control networks are thought to play a critical role in domain-general task set initiation and switching (frontoparietal network) and sustained control (cingulo-opercular network).
Around the same time, Seeley and colleagues discovered another cluster of brain regions involved in the interface between bottom-up and top-down processes50. This cluster, referred to
as the salience network, comprised regions of the bilateral insula, anterior cingulate, dorsomedial nucleus of the thalamus, and several brainstem nuclei. Interestingly, these regions are some of the most common to appear in fMRI literature, ranging from tasks invoking cognitive control, as well as, those eliciting interceptive/autonomic responses, such as pain and empathy51 (Craig
2009). Both the anterior cingulate and anterior insula are anatomical hubs in the brain, projecting to both frontal and parietal cortices and also displaying a high degree of connectivity between
themselves52,53. These three networks are central components of cognitive control, but need to
operate while suppressing the default mode network which engages the medial anterior prefrontal cortex and posterior cingulate cortex, and supports a task-negative mind wandering state, rather than focused attention.
Functionally, the anterior cingulate and anterior insula play a critical role in cross-talk between functional brain networks. It has been shown that the anterior insula is a causal outflow hub, specifically acting as a ‘switchboard’ between functional networks, especially between the task-negative default mode network and task positive fronto-parietal network54.
Developmentally, the strength of both structural and functional between network connections from the anterior insula to the default mode network and the fronto-parietal network was shown to be significantly stronger in adults compared to children, indicting the flexibility of insular functioning in task switching between a task positive and task negative state may improve throughout adolescence55. However, the mechanism linking control network development and
adolescent improvements in cognitive control remain unclear.
1.6 OSCILLATIONS AND THEIR COMPONENTS: AMPLITUDE AND PHASE
Neural signals, whether measured directly or indirectly – as is the case in most human studies – are measured in the time domain. A measure of signal amplitude is obtained per unit of time. In fMRI, this time resolution is on the order of 1-3 seconds, while in MEG, this time resolution is on the order of milliseconds. Any time-varying signal, such as neural signals, that engages in periodic activity is oscillatory. Indeed, oscillations are an intrinsic property of populations of neurons56. To study a signal’s oscillatory components in greater details, the time-varying signal
can be decomposed into its frequency components (units = Hz) via frequency decomposition techniques (e.g., fast-Fourier transform) and/or time/frequency decomposition techniques (e.g., Morlet wavelets). The resulting oscillations filtered into a specific frequency or frequency range can then be described in terms of signal amplitude and phase.
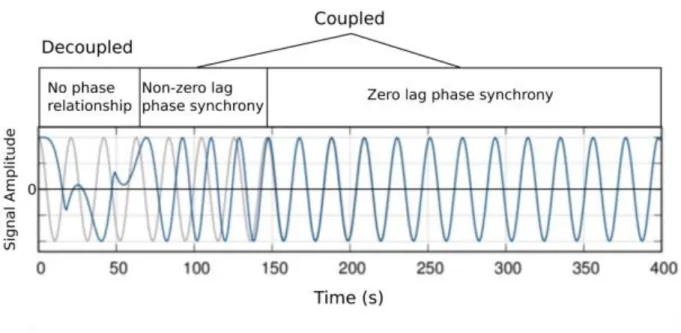
The strength of a neural oscillation at a given frequency is reflected in the amplitude of the oscillation, defined as the amount of deviation away from a baseline. Squaring this term results in the total amount of power for that oscillation. Stronger oscillations result in a greater deviation away from baseline (i.e., greater amplitude/power). The phase of an oscillation refers to the angle of the sinusoidal function of that oscillation (Figure 1). The phase angle within a group of neurons has been shown to affect the likelihood of spike output from a sending group of neurons and sensitivity of input in a receiving group57.
Figure 1. Oscillatory components: amplitude and phase
phase-regions over time. PLV ranges from 0 to 1, representing a random phase relationship and fixed phase relationship, respectively. Regional interactions exhibiting a high PLV indicate a relatively low level of variability, while interactions exhibiting a low PLV indicate a relatively high level of variability58.
Oscillations in the beta/gamma (14-80Hz) band have been shown to play a critical role in enabling local neuronal synchronization, while alpha/theta (4-14Hz) band oscillations have been shown to be critical for long-distance integration59,60. Specifically, long-range frontoparietal
interactions during working memory retention and mental imagery evolved most strongly in the theta and alpha (4-14Hz) frequency range61,62. As such, cortical oscillations could play a central
role in synaptic pruning, supporting the temporal coordination and specification of local and long-distance connectivity63. Indeed, evidence has begun to emerge from
electroencephalographic literature that the precision of temporal coordination, as measured by the co-fluctuation of the phase of neural populations, continues to increase throughout childhood and adolescence across several frequency bands, including theta-, beta-, and gamma-bands while subjects are engaged in a task64. However, it is still unknown how phase relationships between
brain networks develop at rest when oscillations are not locked to an external cue. In sum, at the core of cognition is a dynamic communication structure enabling rapid, coordinated interactions between disparate regions of the brain. Viewed in this way, networks and their oscillations provide a valuable avenue for the assessment of normative brain development65.
1.7 MECHANISMS UNDERLYING IMPROVEMENTS IN COGNITIVE CONTROL: A MODEL
Recent evidence supports the notion that the integration of existing large-scale brain networks subserving cognitive processes underlies mature cognitive control. For example, integration between the cingulo-opercular (CO) network, which subserves task-set maintenance, and the fronto-parietal (FP) network, which underlies trial-by-trial updating, increases with working memory demands66. Furthermore, performance in adolescence is associated with greater
interactions between these cognitive control networks and the default mode network67,68.
We recently proposed a novel model of a network-based mechanism for improved cognitive control abilities throughout development69. We postulate that underlying the
maturation of cognitive control is the strengthening of the dynamic interaction of neural systems supporting cognitive control including: working memory, inhibitory control, and performance monitoring. This model of control shares features with a recently proposed model of cognitive control, relying on context-dependent, cross-component interactions70. The components of
cognitive control (inhibitory control, performance monitoring, and working memory) are composed of both distinct and overlapping brain regions (Figure 2). Indeed, these three components compliment one another and rarely is one used but not the others71. Distinct regions
within each component represent those that have greater segregation predominantly participating in a specific component of cognitive control. In contrast, other regions that overlap across components play a more integrative role, allowing for more flexible and coordinated activity between components. Each pairwise relation between regions carries some connectivity weight (representing the degree of correlation), which is modulated by the current task state.
facilitate goal achievement) would be reinforced, while connections leading to unsuccessful or inefficient outcomes would be pruned leading to specialization within and between network connectivity in adulthood. During a task-state, this maturation would result in decreases in the variability of performance, while an increase in variability would be expected in the resting-sate, supporting increased flexibility. Over development, experience would strengthen connectivity patterns between components that would support timely and flexible engagement of cognitive control45,72,73.
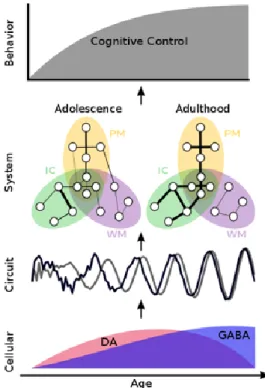
Figure 2. A model of the maturation of cognitive control.
At the cellular level, DA (red) and GABA (blue) systems undergo dynamic changes throughout adolescence. We propose that maturational neurotransmitter changes during adolescence lead to increased signal-to-noise, power, and synchrony in the cortex at the circuit level when control systems are engaged during a task. These changes in maybe unique in cortical
regions underlying cognitive control. These circuit level changes lead to systems-level alterations of distributed connectivity patterns depicted for inhibitory control (PM = performance
monitoring; IC = inhibitory control; WM = working memory). Circles represent brain regions, and lines between them indicate a pair-wise connection. Line thickness represents connection strength. Circles within overlapping networks, represent highly integrative regions. Connections that lead to successful performance are strengthened by adulthood, while connections that do not,
are weakened and/or pruned. Taken together, these developmental changes, occurring across multiple levels of brain function, contribute to mature cognitive control behavior.
1.8 DEVELOPMENT OF TASK SWITCHING
Switching between components of cognitive control is a central feature of the model explained above. Two types of flexibility associated with task switching have been previously defined: instructed flexibility and adaptive flexibility. Instructed flexibility involves subjects adapting their behavior based on changing task rules, while adaptive flexibility requires subjects to infer rules based on feedback, as in the Wisconsin card-sorting task. Here, our paradigm focuses on instructed, cue-based flexibility. The neural and behavioral cost of switching has been shown to be greater in adolescence than in adulthood. Behaviorally, though more pronounced in children, adolescents incur a greater switch cost (i.e., increased reaction times when comparing switch trials within a block to non-switch trials within the same switch block74 than adults), indicating
immaturities in temporal aspects of component interactions. To determine the neural correlates of these behavioral changes with age, Rubia and colleagues implemented fMRI and a response-switching paradigm in adolescence (10-17yrs) and adults (20-43yrs) in which subjects were presented with a grid divided into four squares, with either a vertical or horizontal bidirectional arrow in the middle of the grid75. Trials began with a red dot appearing in one of the four
quadrants. When the bidirectional arrow was vertical, subjects had to determine whether the dot was in the top or bottom of the grid. Conversely, when the arrow was horizontal, subjects were instructed to indicate whether the dot was on the left or right side of the screen. When contrasting switch to non-switch trials, these researchers found areas of the inferior frontal, posterior parietal, and anterior cingulate cortices were significantly more active (as measured with BOLD) in adults compared to adolescents. Similar regions were shown to display this same developmental profile in a subsequent study76.
1.9 SUMMARY AND OVERVIEW
Adolescence is a significant period of cognitive development characterized by the specialization of interacting brain systems. The oscillatory network mechanisms underlying the reliable engagement of cognitive control remain elusive. This proposal aims to elucidate the spatiotemporal large-scale network mechanisms contributing to more reliable, adult-like engagement of cognitive control.
In Chapter 2, we characterize the spatial aspects of large-scale network topology contributing to the developmental improvements in cognitive control, specifically network organization and network integration. Chapter 3 seeks to understand the role of neural oscillations resting-state network development and how these dynamics relate to cognitive control development. Lastly, in Chapter 4 we analyze the role of oscillations in the developmental improvements in cognitive control, specifically the ability to rapidly switch brain states to meet current cognitive demands. To this end, we have developed a novel cognitive control task, requiring subjects to switch between more automatic and inhibitory control processes. Together, the experiments contained within these aims will allow us to better understand the spatiotemporal network and oscillatory mechanisms underlying the remarkable improvement in cognitive abilities from adolescence to adulthood.
2.0 THE CONTRIBUTION OF NETWORK ORGANIZATION AND INTEGRATION TO THE DEVELOPMENT OF COGNITIVE CONTROL
2.1 BACKGROUND
Cognitive control is the ability to execute voluntary, goal-directed behavior77–79. It requires
flexible and adaptive coordination of core executive systems that are supported by integration among by widely distributed, specialized brain circuitries10. The core components of cognitive
control are available early in development80. However, in adolescence cognitive control abilities
become significantly more reliable and flexible, as response accuracy and speed stabilize in adulthood81. These developmental gains in information processing occur in parallel with brain
maturational events, including synaptic pruning82 and myelination83, which predominantly
enhance collaboration among brain systems84. The nature of the interaction between brain
network maturation and cognitive development during adolescence is not well understood7,
limiting our ability to understand the neural basis of psychopathology that emerges at this time, many of which are characterized by deficits in cognitive control85.
Characterizing functional brain network interactions during the resting state (i.e., while the subject is not engaged in any particular task) has become a valuable emerging approach for investigating the brain basis of cognitive development. Studies using this approach have revealed roles for these networks in supporting cognitive control10,15. Approximately 20 functional
networks have been identified in the functional connectome86, including sensorimotor networks,
such as the somatomotor (SM) and visual networks; cognitive networks, such as the fronto-parietal (FP) and cingulo-opercular/salience (CO/Salience) networks; and a task-negative default mode (DM) network 21. Each functional network operates as a module within the full
connectome. Networks are demarcated by dense internal connectivity18,87, defining a
foundational organization for the functional brain. Thus, network organization refers to the network affiliation of each region of the connectome. Initial studies characterizing age-related changes in functional network organization suggested that the organization of these networks continued to change into adulthood88, such that development proceeded from short-distance
anatomical networks in infancy and childhood, to long-range, widely distributed networks in adulthood39,88–90. However, age-related differences in head motion artifacts may have
confounded the connectivity distance findings40,41,91. Advances in data processing methods40,41,91,
and recent findings suggest that foundational aspects of functional network organization are established early in development, while processes related to network integration continue to mature into adulthood92. Network integration refers to the level of functional coupling between
networks, measured by participation coefficient (PC), a graph theoretical construct23. PC is a
particularly useful construct to measure network integration, given its sensitivity to between-network connectivity, while maintaining robustness to the total number of connections (degree). Degree-based measures of integration have been shown to be dependent on the size (number of nodes) in a network and therefore can skew results towards a greater number of hubs within larger networks, such as the default mode network24. Participation coefficient is normalized by
the degree of the node. As a result, increases in participation coefficient are driven by increases in the number of between-network connections.
Properties of network organization and integration could parallel cognitive development, which is characterized by enhanced adaptive and flexible integration of mature core control components. Thus, in the present study, we sought to identify whether age-related changes in functional networks are determined by changes in network organization and/or network integration and whether these changes are related to developmental improvements in cognitive control. We applied graph theory93,94 to a rich developmental resting-state functional magnetic
resonance imaging (RS-fMRI) dataset obtained in 10-26 year olds who also performed the antisaccade task, a robust developmental measure of cognitive control.
Given that core cognitive components are on-line by childhood and that the ability to adaptively and flexibly engage these components improves into adulthood95–99, we hypothesized
that network organization, which supports component processes, would not change with age, but that network connectivity strength and integration, which both support interaction between components, would strengthen with age. In turn, we hypothesized increased control network integration would predict age-related improvements in cognitive control as measured by the antisaccade task.
2.2 METHODS
2.2.1 Subjects
One hundred ninety-five subjects aged 10 – 26 years participated in this study (Table 1 in section 2.3.1). Written informed consent was obtained from every subject and minors did sign assents. A phone screen questionnaire was used to assess medical history and history of psychiatric
disorders. As determined through the interview process, neither subjects nor their 1st degree
relatives included in this study currently or previously had any neurological disease, brain injury, or diagnosed psychiatric illness. Substance use was assessed using the drug use and history questionnaire. Subjects included in this study were free from substance use/abuse. A post-scan questionnaire was used to inquire if subjects had fallen asleep. Sixteen subjects reported periods when they may have briefly drifted into sleep but none reported sleeping throughout the entire resting state scan. Data from three subjects were discarded due to excessive head motion. Therefore, we report data from 192 subjects. While age was considered as a continuous variable, some analyses considered developmental stages by binning ages after first sorting individual subjects by age, similar to methods used in the past to characterize changes in childhood (n=41 10-12 year olds), early (n=41 13-15 year olds) and late adolescence (n=53 16-19 year olds), and adulthood (n=57 20-26 year olds).
2.2.2 Task Design
The antisaccade task was performed by subjects outside of the MR scanner on a separate day from the MR visit. For a full description of the antisaccade task used, see100. Briefly, neutral
trials were extracted from an incentivized antisaccade task, consisting of reward, loss, and neutral trials. There were a total of 40 of each trial type. Each neutral trial began with a white central fixation, which then turned red for 1.5 sec, prompting subjects to prepare a response. Next, a peripheral stimulus (yellow dot at approximately 0.5 degree/visual angle) appeared at an unpredictable location on the horizontal meridian (± 4 and 8 degrees/visual angle) for 1.5 sec. Subjects were instructed to inhibit making a saccade towards the stimulus, and instead to saccade
E-Prime (Psychology Software Tools, Inc., Pittsburgh, PA) and ASL (Applied Science Laboratories, Bedford, MA) eye tracking software. A script detected if at any time during the first 1000 ms a subject made a saccade to the stimulus or if no eye movement was generated. An auditory tone (1163 Hz) was played for 400 ms if the subject made a saccade to the stimulus. If the subject made a correct saccade a “cha-ching” sound (1516 Hz) was presented for 400ms. Correct responses were defined as those in which the first eye movement in the saccade was directed toward the mirror location at a velocity greater than or equal to 30/s101 and extended
beyond a 2.5 /visual angle from the central fixation. A response was considered incorrect when the first saccade was directed towards the target beyond a 2.5 /visual angle from central fixation, but were subsequently directed to the hemifield opposite the target, similar to previously published work100.
2.2.3 Eye Tracking
In addition to the on-line scoring, eye data were scored offline by a technician for various saccade metrics, including correct trials and errors, as well as saccade latency, using ILAB software101 and an in-house scoring suite written in MATLAB (Math Works, Inc., Natic, MA). A
correct antisaccade response was one in which the first saccade following stimulus onset was towards the mirror location of the stimulus and extended beyond a 2.5 degrees/visual angle central fixation zone. Errors were defined as occurring when the first saccade following stimulus onset was directed towards the stimulus and extended beyond central fixation.
2.2.4 MR Data Acquisition
Data were acquired using a 12-channel Siemens 3T Tim Trio at the University of Pittsburgh Medical Center Magnetic Resonance Research Center. The resting-state scan was acquired at the end of the scanning session and was always at the same time of acquisition for all subjects. For each subject, we collected 300 seconds (200 TRs) of resting-state data. Structural images were acquired using a sagittal magnetization-prepared rapid gradient-echo sequence (repetition time [TR] = 1570 ms, echo time [TE] = 3.04 ms, flip angle = 8°, inversion time [TI] = 800 ms, voxel size = 0.78125 × 0.78125 × 1 mm). Functional images were acquired using an echo-planar sequence sensitive to BOLD contrast (T2*; TR = 1.5 s, TE = 29 ms, flip angle = 70°, voxel size =
3.125 × 3.125 mm in-plane resolution, 29 contiguous 4-mm axial slices). During the resting-state scan, subjects were asked to close their eyes and relax, but not fall asleep.
2.2.5 RS-fMRI Preprocessing
Functional images were preprocessed using AFNI102 and Freesurfer103. Standard preprocessing
steps were completed, including: (1) normalization based on global mode, (2) wavelet despiking104, (3) simultaneous multiple regression of nuisance variables from BOLD data and
bandpass filtering41 at 0.009 Hz < f > 0.08, and (4) spatial smoothing using a 6 mm full-width at
half-maximum Gaussian blur. Given the Power parcellation used within this study models regions of interest as 10mm spheres, we decided to use smoothing to increases SNR. The canonical networks derived from this parcellation have been shown to not be influenced by spatial smoothing21. Freesurfer was used to segment gray matter, white matter, and ventricular
interest (ROIs), six head realignment parameters obtained by rigid body head motion correction, and the derivatives of these signal and parameters. In addition to wavelet despiking, we removed any remaining high motion volumes via a scrubbing procedure40,91. For the original 195 subjects,
we calculated two quality control measures with respect to head motion, volume-to-volume frame displacement (FD) and the RMS derivative of fMRI time series (DVARS). We censored and removed volumes in individual subjects that had an FD > 0.5 mm and DVARS > 5, as well as the frame preceding the motion artifact and the two subsequent frames. FD is calculated on the original motion time series (i.e., before motion correction with wavelet despiking). On the other hand, DVARS is calculated after motion correction with wavelet despiking. Large DVARS values after wavelet despiking would indicate motion/artifact-related noise in the global signal (i.e., brain-wide change from one volume to the next) still remained after despiking, which we did not observe (Table 1: note DVARS after wavelet despiking is considerably lower in all 4 groups than DVARS calculated prior to wavelet despiking). Because we collected 300 seconds of data, subjects were dropped entirely if > 20% of their volumes were removed, leaving the minimum amount of rest data for any subject 240 seconds. This procedure resulted in the removal of three subjects from further analyses. Of the remaining 192 subjects, only four did not contain a full 300 seconds of data.
2.2.6 Functional Network Parcellation
For each subject, nodes (n=264) were defined from the functional parcellation derived by Power and colleagues21. Coordinates were derived through fc-Mapping105,106 and a meta-analytic
of voxels within each ROI were averaged and then correlated to produce a 264x264 correlation matrix for each subject. Any comparisons made between correlations were transformed to z values using Fisher z(r) transformation, and then reconverted to Pearson r values for reporting and visualization.
2.2.7 Individual and Group Correlation Matrices
Network-level age-related changes were assessed using individual correlation matrices. For all other RS-fMRI analyses, age was treated as a categorical variable to assess stage-like developmental changes in graph metrics and changes in the distribution of connections between children (aged 10-12), early adolescents (aged 13-15), old adolescents (aged 16-19), and adults (aged 20-26). Notably, no standard for binning age groups over adolescence currently exists, though binning roughly follows Luna and colleagues11. Since short-distance correlations
(Euclidean distance < 20mm) can arise from artifacts40, these connections were not included in
tests for age-dependent significant strength changes in connectivity.
2.2.8 Network Detection and Comparison
Since there is no ideal, biologically salient threshold that definitively defines functional networks, we explored a range of network densities from 1-25% to avoid any thresholding bias. Results involving participation coefficient at the group level reflect values that are averaged across all network densities to remove any bias of a single threshold. For a representative network assignment, we chose a network density of 10%, since this threshold results in meaningful network organization (i.e., 5 networks), while maintaining full connectedness.
Importantly, we did not impose network assignments according to21, since that would erode the
ability to make conclusions concerning developmental changes in network organization.
To define and examine the developmental trajectory of functional network organization, we partitioned the full connectome of 264 ROIs into functional networks using Newman’s Q-metric coupled with an efficient optimization approach proposed by Blondel et al.18,19,107.This
method has been verified to be one of the best-performing community detection algorithms of undirected networks108. Furthermore, unlike recent community detection approaches, Newman’s
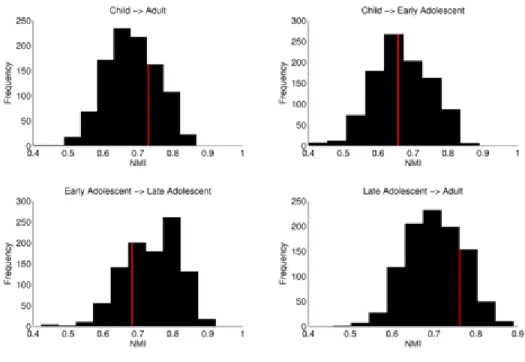
algorithm does not include a gamma parameter for the biasing of larger vs. smaller modules. Therefore, the only input to the algorithm was the adjacency matrices. We then calculated normalized mutual information (NMI) to determine the level of similarity between network assignments across age groups, with values closer to 0 indicating dissimilar network assignments and values closer to 1 indicating similar assignment. We permuted the labels of individual matrices between contrasts 1000 times to generate a null distribution of NMI values for each contrast. Matrices between groups were randomly shuffled and partitioned into functional networks, and NMI was calculated. Upon the finding that the observed NMI values fell within one standard deviation of the mean of the null distribution, we executed a leave one out cross validation to generate a distribution of observed NMI values for the following analysis. Because conventional significance testing does not allow stating evidence in favor of null findings, we implemented a Bayes factor alternative109 to compare the observed NMI distribution with the
null distribution. Values greater than 1 indicate the likelihood of stable functional network organization is ‘n’ times more likely than the likelihood of developmental changes in functional network organization.
2.2.9 Connectivity Strength Changes during Adolescence
A general concept in the development of functional networks is that they develop from “local to distributed”88. To test this hypothesis, given methodological improvements for head motion and
a denser, more representative functional network21, we contrasted connectivity values from
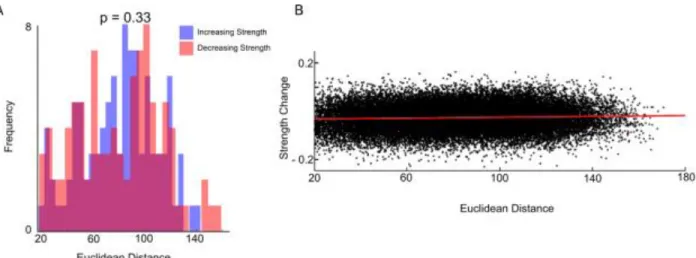
averaged weighted matrices in children versus adults for each ROI-ROI pair. Euclidean distance was also calculated for each pairwise relation. We then performed a simple linear regression with distance as a predictor of change in connectivity strength between the children and adult matrices.
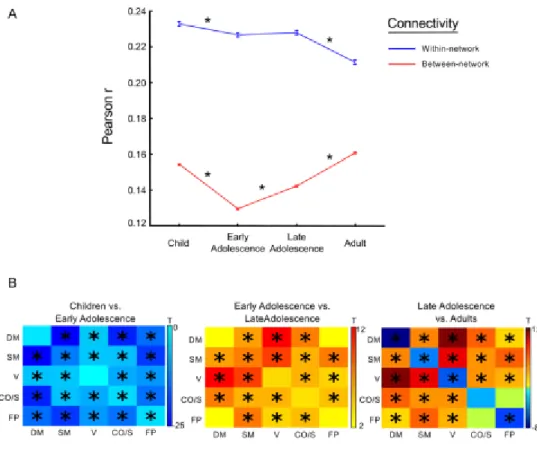
We also addressed changes in connectivity strength as a function of within- and between-network interactions. First, within each group-averaged matrix, we averaged all within-between-network pairwise relations and all between-network pairwise relations, separately. We then performed a two-tailed t-test for each consecutive age contrast. We then wanted to test for significant increases or decreases in connectivity with respect to specific network interactions. To this end, within each group-averaged matrix, the average connectivity strength was calculated for each network. We then tested each combination of within-network (e.g., DM/DM network) and between-network (e.g., DM/FP network) interactions to determine significant increases or decreases in connectivity strength between consecutive age groups. For each comparison, we ran a two-tailed t-test to determine significance (Bonferroni corrected for multiple comparisons).
2.2.10 Developmental Changes in Participation Coefficient at the Network Level
For each subject, we partitioned the full network into sub-networks imposing the community assignments from the adult group in the analysis outlined above, and subsequently calculated
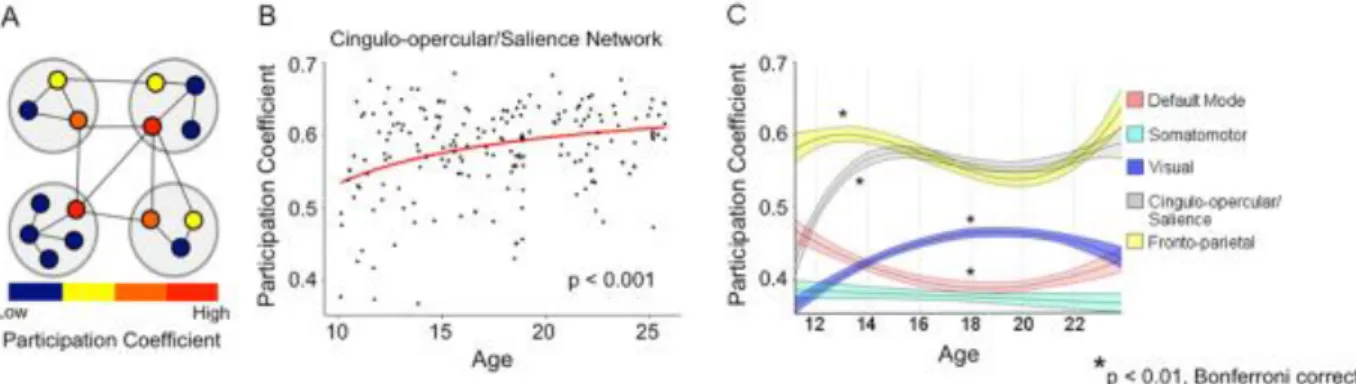
participation coefficient for every node within each group. Participation coefficient (PC) is a graph measure quantifying the degree to which a node engages in inter-network communication23,24. Higher PC indicates more distributed between network connectivity, while a
PC of 0 signifies a node’s links are completely within its home network (within network). Nodal participation coefficients were then averaged within each network and were tested for significant age-related effects using linear and inverse models.
2.2.11 Long-Term Fluctuation in Network-level Participation Coefficient
To determine any long-term fluctuations in participation coefficient that may not be captured at the individual subject data, we calculated average subject correlation matrices using a moving average approach, used previously in functional brain network data88 and commonly used in
economics research. Averaged group matrices were formed using a moving average of age-ordered subjects (e.g., group1: subjects 1-30, group2: subjects 2-31, … group163: subjects 163-192), thus generating 163 groups of 30 subjects in each group. Each group matrix was then parcellated according to the adult network assignment and PC was calculated for each ROI within each group. For each group, the PC for ROIs within a network were averaged and plotted as a function of age.
2.2.12 Relating Changes in Integration to the Development of Inhibitory Control
To test the hypothesis that the relationship between age and performance (accuracy and RT) on the antisaccade task is moderated by integration of the CO/Salience network with other functional networks, a hierarchical multiple regression analysis was conducted separately for
accuracy and reaction time. If a significant interaction was observed, age groups were binned into the four age groups previously defined and a median split of the averaged participation coefficient within the CO/Salience network was conducted. Within each bin, we tested for significant differences in RT using a t-test between high and low PC groups and corrected for multiple comparisons using the Bonferroni method.
2.2.13 Identifying Specific Nodes Increasing in Participation Coefficient
We sought to discover brain regions that significantly increased in the ability to integrate information from widespread functional networks using graph theory. PC was calculated for each node within each categorical age group. Importantly, the degree, or number of links a node has, was not considered as a metric for integration since network measures that are degree-based have recently been called into question in Pearson correlation RS-fMRI networks24. PC for each
node was contrasted between each set of chronological age groups (children vs. early adolescents, early adolescents vs. late adolescents, and late adolescents vs. adult) and between adults and children by subtracting the younger group’s PCs from the older group’s PCs resulting in four total contrasts. Permutation tests were conducted on each node to test nodes for significant changes in PC. To generate a null distribution of PCs for each node, subject labels were randomized within groups 1000 times and PC was calculated for every node in each run. Contrasts between age groups were then generated by subtracting the PCs for each node for the younger group from the older group. This process was repeated for each age contrast. Significant increase or decrease in participation coefficient for a node was Bonferroni corrected for multiple comparisons.
2.2.14 Age-related Changes in the Distribution of Regional Participation Coefficient
Within each group, and for each node that significantly increased in participation coefficient, we calculated the degree of the ROI to each network, including its ‘home’ network, and then contrasted these values for consecutive age groups for comparison. The degree of a node is determined by the number of links a node has. This approach allowed us to contrast the distribution of links to each network between consecutive age groups (i.e., within-network vs. between-network connectivity). This approach affords the ability to characterize the driving factor(s) behind the observed significant increases in PC.
2.2.15 Computations and Visualizations
AFNI102 and Freesurfer103 were used to process MRI images. We used the Brain Connectivity
Toolbox94 in MATLAB (The Mathworks, Natick, MA) for network computations and statistical
testing. For brain visualizations, we used the BrainNet Viewer110.
2.3 RESULTS
2.3.1 Development of Functional Network Organization
We used a previously defined functional connectome parcellation of 264 functional regions of interest (ROIs) across cortical, subcortical, and cerebellar structures21 in a sample of 192
each ROI with that of every other ROI. We then formed group matrices by averaging each subject’s connectivity matrix within categorical age groups (10-12; 13-15; 16-19; and 20-26 year olds) (Figure 3A). For each group, we partitioned the full functional connectome into modules using Newman’s Q-metric coupled with an efficient optimization approach18,19,107 across network
densities ranging from the top 1% to 25% of pair-wise correlations in terms of correlation strength. Notably, Newman’s Q-algorithm returns modules of densely interconnected nodes. We interpret these modules as being functionally connected collections of brain regions sub-serving common functions and therefore refer to them as functional brain networks. The representative network partition of the full connectome was thresholded at a density of 10% (Figure 3A) to partition the network into a meaningful structure while maintaining high connectedness, which would be limited with lower thresholds. This approach identified more comprehensive networks compared with those incorporating lower thresholds21, such that a single network encompassed
the cingulo-opercular, subcortical, and salience networks. We refer to this network, which includes regions critical to cognitive control, as the CO/Salience network.
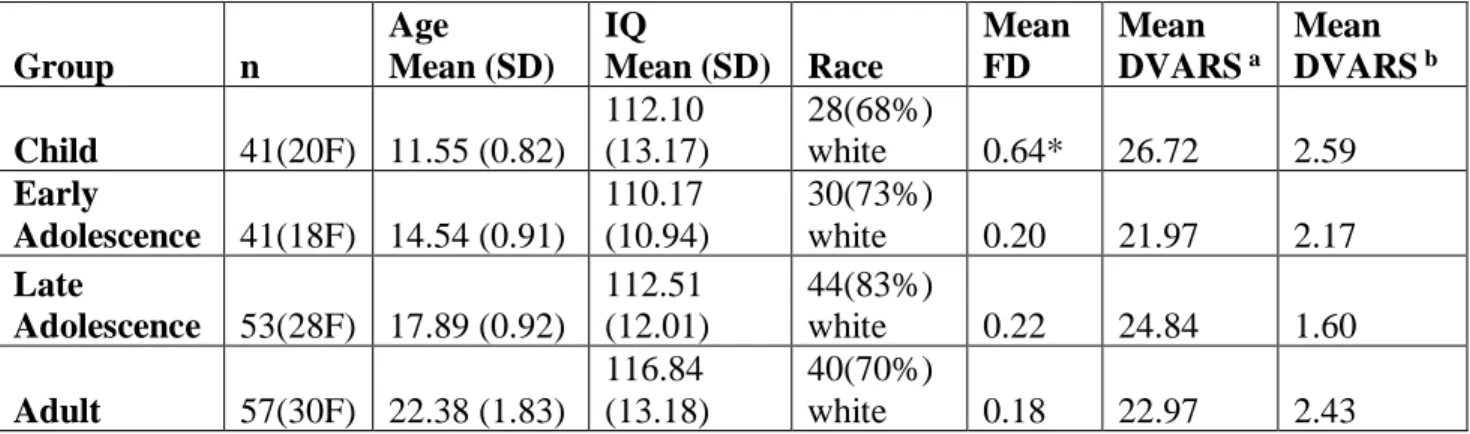
Table 1. Demographics
a DVARS calculated prior to wavelet despiking
b DVARS calculated on motion time series after wavelet despiking. Large decreases indicate wavelet despiking was effective in mitigating head motion confounds.
* Mean FD was significantly greater in the child group compared to each other age group (p < 0.05, Tukey’s HSD corrected for multiple comparisons). A one-way analysis of variance (ANOVA) was conducted between groups for mean DVARS before wavelet despiking (Mean
DVARS a) and again between groups after wavelet despiking (Mean DVARS b), with no
significant differences observed in either test (p > 0.05). Note FD is calculated prior to our motion correction procedure while the final DVARS values (Mean DVARs b) are calculated after
our motion correction procedure.
Group n Age Mean (SD) IQ Mean (SD) Race Mean FD Mean DVARS a Mean DVARSb Child 41(20F) 11.55 (0.82) 112.10 (13.17) 28(68%) white 0.64* 26.72 2.59 Early Adolescence 41(18F) 14.54 (0.91) 110.17 (10.94) 30(73%) white 0.20 21.97 2.17 Late Adolescence 53(28F) 17.89 (0.92) 112.51 (12.01) 44(83%) white 0.22 24.84 1.60 Adult 57(30F) 22.38 (1.83) 116.84 (13.18) 40(70%) white 0.18 22.97 2.43
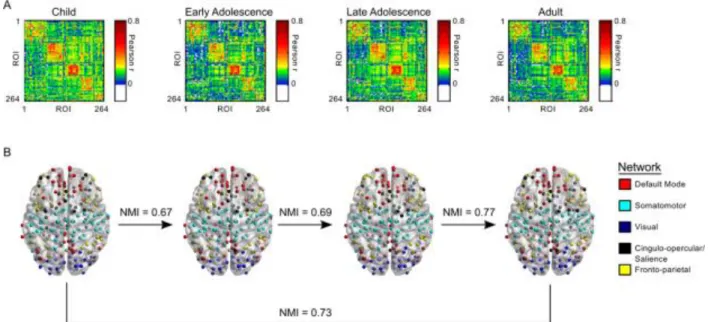
Figure 3. Development of network organization.
(A) Group averaged correlation matrices organized according to network affiliation. ROI order is consistent across all 4 groups. (B) Regions of interest imposed on a semitransparent brain Normalized mutual information (NMI) is a measure of similarity between two sets of data. Here, NMI refers to the comparison between two sets of network affiliation vector between each
consecutive age group and between children and adults.
We tested changes in network organization using normalized mutual information (NMI), which measures the mutual dependence of two variables (i.e., how much information in variable one is also contained in variable two). NMI values range from 0 to 1. A value of 0 indicates no mutual dependence (no shared information), while a value of 1 indicates complete dependency (completely shared information). We calculated NMI for networks between consecutive age groups and between children and adults (Figure 3B). We used a random permutation test to compare observed NMI values to a null distribution of 1000 NMI values. For the adult vs. child