Development of Bioinformatic Tools for
Retroviral Analysis from High
Throughput Sequence Data
Dissertation
zur Erlangung des Grades eines Doktors der
Naturwissenschaften (Dr. rer. nat.)
am Fachbereich Mathematik und Informatik der
Freien Universit¨
at Berlin vorgelegt von
Ulrike L¨
ober
Datum der Disputation: 18.06.2019 Erstgutachter:
Prof. Dr. Knut Reinert, Freie Universit¨at Berlin, Deutschland Zweitgutachter:
“Nothing in Biology Makes Sense Except in the Light of Evolution” Theodosius Dobzhansky (March 1973)
Preface
Comprehensive profiling of retroviral integration sites using target enrichment methods from historical koala samples without an assembled reference genome
The work presented in Chapter2was published in the journal PeerJ under peer review. As part of this project, I developed the bioinformatics pipeline to detect viral insertion sites from highly degraded DNA. Furthermore, I helped conceive and design the experiments, analyzed the data, co-wrote the paper, prepared figures and tables and reviewed drafts of the paper.
Cui, P., L¨ober, U., et al. (2016). Comprehensive profiling of retroviral integration sites using target enrichment methods from historical koala samples without an assembled reference genome. PeerJ 4, e1847 [1].
Degradation and remobilization of endogenous retroviruses by recombination during the earliest stages of a germline invasion The work presented in Chapter
4was published in the journal Proceedings of the National Academy of Sciences (PNAS) under peer review. In the context of this project, I helped conceive and design the experiments, analyzed the data, co-wrote the paper, prepared figures and tables and reviewed drafts of the paper. https://doi.org/10.1073/pnas.1807598115
L¨ober, U., et al. (2018). Degradation and remobilization of endogenous retro-viruses by recombination during the earliest stages of a germ-line invasion. PNAS 201807598. [2]
SIP: A Sonication Based Inverse PCR Methodology for the Genome-Scale Analysis of Retroviral Integration Sites and Provirus Characterization The work presented in Chapter 3 is in preparation for submission. As part of this project, I developed the bioinformatics pipeline to detect viral insertion sites from PacBio reads. Furthermore, I analyzed the data, prepared figures and tables, and wrote and reviewed drafts of the paper.
Alquezar-Planas, D.E., L¨ober, U., Cui, P., Quedenau, C., Chen, W. and Green-wood, A.D. (submitted). SIP: DNA Sonication Inverse PCR for Genome-Scale Analysis Integration Sites. [3]
Abstract
For hundreds of millions of years, retroviruses have been integrating into genomes of vertebrates [4]. This thesis contributes to the development of new methods for retrieval, characterization and the comparison of viruses that have integrated into the genome (endogenous retroviruses, or ERVs) and their integration sites in host genomes. The koala retrovirus is an outstanding study subject since it is currently in the transition from an exogenous to an endogenous retrovirus.
In the past decades, high-throughput sequencing (HTS) has allowed scientists to in-vestigate genomic data at high coverage and low costs. However, the development of new sequencing technologies facilitated the production of vast amounts of data. The analysis bottleneck has shifted from data production to the analysis of so-called “big data”. In consequence, new algorithms and pipelines need to be established to process biological data. Solutions for automated handling of short-read HTSdata exist for many problems and can be improved and extended. Recent improvements in HTS resulting in longer sequence fragments have helped solve problems connected to short-read sequencing but produced new challenges for genomics data processing.
In this thesis, I present pipelines to comprehensively profile endogenous retroviruses from short-read HTSdata for museum koala samples (ancient DNA) and describe a new method to amplify retroviral integration sites facilitating long-read HTS. The thesis is divided into five sections. In the first part, I describe the biological problem, the evolution of sequencing technologies, resulting in information technology problems and proposed solutions (chapter 1). In the second chapter, I present a comparison of three different target enrichment techniques to retrieve retroviral integration sites from museum koala samples. The computational pipeline I developed for this purpose is presented. In chapter
3 I describe a method (sonication inverse polymerase chain reaction) for target enrich-ment of long sequence fragenrich-ments to exploit the capacities of third-generation sequencing technologies. An analysis pipeline for the processing of sonication inverse PCR products was established. Moreover, remaining problems resulting from artificial read structures are discussed. In chapter 4 the method described in chapter 3 was used to profile koala retrovirus integrations. The striking discovery of a new retroviral recombinant in koalas is reported. Finally, I discuss our findings and compare short- and long-read HTS tech-nologies. An outlook for further applications and remaining computational problems is outlined.
Overall, this thesis contributes to the automated computational processing of HTS
Zusammenfassung
Seit Millionen von Jahren nisten sich Retroviren in den Genomen von Wirbeltieren ein [4]. Die hier vorliegende Dissertation zeigt neue Methoden zur Gewinnung und Analyse genomischer Sequenzen retroviralen Ursprungs und zum Vergleich retroviraler Integra-tionsstellen in Wirtsgenomen auf. Die Analysen werden am Beispiel des Koalaretro-viruses durchgef¨uhrt, da sich dieser im ¨Ubergang vom exogenen zum endogenen Retro-virus befindet. Die Erforschung des Endogenisierungsprozesses von Retroviren kann so untersucht werden.
Die in den letzten Jahrzehnten erzielten Fortschritte in der Hochdurchsatzsequen-zierung machen die Erzeugung von Sequenzierdaten mit relativ geringem Kostenaufwand m¨oglich. Die Entwicklung in der Sequenzierungstechnologie stellt durch die Produktion betr¨achtlicher Datenmengen und der damit verbundenen notwendigen Verarbeitung eine große Herausforderung dar. W¨ahrend zuvor labortechnische Aspekte die Kapazit¨aten von aufwendigen Sequenzanalysen limitierten, sind heute die Datenspeicherung und
-verarbeitung die begrenzenden Faktoren. In Folge dessen gewinnt die Entwicklung neuer Algorithmen und Pipelines zur Verarbeitung großer Mengen von biologischen Se-quenzdaten an Bedeutung. F¨ur Hochdurchsatzsequenzierungsdaten mit kurzen Frag-mentl¨angen sind bereits viele informationstechnologische Problemstellungen bearbeitet und gel¨ost worden. Es besteht der Bedarf an der L¨osung verbleibender Probleme und der Optimierung bereits entwickelter Algorithmen und Software. Durch die Evolution der Hochdurchsatzsequenzierung entstehen Rohdaten aus deutlich l¨angeren Segmenten, welche h¨aufig nicht oder nicht zufriedenstellend durch existierende Software verarbeitet werden k¨onnen.
In der vorliegenden Arbeit stelle ich verschiedene Pipelines zur Verarbeitung unter-schiedlicher Hochdurchsatzsequenzierungsdaten vor. Im ersten Kapitel gebe ich eine Einf¨uhrung in die biologische Fragestellung, beschreibe verschiedene Sequenzierungsmeth-oden und deren Entwicklung, sowie existierende informationstechnologische L¨osungen. Anschließend stelle ich in Kapitel2eine Arbeit vor, bei welcher ich eine Pipeline entwick-elt habe, um endogene Retroviren aus Koalaexponaten mit Hilfe von kurzen Sequenz-fragmenten zu vergleichen. Kapitel 3 behandelt eine neue Methode zur zielgerichteten Amplifizierung l¨angerer Sequenzfragmente, um die Vorteile neuerer Hochdurchsatzse-quenzierungstechniken auszunutzen. Auf der Grundlage dieser Methode habe ich eine Pipeline entwickelt, um endogene Koalaretroviren in einem 2014 verstorbenen Zookoala zu klassifizieren, wobei ein neuer rekombinanter Virus entdeckt und charakterisiert werden konnte. Die Vor- und Nachteile verschiedener Hochdurchsatzsequenzierungstechnologien, sowie ungel¨oste Probleme und ein Ausblick beinhaltet die Diskussion in Kapitel 5.
Zusammengefasst konzentriert sich die vorliegende Arbeit auf verschiedene Methoden zur automatisierten informationstechnologischen Verarbeitung von Hochdurchsatzdaten, zum Vergleich endogener Retroviren in Wirtsgenomen unter der Nutzung verschiedener Anreicherungs- und Sequenziertechniken.
Acknowledgment
This thesis is based on research conducted at the Leibniz Institute for Zoo and Wildlife Research. I would like to show my gratitude to Alex Greenwood for giving me the opportunity to work on these exciting projects, his advice, his patience, and his contagious enthusiasm. The fruitful discussions with you were enlightening, fascinating and open minded. The advice given by Knut Reinert has been a great help in conducting this thesis and evaluating technical approaches.
I would like to pay my regards to Anisha Dayaram and David Alquezar for all the experiments they have performed and for discussions. Sanatana, Daniela, John, Hanna, Sonia, Renata, Marcella, Anisha, David, and Niccolo, you were great company during the last years, it would not have been the same without you; thanks for the laughter, the ice-skating action, the moments we shared, the tears and everything which made the last years unforgettable. Thanks, are also due to Pin Cui, for performing experiments. I would like to express my gratitude to the people at BeGenDiv for hosting me once a week. I would like to thank my fellow doctoral student Peter Seeber for his feedback and friendship.
Special thanks to my high school teacher Ms. Hermann who awoke my interest in biology. I extend my gratitude to Stefanie Hartmann: you are the reason why I started studying bioinformatics. Your guidance is unrivaled, thank you for leading me the right way. I appreciate the feedback offered by Sofia Forslund and want to thank you for your patience.
Last but not least; Dear Mom and Dad, there are no words describing how thankful I am that you can experience this special moment with me. I know that this is a gift and instead of listing everything you mean to me or things I am grateful for, I just want to state that I love you and hope I can share some more time with you. Thanks to Sophie for your patience and backing during the last years, you encouraged me whenever I was close to surrender.
The financial support of the Forschungsverbund Berlin is also gratefully acknowl-edged.
Contents
1 Introduction 1
1.1 Retroviridae . . . 1
1.1.1 Endogenous Retroviruses . . . 2
1.1.2 Koala Retrovirus . . . 3
1.1.3 Hypothesis: Viral Insertion and Defense Mechanisms . . . 3
1.2 Sequencing Technologies . . . 4
1.2.1 Next/Second-Generation Sequencing . . . 4
1.2.2 Third-Generation Sequencing . . . 5
1.3 Bioinformatics Analysis of Sequencing Data . . . 7
1.3.1 Pairwise Sequence Alignment . . . 8
1.3.2 Multiple Sequence Alignment . . . 10
1.3.3 Sequence Mapping . . . 11
1.3.4 Sequence Clustering . . . 12
1.3.5 Tools and Pipelines for Retrieval of Retroviral Integration Sites . 13 1.4 Objective . . . 14
1.4.1 Retroviral Integration Sites . . . 14
2 Investigation of Koala Retrovirus in Museum Koala Samples 16 2.1 Characterizing Viral Integration Sites from Ancient DNA . . . 16
2.1.1 Comparison of Three Targeted Sequencing Methods . . . 17
2.1.2 Detection of the Koala Retrovirus from Illumina Short-Reads. . . 19
2.2 Results . . . 22
2.2.1 Target Enrichment Techniques for Integration Site Retrieval from Ancient DNA . . . 22
2.2.2 Comprehensive Profiling of Koala Retrovirus (KoRV) Integration Sites . . . 26
2.3 Discussion . . . 28
3 Sonication Inverse Polymerase Chain Reaction (SiP) 30 3.0.1 Laboratory Pipeline . . . 31
3.1 Methods . . . 32
3.1.1 Bioinformatic Analysis . . . 37
3.2 Results . . . 37
3.2.1 Development and Testing of SiP . . . 37
3.2.2 Evaluating SiP’s Library Length Distribution, KoRV Sequence En-richment and Off Target EnEn-richment . . . 39
3.2.3 SiP Blunt-End Adapter Ligation Efficiency and Blunt-End 454 DNA Library Adapter Ligation Experiment . . . 45
3.2.4 SiP Structure Variations . . . 48
3.3 Discussion . . . 48
3.3.1 Transposition of Inverse Polymerase Chain Reaction Products . . 51
3.3.2 Assembling Complete Proviruses at Genomic Loci . . . 52
4 Investigation of Koala Retrovirus in Modern Samples 54
4.1 Methods . . . 55
4.1.1 Koala Samples, PCR, and Sequencing. . . 56
4.1.2 Inverse PCR and PacBio Sequencing of “Bilyarra” to Determine
KoRV and recKoRV Sequences . . . 57
4.1.3 Bioinformatics Analysis . . . 59
4.2 Results . . . 62
4.2.1 The Advantages of Long Read Sequence Technology for Retroviral
Analysis . . . 62
4.2.2 Discovery of recKoRV1 [2] . . . 63
4.2.3 Other Recombinants Between KoRV and PhER . . . 64
4.2.4 Comparison of LTRs and Integration Sites Among Koala Genomes 70
4.2.5 Recombination Breakpoint Distributions Among Koala Populations 72
4.2.6 An Extended Analysis of the Geographic Distribution of recKoRV1 73
4.3 Discussion . . . 73 4.3.1 recKoRV Classification . . . 76 5 Conclusions 78 5.1 Resume . . . 78 5.2 Perspectives/Outlook . . . 79 A Appendix 81
List of Figures
1.1 Structure of an Endogenous Retrovirus . . . 3
1.2 PacBio Single Molecule Real Time Sequencing . . . 7
1.3 Schematic Hidden Markov Model . . . 13
2.1 Experimental Workflow for Three Target Enrichment Techniques [1] . . . 18
2.2 Primer Positions and LTR Structure for the Identification of KoRV Inte-gration Sites [1] . . . 20
2.3 Bioinformatics Pipeline for Targeted ERVs from Museum Samples . . . . 21
2.4 Sequence Length Distribution of Three Target Enrichment Techniques [1] 23 2.5 Expected Product Distribution of Target Enrichment Techniques. . . 24
2.6 Overview of Integration Sites from Ten Individuals Across Target Enrich-ment Techniques . . . 25
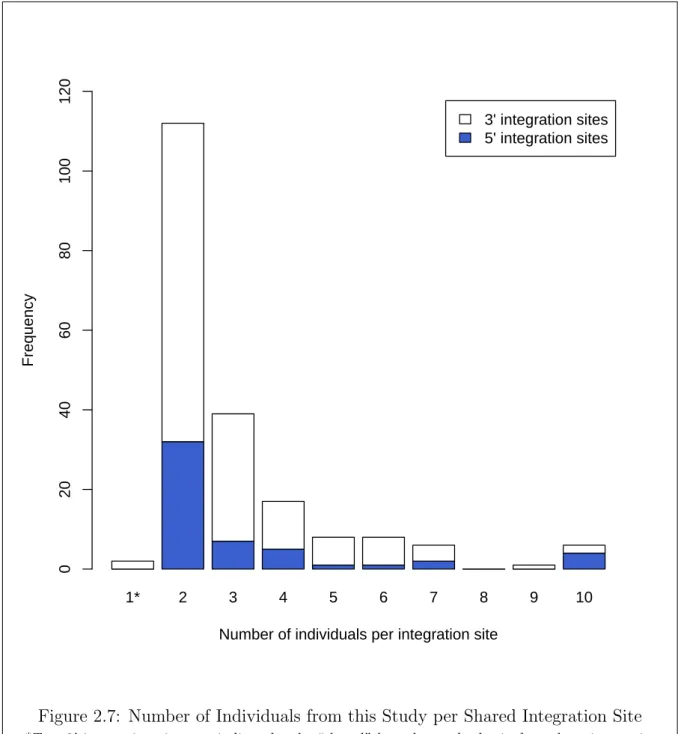
2.7 Number of Individuals from this Study per Shared Integration Site . . . 27
3.1 Sonication Inverse PCR Scheme [3] . . . 33
3.2 Inverse PCR Primer . . . 34
3.3 Experimental Workflow of Sonication Inverse PCR [3] . . . 38
3.4 Reads of Insert (ROI) Sequence Length Distribution [3] . . . 40
3.5 Adapter Long Off-Targets . . . 42
3.6 Adapter Short Off Targets . . . 43
3.7 Non-Adapter Long Off Targets. . . 44
3.8 Non-Adapter Short Off Targets . . . 45
3.9 Blunt-End 454 DNA Library Adapter Ligation Experimental Workflow [3] 47 3.10 Identified Structural Variants of SiP Sequences [3] . . . 49
3.11 Expected Structure of Inverse PCR Reads . . . 52
3.12 KoRV Integration Site Shared with Koala Reference Genome (KoRV 35) 53 4.1 Example of Read Mapping from Captured Forward KoRV Integration Site 63 4.2 Recombination Breakpoints of KoRV and PhER [2] . . . 64
4.3 Mapping KoRV Positive Reads to Breakpoint “Birke” bp12 . . . 66
4.4 Mapping KoRV Positive Reads to Breakpoint “Birke” bp13 . . . 66
4.5 Mapping KoRV Positive Reads to Breakpoint “Birke” bp14 . . . 67
4.6 Mapping KoRV Positive Reads to Breakpoint “Birke” bp16 . . . 67
4.7 Mapping KoRV Positive Reads to Breakpoint “Birke” bp17 . . . 67
4.8 Recombination Breakpoints and Integration Sites Across Koalas [2] . . . 68
4.9 Relationships Among KoRV LTR Sequences [2] . . . 71
4.10 Prevalence of recKoRV1 in KoRV-positive and KoRV-negative Koalas Across Australia. . . 74
A.1 Scaf14 PCR Products Sanger Sequencing . . . 107
A.2 Scaf21 PCR Products Sanger Sequencing . . . 108
A.3 Scaf24 PCR Products Sanger Sequencing . . . 109
A.4 Scaf37 16563123 PCR Products Sanger Sequencing . . . 110
A.5 Scaf37 17582840 PCR Products Sanger Sequencing . . . 111
A.6 Scaf69 PCR Products Sanger Sequencing . . . 112
A.7 Scaf79 PCR Products Sanger Sequencing . . . 113
A.8 Scaf83 PCR Products Sanger Sequencing . . . 114
A.9 Scaf96 PCR Products Sanger Sequencing . . . 115
A.10 Scaf173 PCR Products Sanger Sequencing . . . 116
List of Tables
2.1 Museum Koala Sample Information [1] . . . 17
2.2 Sequencing Statistics of Target Enrichment Techniques[1] . . . 19
2.3 megaBLAST and TRIBE-MCL Parameters for Sequence Clustering [1] . 21 2.4 Sequence Statistics for Integration Site Detection from aDNA [1] . . . 25
2.5 Shared Integration Sites Across Studies . . . 28
3.1 List of Primers and Oligonucleotides [3] . . . 35
3.2 Sequencing Statistics SiP PacBio . . . 36
3.3 KoRV Sequence Enrichment Using SiP and PacBio RSII Sequencing . . . 41
3.4 Adapter Counts Across Four SiP Datasets and Blunt-End 454 DNA Li-brary (with Illumina Adapters) Dataset. . . 46
4.1 Koala Samples and Datasets Utilized [2] . . . 58
4.2 recKoRV1 Classification Summary. . . 60
4.3 Reads Spanning Breakpoints bp12, bp13, bp16, bp17 . . . 65
4.4 recKoRVs Identified in the Current Study and their Distribution in Modern and Historical Koala Genomes [2] . . . 69
4.5 Shared Target Site Duplications “Bilyarra” . . . 72
A.1 KoRV Forward Integration Sites Identified in Bilyarra and Their Genomic Locations Relative to the Koala Reference Genome . . . 101
A.2 KoRV Reverse Integration Sites and Integration Sites of Unknown Orien-tation Identified in Bilyarra and Their Genomic Locations Relative to the Koala Reference Genome . . . 102
A.3 recKoRV Integration Sites Identified in Bilyarra and Their Genomic Loca-tions Relative to the Koala Reference Genome . . . 103
A.4 Alignment of PCR Sanger Products to Viral Domains, Breakpoints, and Insertion Sites . . . 104
Acronyms
aDNA ancient DNAENV envelope env envelope gene
ERV endogenous retrovirus
GAG group-specific antigen gag group-specific antigen gene
gDNA genomic DNA
HC Hybridization Capture
HTS high-throughput sequencing
iPCR inverse polymerase chain reaction
KoRV koala retrovirus
LTR long terminal repeat
MSA multiple sequence alignment
ORF open reading frame
PCR polymerase chain reaction
PEC Primer Extension Capture
PhER Phascolarctos endogenous retroelement
POL polymerase pol polymerase gene
recKoRV recombinant koala retrovirus
ROI read of insert
Chapter 1
Introduction
For hundreds of millions of years, retroviruses have been integrating into vertebrate genomes [4]. This thesis contributes to the development of new methods for retrieval, characterization, and the comparison of endogenous retroviruses (ERVs) and their in-tegration sites in host genomes. The koala retrovirus (KoRV) is an outstanding study subject, since it is currently in the transition from an exogenous (infectious) to an en-dogenous (genomic trait) retrovirus and is one of the only mammalian retroviruses that is in such an early stage of genomic invasion. Many questions about retroviral endoge-nization are still open. Investigating an endogenous retrovirus in the earliest stages of genome invasion may provide insights into the underlying mechanisms of endogenization, including the interdependencies of host and virus.
In 1983, the human immunodeficiency virus (HIV), causing the acquired immunod-eficiency syndrome, was described. HIV causes nausea, vomiting, persistent diarrhea, chronic fatigue, rapid weight loss, cough and shortness of breath, recurring fever, chills and night sweats, lesions in the mouth or nose, on the genitals or under the skin. Theodor Bestor proposed that HIV might endogenize into the human genome within a lifetime [5].
1.1
Retroviridae
Retroviruses are RNA viruses with a DNA intermediate that integrates into the genome of host cells. The host cell subsequently acts as a reservoir for new virus particles. Retrovirus stands for “Reverse Transcriptase Oncovirus”. Thus, these viruses can reverse-transcribe their RNA to DNA. Using an integrase gene, the virus to insert its genetic information into the host’s genome. Non-infectious particles with the same integration mechanism are called retrotransposons. Retroviruses and retrotransposons form the group of retroele-ments.
Retroviruses are classified in eleven different genera: Alpharetroviruses, Betaretro-viruses, GammaretroBetaretro-viruses, DeltaretroBetaretro-viruses, EpsilonretroBetaretro-viruses, LentiBetaretro-viruses, Bovis-pumaviruses, EquisBovis-pumaviruses, FelisBovis-pumaviruses, ProsimiisBovis-pumaviruses, and Simiis-pumaviruses [6]. Retroviruses infect different cell types, such as lymphocytes, T-cells or germ cells. Usually, the described mechanism leads to virus proliferation; new viral particles may infect other individuals of the same host species or hosts. Such horizontally transmitted viruses are exogenous retroviruses. Retroviruses can cause a variety of dis-eases like anemia, arthritis, cancer, mastitis, osteopetrosis, pneumonia, modest growth, immunosuppression resulting from atrophy of the bursa and thymus [7]. If a retrovirus infects a germline cell, the virus could be transmitted vertically, thus parents will pass the
viral genetic information on to their offspring, which constitutes an ERV founder event. Integrants are referred to as proviruses. For the sake of conciseness, proviruses flanking host genomic sequences are referred to as integration sites hereafter. During integration, single-strand gaps of the host-cell are repaired and result into a 4-10 bp duplication flanking the provirus, referred to as target site duplication. Retroviruses do not integrate randomly into host genomes [8]. It is statistically significant that integrations into tran-scription units, +/- 2 kbp from the trantran-scription start sites, and +/- 2 kbp from CpG islands are favored over random insertions. Different retroviral genera show different insertion preferences [9].
The retroviral genome contains three protein-coding domains:
1. group-specific antigen (GAG); cleavage products are the major structural proteins of the virus core
2. polymerase (POL); cleavage products always include reverse transcriptase and in-tegrase
3. envelope (ENV); cleavage products surface and transmembrane are the structural proteins of the viral envelope [10].
Two long terminal repeats (LTRs) flank the viral protein-coding sequences. Different processes like reinfection, further germline retrotransposition, negative selection, and genetic drift determine the abundance of retroelements in a gene pool.
1.1.1
Endogenous Retroviruses
Even though fundamental insights into retroviral integration were obtained within the last decade, the overall mechanism of retroviral integration remains unclear [11]. The following research sheds light on several processes for investigating ERVs and on recom-bination processes during the early evolution of ERVs. Approximately 8% of the human genome is of retroviral origin. Retroelements may either be advantageous for the host, lower its fitness, or have no effects on the host (neutral). A host infected by a retrovirus may be protected against infections by similar retroviruses. This phenomenon is called superinfection resistance [12]. A similar mechanism has been reported for ERVs. Trans-position of defective endogenous retroelements to recently integrated viruses could harm viral proliferation and thus be advantageous for the host [13].
It has been shown, that high levels of reverse transcriptase derived from ERVs might play a positive role in the host defense mechanism against infections of non-retroviral RNA viruses [14]. Retroelements play an essential role in transcriptomic profiles [15], genetic variability, epigenetic gene regulation [5], embryogenesis [16] and during the development of the placenta in mammals [17,18]. The ambiguous effects of retroviral invasion into host genomes, like malignancy and the capacity to produce infectious viruses on the one hand, positive and/or negative immune modulations for the host, increase of genetic variability on different levels, on the other hand, are still under investigation [19, 20,21].
Once integrated in a host genome, ERVsare inherited as a Mendelian trait (structure shown in figure1.1). In consequence, recombination, degradation, mutations and genetic drift affect the proliferation and the impact of ERVs in the host genome.
Figure 1.1: Structure of an Endogenous Retrovirus
Genomic DNA (black) is flanking the integrated endogenous retrovirus. Adjacent to genomic DNA are the duplicated long terminal repeats (LTRs) in red. Three protein-coding domains are present: the group-specific antigen (GAG) in green, the polymerase (POL) in blue and the envelope (ENV) domain in yellow.
1.1.2
Koala Retrovirus
The koala (Phascolarctos cinereus (Goldfuss, 1817)) is a solitary living species, ranging from New South Wales to South Australia. The International Union for Conservation of Nature Red List of threatened species categorizes the koala as vulnerable, while the population size is still decreasing [22].
An adult koala weighs between 4 and 15 kg, on average, whereas body size typically ranges from 60 to 85 cm. The diet of koalas consists almost exclusively of Eucalyptus
leaves; therefore, koalas are confined toEucalyptus forests. An average habitat size of 1.7 ha has been reported, and individuals rarely interact except in the breeding season when home ranges of males and females may overlap. Female koalas start breeding after the fourth year with a usual litter size of one, while the dominant males reproduce after the fifth year. Captive koalas can live up to 20 years [23]. The closest related extant marsupial species are wombats (Vombatidae) and kangaroos (Macrops spec.) [24]. My primary study subject, the male koala “Bilyarra” (Pci-SN241) from Tiergarten Sch¨onbrunn in Vienna (Austria), was euthanized in July 2014, when he was 16 years old.
In 1988, KoRV was described for the first time to be associated with leukemia in koalas. The first case of leukemia in koalas was reported in the 1960s [25, 26]. Today it is assumed that KoRVinfection results in neoplasia, causing lymphoma and leukemia, increases the prevalence of chlamydia infections and leads to immunomodulation [27,28,
29]. KoRV is a Gammaretrovirus. Viruses most closely related to KoRV are the gibbon ape leukemia virus, the feline leukemia virus, and the porcine endogenous retrovirus [30,
31]. Three major subgroups ofKoRVhave been described, KoRV-A, KoRV-B/-J and the paraphyletic group KoRV-C/-D/-E/-F/-G/-H/-I [32]. According to the current state of science, KoRV-A is transmitted horizontally and vertically, whereas other subtypes like
KoRV-B are exogenous and are only transmitted horizontally [32, 30, 33].
A gradient of infections withKoRV-A in koalas in eastern Australia was observed, with a prevalence of 100% in the North to 14.8% infected individuals on Kangaroo Island [34].
1.1.3
Hypothesis: Viral Insertion and Defense Mechanisms
Different defense mechanisms against the integration ofERVsare known, although incor-poration of ERVs does not only have adverse effects for the host. Phenomena described as retroviral super-infection resistance, suggest that retroelements might act to block receptors against infections of related exogenous retroviruses [35,12].
play a role as a molecular defense mechanism against invading retroviruses that attempt to invade the germline. Furthermore, recombination, based on microhomologies with similar ERVs, impedes viral proliferation by introducing frameshifts in open reading frames (ORFs) or deletions. To test this hypothesis, I developed different methods, to examine ERV integrations in museum koala samples (chapter 2) and modern koala (chapter 3). A comparison and description of KoRV and recombinant koala retrovirus
(recKoRV) integration sites in two modern koalas is outlined in chapter 4.
1.2
Sequencing Technologies
Oswald T. Avery, Colin M. MacLeod, and Maclyn McCarty found that genes and chromo-somes consist of DNA, in 1944 [36]. The first complete nucleotide sequence was resolved in 1965 by Rober W. Holley and colleagues [37]. The team was able to determine 77 bp out of 80 bp long nucleotide sequence of alanine RNA, by purification of tRNAs from yeast, isolation of alanine RNA, different steps of digestion and ion-exchange chromatography. The experiments took more than five years. In 1977, methods to rapidly and accurately sequence DNA were developed. Sequencing was performed based on selective incorpora-tion of radioactively or fluorescently labeled chain-terminating dideoxynucleotides during in vitro DNA replication, followed by size separation of fragments using gel electrophore-sis [38, 39]. More than 20 years after James Watson and Francis Crick described the double helix structure of DNA, Sanger sequencing was the second technology which en-abled scientists to investigate DNA sequences. Sanger sequencing required less handling of toxic chemicals and radioisotopes than the Maxam and Gilbert method, such that Sanger sequencing became the method of choice. First generation sequencing methods produce reads of up to 1 kbp length.
Since the late 2000’s, different companies have developed various methods for high-throughput sequencing (HTS) at low costs, and though the produced reads were initially considerably shorter than Sanger sequencing reads, these next-generation techniques en-abled scientists to perform massive parallel sequencing to decode complete genomes. Second-generation sequencing led to the so-called “genomics revolution”. The third gen-eration of sequencing techniques arose around 2010. Nanopore and Single Molecule Real Time Sequencing (SMRT) increased portability of sequencers, speed, read length and even empowered researchers to investigate epigenetis by detection of methylation. Never-theless, until today second-generation sequencing such as Illumina sequencing persist due to the higher costs of long-molecule sequencing [40]. At the beginning of November 2018, Illumina, which is a leading company for second-generation sequencing, bought Pacific Biosciences, which was the leading third-generation sequencing company, for US$ 1.2B. It remains to be seen how this takeover will affect sequencing costs, technological im-provements and sequencing evolution.
1.2.1
Next/Second-Generation Sequencing
There are different methods of next-generation sequencing, all of which have in common that they produce short sequence fragments at higher sequencing depth and lower costs than Sanger sequencing.
systems are available from Affymetrix, NABsys and Complete Genomics Inc.. Currently, sequencing by hybridization and sequencing by mass spectrometry has been mostly re-placed by other sequencing methods. Sequencing by ligation was introduced in 2005, when Shendure and colleagues described a method using emulsion PCR combined with paramagnetic beads, featuring high signal density, geometric uniformity, and robust fea-ture separation [43]. SOLiD (Sequencing by Oligonucleotide Ligation and Detection) is a modern platform that produces shorter reads at less sequencing depth than the afore-mentioned pyrosequencing technologies but is cheaper.
Simultaneously, 454, later acquired by Roche, released a GS20 sequencing machine in 2005. The GS20 is based on sequencing by synthesis (bead amplification). In 2006 Ju and colleagues reported a method for sequencing by synthesis using a solid surface (DNA Chip) approach and a four-color fluorescent scanner to detect light emission of fluores-cently tagged nucleotides in a polymerase-based synthesis [44]. Sequencing by synthesis with bridge amplification, was technically developed further by the company Solexa, later acquired by Illumina, and is currently the market leader for second-generation sequenc-ing. While the cost of sequencing the human genome amounted to approximately US$ 1M in 2007, Illumina reduced the costs to US$ 4000 in 2011, and the costs further dropped below US$ 1000 per genome in 2014.
All these improvements made it possible to sequence genes at high depth, quantify rare transcripts, provide information about alternative splicing and determine single nu-cleotide polymorphisms. This progress paved the way for comprehensive evolutionary studies and various other applications [45]. All next-generation sequencing platforms have their strength and limitations. While Roche (454 GS Junior) sequencers produce the longest reads and create the most contiguous assemblies, Life Technologies (Ion Tor-rent PGM) sequencers have the smallest error rates and Illumina (MiSeq) machines pro-duce the highest throughput [46]. Illumina, Roche, Life Technologies and others have developed different sequencers filling niches in molecular biology. All these sequencers have assets and drawbacks, creating a broad market of commercially available sequencing technologies.
While Sanger Sequencing was used to investigate the first human genome, next-generation sequencing has a brought range of applications at low costs.
WithoutHTSprojects like the investigation of honeybee disappearance by gut metage-nomics analysis or sequencing of the first Neanderthal genome could not have been com-pleted [47]. Illumina is the leader in the next-generation sequencing industry. In chapter2
I used an Illumina MiSeq to investigate the distribution ofKoRVfrom museal samples and compare target enrichment techniques for viral insertion sites utilizing second-generation sequencers.
1.2.2
Third-Generation Sequencing
Third-generation sequencing was the next breakthrough in sequencing technology. In 2003 Ido Braslavsky, Benedict Hebert, Emil Kartalov, and Stephen R. Quake first de-scribed a method to obtain sequence information from single DNA molecules [48]. There-fore, PCR is not needed before sequencing, which shortens DNA preparation time for se-quencing, and overcomes amplification and dephasing biases introduced by PCR. There are three long-fragmentHTSplatforms: nanopore-sequencing, advanced microscopy tech-niques direct imaging of DNA molecules, and single-molecule real-time sequencing (SMRT) by synthesis [49]. The signal is captured in real time, which means that the signal,
re-gardless whether it is fluorescent (Pacific Biosciences) or electric current (Nanopore), is monitored during the enzymatic reaction of adding nucleotides in the complementary strand [50]. One of the most significant benefits is substantially increased read length; however, the error rate is generally higher compared to short-read platforms. These tech-nological improvements have ushered in a new era of molecular biology and genetics. For the analysis of ERVs described in chapter 3 and chapter 4, I employed PacBios’ RSII platform to inspect long stretches of host genomic DNA flanking viral integration sites. In brief, SMRT sequencing (PacBio) is based on the following principles:
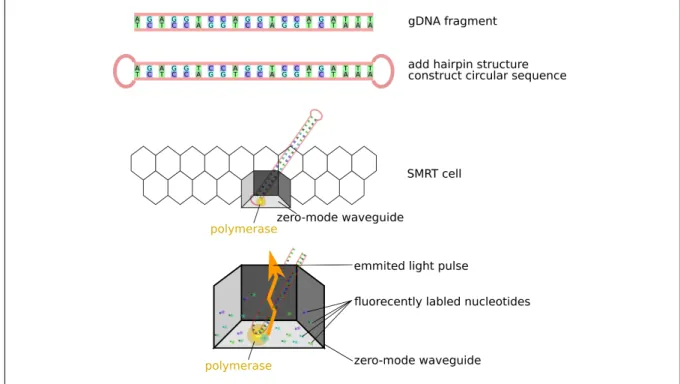
1. ligate hairpin adapter on both ends of target double-stranded DNA → single-stranded circular DNA
2. load product on a chip termed SMRT cell
3. single unit called zero-mode waveguide, with immobilized single polymerase 4. polymerase binds to either of the hairpin adapters (replication start)
5. fluorescently labeled nucleotides emit light pulse when incorporated 6. light impulses are tracked as a movie (0.5-4 h)
7. single-stranded circular DNA can be sequenced multiples times (passes) to create circular consensus sequences (CCS) [referred to as reads of insert (ROIs)] with higher accuracy [51]
The principles of PacBio SMRT sequencing are shown in figure 1.2.
The maximum read length of the PacBio RSII is above 20 kbp, which enables scien-tists to overcome typical problems of next-generation sequencing, such as assembling low complexity or repetitive regions.
The technological evolution has yielded new problems of sequence processing, high-lighted in section 1.3. Currently, bioinformatic processing of sequencing data often re-mains to be a bottleneck of genetic analysis, since hard disc capacities roughly double every year, the costs of sending a bit over optical networks halves every nine months, whereas next-generation sequencing capacities have doubled in less than every six months since 2004 [52].
Figure 1.2: PacBio Single Molecule Real Time Sequencing
Hairpin adapters are ligated to fragmented DNA to produce circular sequences. Polymerase enzymes are attached to a sequencing matrix. One polymerase is immobilized in every single unit. All units together form a SMRT-Cell. When the polymerase incorporates a fluorescently labeled nucleotide a light impulse is emitted. Light impulses are recorded as a movie.
1.3
Bioinformatics Analysis of Sequencing Data
Conrad Zuse developed the first computer, the Zuse Z1, in 1938. Frederick Sanger and colleagues decoded the first amino acid sequence during 1945 and 1955. The development of high-speed computers by weapons research programs during the Second World War made them highly available for academic research in the 1960s. Bioinformatics history is often stated to have commenced in the 1960s with the “godmother of bioinformatics” Margaret Dayhoff. Dayhoff wrote a program to determine the amino acid sequence of protein molecules in FORTRAN, which computed the correct sequence of ribonuclease within a a matter of several minutes. At this point, computational biologists found a feasible solution to predict protein sequences of up to 750 amino acids in length. Dayhoff established the first sequence database, an annual released version of all known amino acids sequences, reffered to as the “Atlas of Protein Sequence and Structure”, which in 1983 evolved into the online database “Protein Information Resource”. Pairwise com-parisons were introduced in the 60s as well as the concept of sequence homology, and alignments of related sequences. Based on these tools and concepts, phylogenetic analy-ses were born. Walter Fitch implemented the first sliding window approach to accelerate sequence alignments, later improved by Saul Needleman and Christian Wunsch (see
sec-tion1.3.1). Based on the Atlas of Protein Sequence and Structure, the “percent accepted
Currently, raw sequencing data, assemblies, structural and functional annotation and taxonimic information are synchronized by the International Nucleotide Sequence Database Collaboration (INSDC), including the DNA Data Bank of Japan (DDBJ at the National Institute for Genetics in Mishima, Japan), the European Nucleotide Archive at the EMBL European Bioinformatics Institute (EMBL-EBI) in Cambridge, UK, and Gen-Bank at the National Center for Biotechnology Information (NCBI) in Bethesda, MD, USA, every day [54]. In October 2018, the NCBI GenBank contained 209,656,636 se-quences and 722,438,528 whole genome shotgun sese-quences and submissions. This reflects the growth of the field of genomics and bioinformatics over the last decades. Biology is one of the fastest growing fields in big data analysis. Electronic engineer Gordon Moore stated that the decrease of costs for components of integrated circuits follows a linear function [55]. This model, also known as Moore’s law, is still valid. The complexity of semiconductor microchips doubles every two years for a constant value, while between 2004 and 2010, sequencing capabilities doubled every five months [52]. Since 2008 it is more expensive to store, process and analyze sequencing data than to generate new data. New algorithmic approaches, data compression solutions and parallelization of pro-cesses are needed to overcome the challenges of big data processing. The US Government announced a US$200M investment to “improve the tools and techniques needed to ac-cess, organize, and glean discoveries from huge volumes of digital data” under President Obama [56]. These trends demonstrate that big data analysis is a challenge for science, society, and politics.
In this study, I focus on sequence alignments, similarity-based sequence clustering, and sequence processing. A sequence alignment is a comparison of two or more nucleotide or amino acid sequences to identify a series of similar characters or a pattern. A selection of sequence alignment approaches will be discussed in the following sections. Alignments are classified as pairwise versus multiple, and global versus local alignments, utilizing optimal versus heuristic algorithms [57].
1.3.1
Pairwise Sequence Alignment
As mentioned before, sequence alignments can be based on optimal and heuristic algo-rithms. Optimal algorithms will compute the best solution for the string-matching prob-lem. The runtime for sequence alignments based on dynamic programming is quadratic
O(m∗n), where n is the length of one string and m is the length of the other string. A famous algorithm to compute optimal global alignments was presented in 1970 by Saul B. Needleman and Christian Wunsch [58]. Global alignments compute the best matching string configuration over the complete length of two sequences. The Needleman-Wunsch algorithm can be described as follows:
1. Initialization
Create a matrix with M + 1 columns and N + 1 rows where M and N correspond to the size of the sequences to be aligned
2. Matrix fill (scoring) Recursion
3. Traceback (alignment)
The maximum score determines the best alignment(s)
The Needleman-Wunsch algorithm applies to closely related sequences of similar length. For my work, I used the Smith-Waterman algorithm in chapter 2 to compute optimal local alignments. Local alignments are designed to identify the best match of two substrings. Smith and Waterman first described the Needleman-Wunsch algorithm formally and made two major changes to adjust the algorithm for local alignments [59]. The first column and row of the scoring matrix is initialized with zeros as to not penalize terminal gaps. In addition to the scoring system with match, mismatch and gap, Smith and Waterman introduced a fourth state termed empty suffix.
SMITH−WATERMAN OPTIMAL LOCAL SEQUENCE ALIGNMENT pseudocode Input: two sequences X and Y
Output:optimal local alignment and score α
Initialization:
Set F(i,0) := 0 for all i = 0,1,2,...,n Set F(0,j) := 0 for all j = 1,2,...,m For i = 1,2,...,n do: For j = 1,2,...,m do: SetF(i, j) :=max 0 F(i−1, j−1) +s(xi, yj) F(i−1, j)−d F(i, j−1)−d
Set backtrace T(i,j) to the maximizing pair (i’,j’) Set (i, j) :=arg max{F(i, j)|i= 1,2, ..., n, j= 1,2, ..., m}
The best score is α:=F(i, j)
repeat if T(i, j) = (i−1, j−1) print xi−1 yj−1 else if T(i, j) = (i−1, j) print xi−1 − else print y− j−1 Set (i, j) :=T(i, j) until F(i, j) = 0
One tool for optimal local sequence alignment is SSearch, in which the Smith-Waterman algorithm is implemented [60]. SSearch was conducted by Pearson who also developed faster, heuristic tools for sequence comparison such as “fasta” and a tool for optimal global sequence alignment termed GGsearch [61,62, 63, 64, 65].
As indicated, optimal alignments are not feasible for very long sequences or alignments of many sequences. As an alternative, heuristics were developed that do not guarantee an optimal result but are considerably faster. K-tuple alignment methods search for
words of size k instead of comparing every character of a string. The underlying logic is to create a database of indexes and subsequences of word size k and to search for a so-called seed (exact match of a subsequence) in the aligned sequences. Smaller k lengths lead to higher accuracy, however, they produce more words which results in slower performance. Seed matches are extended until the accumulated score falls below a specified threshold. Different scoring matrices could be applied, based on assumptions of sequence similarity. In addition to the PAM matrices, the second set of widely used matrices are the “blocks substitution matrices” (BLOSUM) [66]. While PAM is based on global alignments, BLOSUM is based on local alignments and therefore applicable to more distantly related sequences. One of the most prominent heuristic alignment software is the basic local alignment search tool (BLAST) released 1990 by Stephen Frank Altschul [67]. Different features have been implemented since then, such as parallel mode, GPU mode and different modules for protein alignments, nucleotide alignments and cross-comparison [68, 69, 70]. BLAST remains the gold standard for a broad group of users, even though there is more efficient sequence alignment software, such as diamond [71] or NSimScan [72].
Since it is not possible to compute an exact value for the precision of an alignment without knowing the optimal solution, probability scores are computed for every heuristic. It is crucial to evaluate the quality of a non-optimal alignment. The alignment quality measure of BLAST is the so-called e-value, short for “expect value”. The e-value is the number of expected hits of similar quality. It is calculated by a weighted ratio of the bit-score, the number, and length of sequences in the database and the query sequence length. The bit-score (S0 = λS−lnlnK2 , where K and λ are parameters calculated from scoring matrix) is a log2 scaled, normalized raw-score (S), independent of the database size and describes the probability of the current alignment to occur by chance [67]. Given that m is the total length of sequences in the database and n is the query length, the e-value is calculated according to the formula:
e = m∗n
2−S0 (1.1)
E-values are used to compare alignments with each other, independent from database size.
Even though BLAST has the same overall computational complexity of O(m ∗n), in practice, BLAST is faster by orders of magnitudes than dynamic programming ap-proaches. The development of more efficient algorithms such as SeqAn libraries may boost the performance of alignment software, leading to more precise and faster tools [73, 74].
1.3.2
Multiple Sequence Alignment
In contrast to pairwise alignments, a multiple sequence alignment applies to a set of more than two sequences compared with each other and thereby producing a set of alignments with the smallest distances among all pairs of sequences. In 1994, it was shown that multiple sequence alignment with sum of pairs score is NP-complete and multiple tree alignment is MAX SNP-hard [75,76]. This indicates that an alignment with a sum of pair score (SP-score) cannot be solved in polynomial time, whereas multiple tree alignments allow polynomial-time approximation. Due to this fact, heuristics are needed
Progressive and consistency-based tools can be pooled as similarity-based approaches and are most widely used. MAFFT [77] and clustal [78, 79] are examples of progres-sive multiple sequence alignment tools, whereas T-Coffee [80, 81] is a consistency-based alignment tool. Consistency-based alignments compute pairwise alignments; i.e., based on the alignments of sequence A to B and B to C can the resulting distance of sequence A to C be justified by computing the distance by aligning sequence A to C. Progressive alignments compute pairwise alignments of the most similar pairs of sequences. Creating a so-called guide tree, alignments of interior nodes with direct descendants are computed. The root node represents a complete multiple sequence alignment. This can be refined by reiterating this process based on the last computed guide tree.
Iterative refinement concepts, e.g. MUSCLE [82], are another class of multiple se-quence alignment strategies. In contrast to progressive alignments initially computed pairwise alignments can be split again, realigning a sequence if the distance to another sequence or group of sequences is smaller than the initial alignment. As a result, a local optimal score is produced, emerging into a maximum global space as sequence space is finite. MAFFT and MUSCLE offer significant improvements in scalability with compara-ble accuracy and thus provide reasonacompara-ble starting points for general alignment procompara-blems. The score of an alignment can be calculated either using an evolutionary model [83] or with the SP-score. Therefore, the Needleman-Wunsch scoring matrix as described in section 1.3.1 was adapted. Historically, most algorithms assumed that sequences align globally. Nowadays, algorithms exist which focus on sequences with local similarities as well, including ALIGN-M, DIALIGN, POA or SATCHMO; this, however, is beyond the scope of this thesis [84].
Recent approaches such as PRANK [85] focus on phylogeny-aware alignments. Phylogeny-based and probabilistic approaches tend to be the next level of multiple se-quence alignments and can be joined as evolution-based alignments [86]. For phylogenetic based approaches, a set of N sequences is aligned by performing N-1 pairwise alignments computing a phylogenetic tree connecting the sequences. Iterative refinement is com-puted until the phylogenetic tree reaches a steady state. In contrast, probabilistic models implemented in e.g. HMMER [87] extend entropy-based scores by modeling insertions and deletions in multiple sequence alignments with hidden Markov Models, estimating a position-specific model weighted with probability scores.
Specialized multiple sequence alignment tools such as MARS [88] were developed for specific problems, which cannot be addressed using standard multiple sequence alignment tools. MARS is a heuristic method for improving multiple circular sequence alignment using refined sequences. It was developed to relax the assumption that the start position of the alignment is at the first position of the sequence and the alignment end is at the end of the sequence. This assumption does not necessarily apply to circular sequences, and therefore MARS computes the cyclic edit distance between two strings and finds the best rotation of the sequences to minimize pairwise distance.
1.3.3
Sequence Mapping
Sequence mapping is the process of aligning numerous queries to a small amount of longer sequences. Classical sequence mappers have been adapted from the needs of short reads to long reads within the past years. A commonly used tool for sequence mapping is Bowtie [89]. Bowtie creates its own refined index based on the FM Index, which uses the Burrows Wheeler transformation. Bowtie1 was designed for short reads of up to
1 kbp length, whereas Bowtie2 has no upper limit regarding read length. For my analy-ses Burrows-Wheeler Aligner’s Smith-Waterman Alignment (BWA-SW) [90] was used to align long sequences against references. Burrows–Wheeler transform is the first step to reversibly compresses strings, thereby reducing search space and consequently reducing memory usage in order to accelerate the process. BWA produces sequence/alignment maps (SAM) [91] containing information on start- and end-position of local alignments, global and local quality information of alignments and could be run in paired mode, such that distance information of sequences from paired end libraries can be facilitated. A different long-read mapping tool is BLASR (basic local alignment with successive refine-ment) [92]. BLASR is specialized on long reads from HTS of DNA by single molecule sequencing. In 2018, a tool termed Minimap2 was released which is more than 50 times faster and more accurate for long reads than bwa-mem [93].
1.3.4
Sequence Clustering
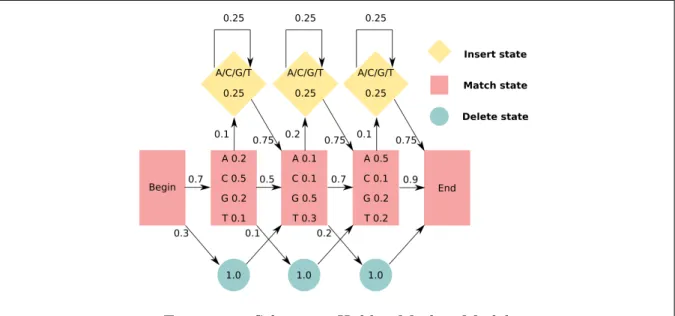
Sequence clustering attempts to group biological sequences by similarity. Uclust [94] and cd-hit [95] use greedy algorithms to identify representative sequences and assign related sequences based on a given threshold of identity. Tribe-MCL [96] relies on the Markov Cluster (MCL) algorithm ,[97]. MCL is able to utilize BLAST scores, such that all versus all database searches using BLAST are used to compute reliable sequence clusters. In brief, Markov Models or Markov matrices describe the transitions of Markov Chains [98]. A Markov Chain makes predictions based exclusively on the present state, such that future and past states are independent. Also, Hidden Markov Models (HMM) include unobserved (hidden) states. It has been shown that HMMs represent the evolution of biological sequences very well [83]. HMMs are able to predict state changes, based on the sequence of observations, whereas internal hidden stages predict a set of external events (observations). A small example of an HMM for a DNA sequence is shown in figure 1.3. A set of probabilities for every nucleotide at a certain position is given (observation/e-mission probabilities - match state), as well as probabilities for insertions (insert state) and deletions (transitions - delete state).
Figure 1.3: Schematic Hidden Markov Model
A simplified Hidden Markov Model showing probabilities of residue types for individual positions (match state red rectangles, insertion state yellow rhombus, deletion state green circles).
1.3.5
Tools and Pipelines for Retrieval of Retroviral Integration
Sites
Different approaches can be taken to retrieve viral integration sites. SeqMap is a publicly available web platform for retroviral integration site analysis of HTS data using ligase-mediated PCR (LM-PCR) [99], linear-amplification-mediated PCR (LAM-PCR) [100,
101] or non-restrictive LAM-PCR (nrLAM-PCR) [102]. All of these amplification proto-cols depend on the presence of specific recognition motifs that are unevenly distributed across the genome. SeqMap is a reference-based integration site mapper [103]. Basically, it performs sequence preprocessing including demultiplexing, recognizes LTR sequences and linker cassettes by sequence alignment, masks adapters, LTRs, and linker cassettes and maps these reads to a reference genome. Results are visualized and stored for further analysis. In the latest version, SeqMap 3.0, “mouse” (mm10) and “human” (hg19) are the only implemented references, however, other references might be implemented on request. This approach is neither applicable for non-model organisms, nor for fragmented DNA or third-generation sequencing technologies. Another tool to identify retroviral sequences in host genomes is RetroTector [104]. However, RetroTector is limited to nine predefined reference species and can handle a maximum of 100 Mb of data per run. VISPA (Vector Integration Site Parallel Analysis) is a pipeline to identify genomic vector integration sites [105]. The pipeline was implemented to handle reads of 100 to 1,000 bp length produced by LAM-PCR [100, 101].
There are several other tools to detect retroviral integration sites, such as VirusSeq [106], ViralFusionSeq [107] VirusFinder [108], Virus-Clip [109], Ub-ISAP [110] and ViFi[111]. All of these are designed to identify viruses in the human genome, thus they are reference-based and mostly restricted to RNA sequencing to detect proviruses of exogenous retrovi-ral origin. Other approaches designed for wild and domestic animals are at least confined
to an assembled reference genome [112].
To the best of my knowledge, no tool exists to detect endogenous retroviruses in large scale high throughput data from ancient DNA or long-read sequencing for non-model organisms.
1.4
Objective
This thesis aims to investigate further methods to process data from targeted short and long-readHTSto compare insertion sites of endogenous retroviruses comprehensively. By doing so, I aimed to address the underlying mechanisms of retroviral endogenization in the earliest stages of genomic invasion. In order to achieve this objective, I developed computational pipelines to detect endogenous retrovirus integrations from HTS data. A pipeline for short-read sequences from historical koala samples is described in chapter 2. A new methodology for target enrichment sequencing using third-generation sequencing technology is outlined in chapter 3. The following chapter (chapter 4) examines aspects of retroviral recombination and compares findings retrieved from data generated by the method described in chapter 3. My conclusions are discussed in the final chapter (chap-ter 5).
1.4.1
Retroviral Integration Sites
Research tended to focus on the development and comparison of target enrichment tech-niques of endogenous retroviruses in modern samples rather than in historical samples. Moreover, it remains unclear whether standard methods like rapid amplification of cDNA ends (RACE) [113], ligation-mediated PCR [114], linker-selection-mediated PCR [115], linear amplification-mediated PCR [101] and genome walking [116] comprehensively de-tect integration sites, because of the potential of primer-target mismatches [117]. In order to investigate other methods for retroviral target enrichment from ancient DNA, we tested three different target enrichment methods, namely primer extension capture, single primer extension capture, and hybrid capture, in order to comprehensively profile integration sites of the koala retrovirus from museum samples. A severe limitation of analyzing ancient DNA is the fragmentation of the DNA resulting from natural degra-dation processes. As one outcome the target enrichment techniques are compared, and as another outcome, koala retrovirus integration sites were profiled, by combining novel and published data.
Since new approaches in sequencing technologies have been developed, it is now possi-ble to produce long sequences with high-throughput technologies. The main shortcoming of short-readHTS, particularly the length limitation of sequences thus could be resolved. New methods need to be developed to overcome the constraints of target enrichment methods for short-read sequencing. I propose a new technique to capture retroviral inte-gration sites in chapter 3. Sonication inverse PCR is a restriction enzyme free approach for the genome scale analysis of integration sites using long-read sequencing technologies. I describe the method and the bioinformatics pipeline I developed and discuss limitations. In chapter4I outline findings retrieved by sonication inverse PCR applied to the genome of a captive koala. Furthermore, the results are compared with koala retrovirus integra-tion sites from literature. I also describe the discovery a new retroviral recombinant.
discussed in chapter 5. Research perspectives and open questions are summarized in a concluding section at the end of this thesis.
Chapter 2
Investigation of Koala Retrovirus in
Museum Koala Samples
For hundreds of millions of years, endogenous retroviruses (ERVs) have been invading vertebrate genomes [4]. In contrast to exogenous retroviruses,ERVs infect germline cells and are inherited as a Mendelian trait. The koala retrovirus (KoRV) is currently in transition from an exogenous to an endogenous retrovirus [118, 119]. It has been shown that KoRV causes neoplasia[120], lymphoma and leukemia [27], increases the prevalence of chlamydia infections and leads to immunomodulation [28, 29]. In recent years there has been considerable interest in KoRV [31, 121, 122, 123, 124]. Previous work has only focused on the examination of KoRVintegration sites in different koalas but failed to address a comprehensive characterization between individuals. Different methods for target enrichment sequencing exist but have not been applied previously to ancient DNA. In order to close these gaps, this work aims to evaluate different methods of targeted high-throughput sequencing (HTS) from historical samples to comprehensively profile KoRV
with new and published data. Comprehensive profiling is necessary to shed light on the distribution of unique KoRVintegration sites and those shared between individuals.
Paleogenomics analyses are challenging, due to the fact that ancient DNA is typi-cally heavily fragmented by endogenous nucleases, oxidation, hydrolysis and background radiation [125]. As a consequence, computational solutions must be found to process sequences and assign integration sites from very short reads. A major limitation is the contamination of target DNA, such that extensive preprocessing of the molecular data is necessary.
2.1
Characterizing Viral Integration Sites from
An-cient DNA
This chapter is based on the publication “Comprehensive profiling of retroviral integration sites using target enrichment methods from historical koala samples without an assembled reference genome.” published in the journal PeerJ in 2016 [1]. In recent publications it has been shown that KoRV integration sites were only shared in very closely related koalas. Nonetheless, no comprehensive integration site analysis was performed so far, since methodological challenges limited the analysis space. At this point, there was no
Table 2.1: Museum Koala Sample Information [1]
Collection no. Year Sample provider Locality
AMA17300 1883 Australian Museum New South Wales, Australia AMA17311 1883 Australian Museum New South Wales, Australia AMA17299 1883 Australian Museum New South Wales, Australia QM J2377 1915 Queensland Museum Queensland Australia QM J7209 1945 Queensland Museum Queensland Australia QM J8353 1952 Queensland Museum Queensland Australia QM JM1875 1960s Queensland Museum Queensland Australia AM M 12482 1971 Australian Museum New South Wales, Australia QM JM64 1973 Queensland Museum Queensland Australia QM 7625 1970–1980s Queensland Museum Queensland Australia
rapid amplification of cDNA ends, ligation-mediated PCR [114, 127], linker-selection-mediated PCR [115], linear amplification-mediated PCR [128], and genome walking [129]; however, none of these were applied to ancient DNA (aDNA) so far. To investigateKoRV
integration site patterns we examined ten museum koala samples (s. table 2.1). We developed and tested three different target enrichment techniques forHTSof short reads. In this thesis, the focus is on the development of the bioinformatics pipeline to analyze short-read products from ancient ERVs.
2.1.1
Comparison of Three Targeted Sequencing Methods
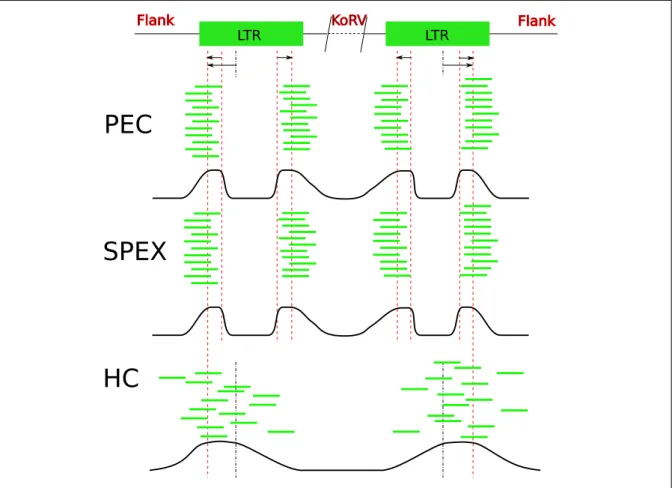
Three target enrichment techniques followed by Illumina HTS were applied - Single Primer Extension (SPEX) [130], Primer Extension Capture (PEC) [131] and Hybridization Capture (HC) [132]. All of these techniques have successfully been applied to enrich
aDNA and were tested for the characterization of genomic sequences flanking ERVs. Museum skin samples of ten koalas were examined for this study. Our primary aim was a cross-comparison of the efficiency of target enrichment techniques. Furthermore, we retrieved integration site information on historical koala samples, and compared them with each other and to known integration sites of modern koalas of other studies. All enrichment techniques were based on DNA from a 7 mm×7 mm sample of museum koala skin. Primers and baits were designed to bind to the LTR region of KoRV. Sequencing was performed using an Illumina MiSeq Reagent Kit v2 for all experiments. Underlying mechanisms are described in the following sections and visualized in figure 2.1.
Primer Extension Capture (PEC)
For Primer Extension Capture, Illumina libraries are produced from DNA and are sub-sequently denaturated to produce single-strand DNA. Sequences containing the target region hybridize with biotinylated primers which are then bound to magnetic beats so that non-targets can be removed by washing. The target product is eluted and sequenced.
Single Primer Extension Capture (SPEX)
In contrast toPEC, the Illumina library preparation is the last procedure of the protocol before SPEX products are created. DNA is denaturated and mixed with the same bi-otinylated primers as forPEC. Targets are filtered using magnetic beats, and a poly C tail
is ligated. The Illumina library is constructed, and a second amplification is performed. Then the target products are sequenced.
Table 2.2: Sequencing Statistics of Target Enrichment Techniques[1]
SPEX PEC HC
Number of raw reads 7,627,810 6,956,280 31,096,064 Unique sequences 714,929 1,188,365 11,675,245 Target enrichment efficiency (%) 4.68 0.55 0.01 Homologous sequences to wallaby genome 1,617 136,366 1,915,781
Hybrid Capture (HC)
As for PEC, the first step ofHC is the construction of an Illumina library. After denat-uration, single-stranded DNA is mixed with rotating magnetic beats with immobilized baits on their surface. The baits bind target sequences and a hybridization process starts where captured baits bind further downstream target sequences. After hybridization, the products are eluted and sequenced. In contrast to PECand SPEX, this process leads to a bell-shaped distribution of target sequences adjacent to the bait.
2.1.2
Detection of the Koala Retrovirus from Illumina
Short-Reads
The focus of this thesis is the analysis regarding approaches of applied bioinformatics for automated detection ofERV integration sites within mammalian genomes exemplary demonstrated for the case ofKoRV. I developed a pipeline to detect ERVsfrom ancient koala samples using different target enrichment techniques and Illumina HTS. To the best of my knowledge, no standard protocol was published to tackle this problem. Ex-isting approaches for retroviral detection such as RetroTector have several limitations. RetroTector online can process “up to 100 Mbase per submission” which is not applicable to HTSdata [104, 133]. RetroTector is based on the identification of both LTRs assign-ing domains in-between, which requires complete, and intact proviral structures. Other approaches are alignment-based using viral references, which are designed for complete genomes, as well or at least assembled contigs [17]. However, aDNA is fragmented, such that reference-free assemblies, especially for repetitive or low complexity regions, would fail.
A total of 7,627,810 reads fromSPEX, 6,956,280 reads fromPECand 31,096,064 reads from HC respectively were analyzed (s. table 2.2). aDNA was sequenced using paired-end libraries with Illumina MiSeq Reagent Kit v2 producing sequences up to 150 bp in length. The sequence length distribution of all three enrichment techniques is shown in figure 2.4.
All samples were processed separately until the final comparison steps of KoRV inte-gration sites. Cutadapt (version 1.2.1) [134] was applied for adapter trimming; quality fil-tering was performed using Trimmomatic (version 0.22) [135], both with default settings. Forward and reverse reads were merged using Flash (version 1.2.5) [136]. Downsampling was performed using cd-hit (version 4.6) [95] to screen for identical sequences, retaining the longest representative read. Downsampling enhances the performance of follow up processes, due to the smaller number of operations, as the objective is a qualitative and not quantitative analysis.
After preprocessing, off-target reads were filtered, and KoRV homologous regions were clipped. The reads were aligned to a 30 bp reference on the 5’ site and 63 bp
reference on the 3’ site extracted from the LTR covering the bait binding sites. A pairwise alignment using the Smith-Waterman [59] application from EMBOSS (version 6.6.0.0) [137] was executed. The results were further filtered based on different criteria for 5’ and 3’ integration sites as the baits bind 49 bp (apart from the 5’ breakpoint) and 82 bp (apart from the 3’ breakpoint), respectively. Primer positions relative to the LTR structure of
KoRVare shown in figure 2.2.
Figure 2.2: Primer Positions and LTR Structure for the Identification of KoRV Inte-gration Sites [1]
(A) General overview of KoRV structure and primer position overview (B) Detailed primer positions with respect to gDNA and LTR
It was shown that some KoRV proviruses had a 19 bp deletion in the LTR towards the breakpoint [31]; we therefore, evaluated filtering criteria based on these factors and filtered reads which covered at least two thirds of the LTR reference (20/30 bp on the 5’ site and 43/63 bp on the 3’ site) with 90 percent identity. Sequences not matching these criteria were discarded and identified LTR domains were clipped. The remaining sequences were aligned to the residual 19 bp of the LTR sequence clipping sequences of 12/19 bp could be aligned with a minimum identity of 80 percent. All routines were implemented in Perl. An overview of the pipeline is shown in figure 2.3.
Table 2.3: megaBLAST and TRIBE-MCL Parameters for Sequence Clustering [1]
Method SPEX PEC HC
Integration site orientation 5’ end 3’ end 5’ end 3’ end 5’ end 3’ end E-value for all versus all BLAST 10−30 10−30 10−17 10−20 10−15 10−15
Inflation value for clustering 1.4 4 22 4 6 16
Sort PEC/SPEX/HC Adapter and quality trimming Merge reads Remove duplicates Read contains LTR Exclude from analysis No Trimm off LTR Yes Read > 10 bp All vs all blastn Yes Exclude from analysis No Clustering by sequence simlarity Readclusters for every insertion site Multiple sequence alignment Consensus construction Pairing by target site duplication Known insertion sites (references) Ancient and recent ERV insertion sites Consensus contains gag/env No Yes Exclude from analysis Sequencing data
Figure 2.3: Bioinformatics Pipeline for Targeted ERVs from Museum Samples
Starting with raw sequencing data, all steps were performed separately forPEC,SPEXandHC, indicated by the yellow, blue and grey arrows, respectively. Rectangles indicate processes, the rhombus indicates decisions (filtering), the parallelogram indicates data, the trapezium indicates manual processing and the circle indicates coalescence of new and published data.
Reads longer than ten base pairs were used for further analyses. We created a dis-tance matrix for the sequences with TRIBE-MCL (version 12-135) [96] based on NCBI megablast alignments (megaBLAST from NCBI BLAST+ version 2.2.29+) [67,68, 138,
69] using all reads as database and query for the three different datasets.
For each resulting cluster, a multiple sequence alignment (MSA) was performed using MAFFT (version 7.127b) [77, 139] with default settings except for adjusting for reverse complement sequences. The clustering parameters were assessed by visualizing theMSAs
of the 30 largest clusters in jalview (version 2.8) [140]. When no sequence in each of these clusters had less than 10 percent insertions, deletions or substitutions related to the individual sequence length, the parameters with the lowest granularity matching these conditions were chosen. MSAs were further processed to construct consensus sequences for every cluster . Clusters containing only one sequence were considered “singletons”. Consensus sequences and singletons, were aligned with the sequences of group-specific
antigen gene (gag) and envelope gene (env). If one of the genes could be assigned to a consensus sequence or singleton, the cluster was assigned as proviral primer extension and was excluded from the analysis. Due to the duplication of theLTRand the primer design we expected approximately 50 percent of the products from proviral origin while the other products are from genomic DNA (gDNA) integration sites, respectively. Further, non-automated processing and statistical analyses were performed as described in Cui et al. 2016 [1].
2.2
Results
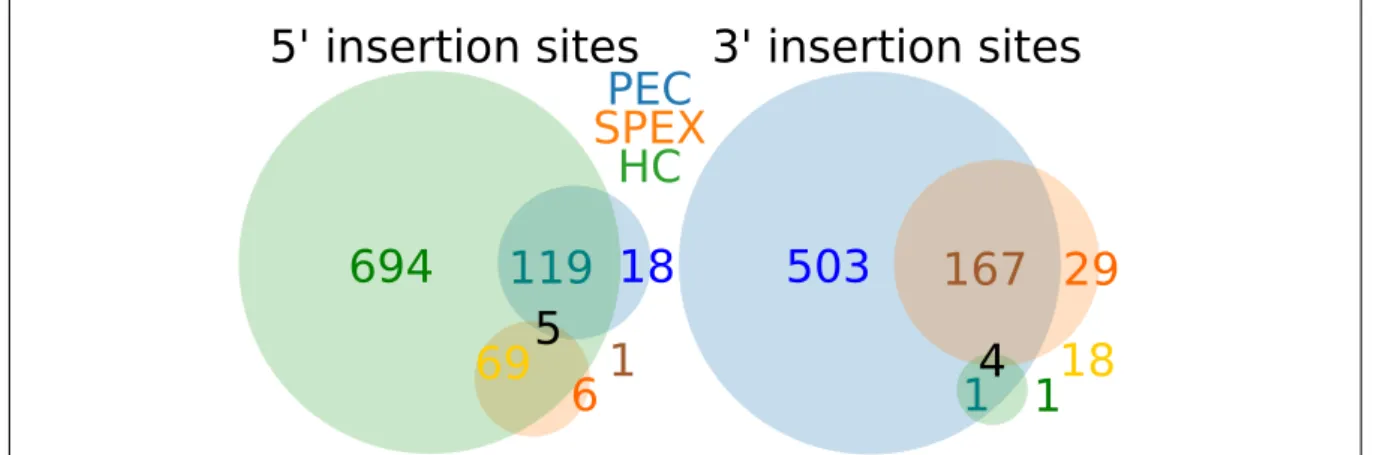
This study had two objectives. Most studies have only focused on target enrichment techniques to find ERV integration sites in fresh samples. The first objective was to compare three target enrichment techniques to identifyERV integration sites in museum koala samples. The characteristics of ERV integration sites have not been dealt with in depth. The second objective is the comprehensive profiling of KoRV integration sites from different koalas. Both objectives were achieved.
2.2.1
Target Enrichment Techniques for Integration Site
Re-trieval from Ancient DNA
PEC and HC experiments showed similar sequence length distributions with the most frequent fragment length close to 50 bp and 150 bp, respectively. The maximum sequence length produced by the Illumina MiSeq Reagent Kit v2 was 150 bp. Sequences from the
SPEX experiment showed a slightly different sequence length distribution with most reads of 20 bp in length. Similar toPECand HC a higher frequency of reads with 50 bp and 150 bp in length occured. Additionally, a high abundance of reads with a fragment length of 90 bp were retrieved fromSPEX. Reads with a sequence length of 150 bp were observed relatively more frequently in SPEX than in PEC or HC. All observations are shown in figure 2.4 and were normalized to the total number of reads in every dataset.
The highest amount of sequences was generated with the HCprotocol (31,096,064 se-quences), followed bySPEX(7,627,810 sequences) andPEC(6,956,280 sequences). After preprocessing (adapter and quality trimming, read merging and dereplication) 11,675,245 (38%) of the reads from HC, 7,627,810 (9%) from SPEXand 1,188,365 (17%) fromPEC
were retained. These numbers indicate thatSPEXproduced the highest amount of clon-ality, whereas HC produced both the biggest number of reads and the smallest amount of clonality, which was expected due to methodological assumptions (see figure 2.5).
![Figure 2.1: Experimental Workflow for Three Target Enrichment Techniques [1]](https://thumb-us.123doks.com/thumbv2/123dok_us/9025708.2800433/31.892.109.783.161.1070/figure-experimental-workflow-target-enrichment-techniques.webp)
![Figure 2.2: Primer Positions and LTR Structure for the Identification of KoRV Inte- Inte-gration Sites [1]](https://thumb-us.123doks.com/thumbv2/123dok_us/9025708.2800433/33.892.105.787.256.726/figure-primer-positions-structure-identification-korv-gration-sites.webp)
![Figure 2.4: Sequence Length Distribution of Three Target Enrichment Techniques [1]](https://thumb-us.123doks.com/thumbv2/123dok_us/9025708.2800433/36.892.112.782.106.777/figure-sequence-length-distribution-target-enrichment-techniques.webp)
![Figure 3.1: Sonication Inverse PCR Scheme [3]](https://thumb-us.123doks.com/thumbv2/123dok_us/9025708.2800433/46.892.114.780.108.820/figure-sonication-inverse-pcr-scheme.webp)
![Figure 3.3: Experimental Workflow of Sonication Inverse PCR [3]](https://thumb-us.123doks.com/thumbv2/123dok_us/9025708.2800433/51.892.115.781.120.661/figure-experimental-workflow-sonication-inverse-pcr.webp)
