Gelazanskas, L. and Gamage, K. A.A. (2016) Managing Renewable
Intermittency in Smart Grid: Use of Residential Hot Water Heaters as a
Form of Energy Storage. In: 2016 19th International ymposium on
Electrical Apparatus and Technologies (SIELA), Bourgas, Bulgaria, 29
May - 1 June 2016, ISBN 9781467395229
(doi:
10.1109/SIELA.2016.7543001
)
This is the author’s final accepted version.
There may be differences between this version and the published version.
You are advised to consult the publisher’s version if you wish to cite from
it.
http://eprints.gla.ac.uk/146208/
Deposited on: 18 August 2017
Enlighten – Research publications by members of the University of Glasgow
http://eprints.gla.ac.uk33640
Managing Renewable Intermittency in Smart Grid:
Use of Residential Hot Water Heaters as a Form of
Energy Storage
Linas Gelazanskas, Kelum A.A. Gamage
Department of Engineering Lancaster University Lancaster, United Kingdom
[email protected], [email protected]
Abstract— This paper discusses a novel wind generation
balancing technique to improve renewable energy integration to the system. Novel individual hot water heater controllers were modelled with the ability to forecast and look ahead the required energy, while responding to electricity grid imbalance. Artificial intelligence and machine learning techniques were used to learn and predict energy usage. In this research wind power data was used in most cases to represent the supply side, where focus was on the actual generation deviation from plan. It proved to be possible to balance the generation and increase system efficiency while maintaining user satisfaction. The methods developed in this research are not limited to wind power balancing and can also be used with any other type of renewable generation source.
Keywords— energy management; renewable sources; residential hot water heaters; smart grid
I. INTRODUCTION
The electricity supply-demand balancing becomes increasingly more difficult with the increased use of renewable energy sources in the energy production mix. Most renewable energy sources are intermittent and inherently hard to control with the existing techniques, where the current electricity grid operations remain relatively unchanged in the major part of the world. The technological advancement in communications, computational power and sensing needs to be adapted to the electricity sector for more optimal renewable energy integration. In general, there is a lot of room for research and development in the area of Smart Grid and to find alternative ways to better manage renewable generation.
This research aims to improve wind power integration and overall system reliability and covers alternative methods to substitute traditional backup power up to a certain limit with the help of energy storage at consumer level. Individual hot water forecasting methods are developed for smart hot water heaters and consequently, these forecasting models are used to develop smart distributed hot water heating system to enable demand response. Basically, these individual hot water heater controllers were modelled with the ability to forecast and look ahead the required energy, while responding to electricity grid imbalance.
II. METHODOLOGY AND MODELLING
A. Wind Power Data
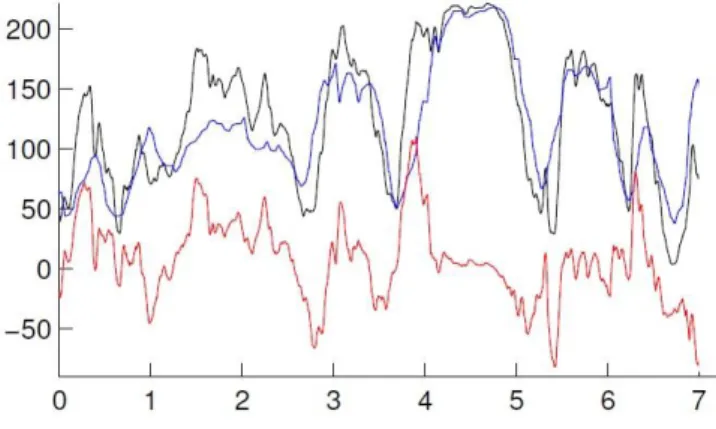
In this research, the primary objective of the proposed demand side management technique was to generate a backup power aggregator to cover the forecasting error associated in the wind power generation. Previously measured and forecasted wind power generation data, provided by the Lithuanian National Transmission System Operators (NTSO), was used to assess the performance of the system [1]. The wind generation forecast is shown in the below Fig. 1 and it is based on the next day-ahead predictions to comprise the electricity day-ahead market.
Figure 1: Actual wind generation (black), forecasted wind generation (blue) and the imbalance (red) in MW for a duration of one week. The installed capacity of the wind power plant is 222 MW.
B. Hot Water Consumption Data
The hot water consumption data used in this research was provided by the Energy Saving Trust, UK [2]. The data set consisted data collected during the years 2006 – 2007 corresponding to about 120 individual residential houses. It included temperature information from various locations, where hot water was supplied, and total volumetric consumption measured. For the purpose of this research, some
data sets were discarded to reduce errors in the hot water consumption measurements. The sampling rate of initial data was not constant. Measurements were recorded every 10 min, but when a run-off was detected, the sampling rate increased to 5 s. Before analysis started, the data were resampled at hourly intervals, by aggregating the volumetric consumption of every hour.
Figure 2: Average hot water consumption (kg) for 95 individual residential houses for a duration of one week.
C. Forecast Individual Hot Water Consumption
It is necessary to accurately forecast individual hot water consumption and compare it with aggregate forecasting results. This was done using different forecasting techniques including artificial neural network autoregressive modelling (NAR), artificial neutral network autoregressive with exogenous inputs modeling (NARX), seasonal decomposition of time series by Loess (STL), exponential smoothing (ETS), seasonal autoregressive integrated moving average (ARIMA) and other combinations of these models. The performance of these models was compared with benchmark models (mean, naïve, and seasonal naïve models) and the best model was chosen.
A NAR model was created using one hidden layer with 10 neurons; Fig. 3 (a) shows a simplified model diagram. The data division for training, testing and validation was chosen to be random for these time series, where the performance was measured using Mean Square Error (MSE). ANN was trained using Levenberg-Marquardt back-propagation training algorithm. An individual dwelling hourly volumetric hot water consumption time series were used to train the network. According to auto-correlation analysis, different sets of lags were tested to find the best performance.
(a)
(b)
Figure 3: (a) NAR and (b) NARX model topologies
The model was then converted from NAR to NARX by adding external inputs as shown in Fig. 3 (b). Here the ANN should be supplied with information containing the day of the week and whether it is a weekend or not. As a result, 6 dummy variables were constructed to represent weekday and additional dummy variable was used as a Boolean for marking weekends. Also, average hourly consumption profile (average value for the hour that is being predicted) was fed in as an external input. The performance of the models was measured by comparing regression value (R), normalized mean absolute error (nMAE), normalized root mean square error (nRMSE) and mean absolute scaled error (MASE).
D. Smart Hot Water Heater
The smart hot water heater controller in the proposed system derived based on open system energy balance. The controller can compute water temperature for the next 12 hours period. It controls the heating element according to the consumption forecasts (using the trained artificial neural network (ANN) model based on the past hot water consumption information [2]) and the signal sent from the smart grid (showing the requested duty cycle of the heating element) [3]-[5]. The signal from the grid is percentage-wise, where 0% means that the grid experiences a shortage of electricity, thus requesting to turn the heating element off, and 100% means a surplus of energy in the grid. The complete model was implemented in the Matlab Simulink software environment, where the amount of energy consumed by the electric heating element is added to the model as an input. The outputs of the model are energy consumed by hot water usage and thermal energy losses due to imperfect thermal insulation (calculated based on thermal conductivity and considering the temperature difference between water and ambient temperature).
E. Overall Behaviour of the System
The main goal of the proposed system is to generate a backup power aggregator to cover the day-ahead wind generation forecast errors. It enables the supply of the exact amount of wind energy that was sold in the day-ahead market and avoids charges for costly regulation ancillary services. Power to be regulated calculated comparing day-ahead forecast with the actual wind power generation. Since water heaters can only consume electricity (regulate down), the imbalance is added on top of the predicted normal consumption to enable up regulation. The predicted normal water heater consumption information can be taken from the distribution system operator or, in this work, it is modelled by the same ANN. Secondly, the actual electricity usage is aggregated and subtracted from the reference load. It is then used by the demand response controller to compute the request signal for the water heaters, which in turn decides whether to participate in the demand response or not. Every 5 min, the controller forecasts individual demand for the next 12 h and computes the ability to participate in the demand response. Forecast for 12 hours ahead is sufficient as 200 litres tank (with 1.5 kW heating element) takes similar amount of time to raise the temperature by 50 degrees. In the case of participation, the water heater reacts to the request signal and alters the energy use accordingly to balance wind forecast error.
III. RESULTS AND DISCUSSION
A. Forcasting Results
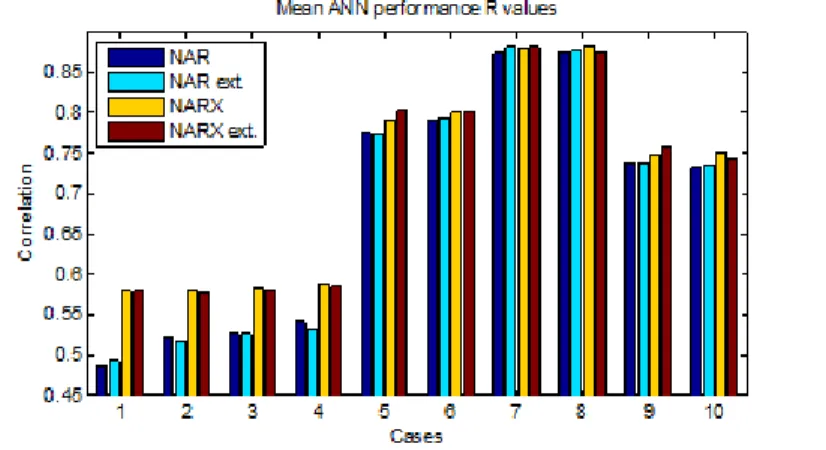
The simulation framework comprises 95 dwellings equipped with resistive hot water heater models of different sizes and power ratings, as well as ANN models for each dwelling. Figure 4 compares correlation values for different ANN lag scenarios of NAR and NARX, where 10 arbitrary cases were chosen. It can be seen that NARX model predicts better in all cases, though the relative difference is small in some cases. By looking at Table 1, it can be seen that cases 7 and 8 perform the best.
Figure 4: Comparison ofMean R values from ANN simulations (scenarios of NAR, NAR extended, NARX and NARX extended) for 10 different cases (see each case details in Table 1).
Table 1: The R values of NAR and NARX models for different cases
Table 1 and Fig. 4 summarise how well the models performed by showing the average performance measures from the best fitting model for every dwelling. For a particular dwelling, the best-performing models (case 7) were chosen by adjusting the parameters, for example p, d and q values in the ARIMA model were chosen using the Akaike or the Bayesian information criterion [6]. A standard deviation is also presented showing how much performance measures differ between houses (Figure 5). It can be seen that seasonal decomposition in conjunction with exponential smoothing
A B C D E F G H I J 0 0.2 0.4 0.6 0.8 1 1.2 1.4 Method Perfo rman ce V al u e
Figure 5: Model fitting results for individual dwelling consumption. Lines are: Blue - correlation coefficient; Red - normalise mean absolute error; Green - normalise root mean square error; Black - mean absolute scaled error. Methods are: A - mean method; B - naïve method; C - seasonal naïve (daily); D - seasonal naïve (weekly); E - seasonal decomposition of time series by Loess model (STL); F - exponential smoothing (ETS); G - seasonal autoregressive integrated moving average (ARIMA) 24 hours model; H – ARIMA 168 hours model; I – STL and ETS; J - STL and ARIMA.
(STL and ETS(A,N,N)) and ARIMA (STL and ARIMA(p, d, q)) perform the best. On average, they perform more than 30% better than the seasonal naive benchmark model.
B. Complete System Results
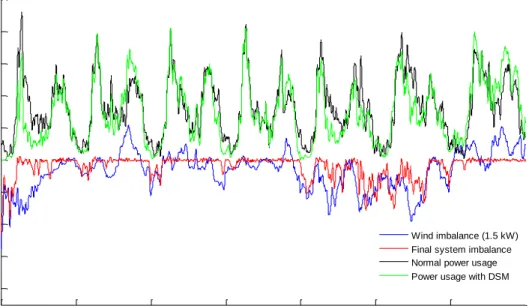
Normal power usage, wind imbalance, power usage with DSM and final system imbalance are shown in Fig. 6. The result is clearly evident that the proposed DSM technique is capable of lowering the energy requirements for hot water preparation and supplying an ancillary service (power regulation) to the grid with a minor change in user comfort. The average energy required to supply the same amount of hot water is decreased due to increased efficiency. The 1.5kW per household of installed wind power has been observed to be optimal, as higher values cause the system to saturate and increase the final imbalance, which contradicts the key objective of this work.
C. Summary
The technological advancement in communications, computational power and sensing needs to be adapted to the electricity sector for more optimal renewable energy integration. This is a key requirement as most renewable generation is decentralised. In this paper, a method to improve wind power integrity has been presented with a way of substituting traditional backup power at consumer level. Individual hot water forecasting methods are developed for smart hot water heaters, and then these forecasting models are used to develop smart distributed hot water heating system to enable demand response. These methods can be considered to
0 1 2 3 4 5 6 -0.8 -0.6 -0.4 -0.2 0 0.2 0.4 0.6 0.8 1 P o w e r, k W Days Wind imbalance (1.5 kW) Final system imbalance Normal power usage Power usage with DSM
be part of the emerging concept of demand side management, particularly managing renewable intermittency in smart grid.
ACKNOWLEDGMENT
The authors would like to acknowledge the financial support of the Department of Engineering and Faculty of Science and Technology, Lancaster University, UK, the Energy Saving Trust for providing the necessary hot water consumption data as well as Lithuanian National Transmission System Operator for providing the necessary wind generation data.
REFERENCES
[1] L. Gelažanskas and K.A.A. Gamage, Wind generation data, Data catalogue, Lancaster University library, UK, 2015.
[2] Measurement of domestic hot water consumption in dwellings. Technical report, Energy Saving Trust: London, UK, 2008.
[3] P. Du and N. Lu, “Appliance commitment for household load scheduling”, Smart Grid, IEEE Transactions on, vol. 2, pp. 411–419, June 2011.
[4] P. Kepplinger, G. Huber, and J. Petrasch, “Autonomous optimal control for demand side management with resistive domestic hot water heaters using linear optimization”, Energy and Buildings, vol. 100 pp. 50–55, 2015.
[5] M.H. Nehrir, R. Jia, D.A. Pierre, and D.J. Hammerstrom, “Power management of aggregate electric water heater loads by voltage control”, In Power Engineering Society General Meeting, 2007. IEEE, pages 1–6, June 2007.
[6] R.J. Hyndman. Documentation for R Package „forecast‟, May 2015.