THE MODEL OF DEFORMING MODE TUBE UNDER AXIAL LOADING
MUHAMAD SYAFIQ BIN ABDUL WAHAB
THE MODEL OF DEFORMING MODE TUBE UNDER AXIAL LOADING
MUHAMAD SYAFIQ BIN ABDUL WAHAB
A report submitted
in fulfilment of the requirements for the degree of
Bachelor of Mechanical Engineering (Structure & Materials)
Faculty of Mechanical Engineering
UNIVERSITI TEKNIKAL MALAYSIA MELAKA
i APPROVAL
I hereby declare that I have read this project report and in my opinion this report is sufficient in terms of scope and quality for the award of the degree of Bachelor of
Mechanical Engineering (Structure & Materials).
Signature : ………….………
Supervisor’s Name : PROF. DR. MD. RADZAI BIN SAID
ii DECLARATION
I declare that this project report entitled “The model of deforming mode tube under axial loading” is the result of my own work except as cited in the references.
Signature : ………...
Name : MUHAMAD SYAFIQ BIN ABDUL WAHAB
iii DEDICATION
iv
ACKNOWLEDGEMENTS
Alhamdulillah, all praises to Allah for the strengths and His blessing in completing this search. To the great prophet Muhammad (Allah peace be upon him) a prophet of mercy and the light of the Worlds.
Firstly, I would like to sincerely thank my supervisor Prof. Dr. Md Radzai Bin Said for his guidance, advices and support. Without his valuable assistance, this work would not has been completed. I am also indebted to my friends for their contributions. I takes this opportunity also to thank the Faculty of Mechanical Engineering’s laboratory management for their cooperation especially to the technicians during performing experimental works at the laboratory.
Most importantly, I am forever grateful my family who understands the importance of this work, none of this would have been possible without their patience and help.
v ABSTRACT
vi
ABSTRAK
Tiub berdinding nipis merupakan salah satu struktur menyerap tenaga yang telah digunakan untuk menyebarkan tenaga dan meningkatkan kecekapan kebolehtahanan hentakan. Semasa kemalangan berlaku, tiub berdinding nipis menyerap tenaga kinetik dan menukar kepada bentuk tenaga lain. Oleh itu, struktur menyerap tenaga ini memberikan penyerapan tenaga yang mencukupi sebelum memukul manusia. Kajian ini adalah untuk mengkaji tiub aluminium persegi dan tiub PVC bulat yang tertakluk kepada beban statik kuasi dengan menggunakan mesin mampatan universal atau mesin Instron. Mod perubahan bagi kedua-dua tiub diperhatikan. Model kertas dibentuk dengan menggunakan kertas tebal untuk menggambarkan cara perubahan bagi tiub aluminium persegi sahaja. Ujian tegangan dijalankan bagi kedua-dua tiub untuk mendapatkan sifat-sifat mekanik tiub. Terdapat tiga perbezaan panjang untuk setiap jenis tiub telah diuji di bawah beban statik kuasi. Keputusan eksperimen yang diperolehi daripada ujian telah dibandingkan dengan keputusan teori yang diperolehi daripada persamaan matematik. Dari perbandingan, satu persetujuan yang baik telah dicapai di antara keputusan teori dan ujikaji. Analisis terhadap graf jarak beban termasuk keputusan beban puncak, purata beban, penyerapan tenaga dan plastik lipatan. Lipatan plastik untuk tiub PVC adalah lebih besar daripada tiub aluminium kerana sifat kekenyalannya. Hasil daripada ujian, tiub PVC bulat dan aluminium persegi tiub berubah dalam mod diamond untuk ketiga-tiga perbezaan panjang. Siri model kertas dibentuk untuk pelbagai peringkat proses perubahan untuk menggambarkan fenomena proses pemampatan tiub aluminium persegi berlaku semasa ujian. Kesimpulannya, keputusan yang diperoleh daripada kajian ini seperti siri model kertas perubahan bentuk tiub aluminium segi empat sama akan digunakan sebagai alat bantu pembelajaran yang baru untuk meningkatkan kefahaman tentang fenomena ujian mampatan.
vii
TABLE OF CONTENTS
PAGE APPROVAL DECLARATION DEDICATION ACKNOWLEDGEMENTS ABSTRACT ABSTRAK
TABLE OF CONTENT LIST OF TABLES LIST OF FIGURES
LIST OF ABBREVIATIONS
LIST OF SYMBOLS
i ii iii iv v vi vii x xi xiv xv CHAPTER
1 INTRODUCTION 1
1.1 Background 1
1.2 Problem Statement 3
1.3 Objective 3
1.4 Scope Of Project 3
2 LITERATURE REVIEW 4
2.1 Introduction 4
2.2 Energy Absorption 5
2.2.1 Collapse Modes 5
2.3 Quasi-Static Test 7
2.3.1 Axial Loading on Circular Polyvinylchloride (PVC) 8
2.3.2 Axial Loading on Square Aluminium 10
viii
2.5 Paper Models of Deformation Modes 12
2.6 Low Speed Camera 14
3 METHODOLOGY 15
3.1 Introduction 15
3.2 Flow Chart for Tensile Test 16
3.3 Material Selection for Tensile Test 17
3.4 Material Preparation for Tensile Test 16
3.4.1 Engineering Drawing for Tensile Test 19
3.4.2 Cutting Process of Tensile Test Specimen 20
3.4.3 Fabrication of Tensile Test Specimen 21
3.5 Tensile Testing 22
3.6 Flow Chart for Quasi Static Testing 23
3.7 Material Selection For Quasi Static Testing 24
3.8 Material Preparation for Quasi Static Testing 25
3.9 Experimental Setup for Quasi Static Testing 27
3.10 Develop a Paper Model Using Thick Paper 28
4 RESULT AND ANALYSIS 30
4.1 Introduction 30
4.2 Tensile Test 31
4.2.1 Graph Tensile Stress Against Tensile Strain 31
4.2.2 Experimental Tensile Testing Result 33
4.3 Type of Deforming Modes for Aluminium and PVC Tubes under Quasi Static Test
34
4.3.1 Deforming Modes for Aluminium Tubes under Quasi Static Test
34
4.3.2 Deforming Modes for PVC Tubes under Quasi Static Test
36
4.4 Quasi Static Test Result 37
4.4.1 Square Aluminium Tube with Length 100mm 37
4.4.1.1 Comparison Between Experimental and Theoretical Value for Aluminium Tube
ix with Length 100mm
4.4.2 Square Aluminium Tube with Length 150mm 41
4.4.2.1 Comparison Between Experimental and Theoretical Value for Aluminium Tube with Length 150mm
43
4.4.3 Square Aluminium Tube with Length 200mm 45
4.4.3.1 Comparison Between Experimental and Theoretical Value for Aluminium Tube with Length 200mm
48
4.4.4 Sample Calculation for Square Aluminium Tubes
50
4.4.5 Circular PVC Tube with Length 100mm 52
4.4.5.1 Comparison Between Experimental and Theoretical Value for PVC Tube with Length 100mm
54
4.4.6 Circular PVC Tube with Length 150mm 56
4.4.6.1 Comparison Between Experimental and Theoretical Value for PVC Tube with Length 150mm
58
4.4.7 Circular PVC Tube with Length 200mm 60
4.4.7.1 Comparison Between Experimental and Theoretical Value for PVC Tube with Length 200mm
63
4.4.8 Sample Calculation for Circular PVC Tubes 65
4.5 Paper Model For Square Aluminium Tube 67
5 CONCLUSION AND RECOMMENDATION 69
5.1 Introduction 69
5.2 Conclusion 69
5.3 Recommendation 70
REFERENCES 71
x
LIST OF TABLES
TABLE TITLE PAGE
2.1 Collapse modes under axial loading 5
4.1 Experimental tensile testing result for aluminium 33
4.2 Experimental tensile testing result for PVC 33
4.3 Time taken for the tubes to compressed 60% from their total length 35
4.4 Comparison between experimental and theoretical results of
quasi-static testing for aluminium tube with length 100mm
40
4.5 Comparison between experimental and theoretical results of
quasi-static testing for aluminium tube with length 150mm
44
4.6 Comparison between experimental and theoretical results of
quasi-static testing for aluminium tube with length 200mm
49
4.7 Properties of square aluminium tubes 50
4.8 Comparison between experimental and theoretical results of
quasi-static testing for PVC tube with length 100mm
55
4.9 Comparison between experimental and theoretical results of
quasi-static testing for PVC tube with length 150mm
59
4.10 Comparison between experimental and theoretical results of quasi-static testing for PVC tube with length 200mm
64
xi
LIST OF FIGURES
FIGURE TITLE PAGE
2.1 Force displacement curve for collapse mode 6
2.2 INSTRON 5585 testing machine 8
2.3 PVC tubes on testing machine 9
2.4 Local buckling at the upper part of the tubes 9
2.5 Collapse modes for aluminium square tubes 10
2.6 Euler buckling deforming mode 11
2.7 Theoretical model of a collapsing tube showing details of travelling
hinge
12
2.8 Series of collapse mode and paper models 13
2.9 Paper models of different in length 13
2.10 Low speed digital video camera 14
3.1 Schematic representation of general experimental setup 15
3.2 Flow chart of the testing 16
3.3 Aluminium square tubes 17
3.4 Polyvinylchloride (PVC) tubes 17
3.5 Dimension of tensile test specimen for aluminium (ASTM E8) 18
3.6 Dimension of tensile test specimen for PVC (ASTM D638) 19
3.7 Drawing of tensile test specimen for aluminium 19
3.8 Drawing of tensile test specimen for PVC 20
3.9 Laser cutting machine 20
3.10 Tensile test specimen for PVC and aluminium 21
3.11 INSTRON 8872 testing machine and set up for tensile testing 22
3.12 Flow chart for quasi static testing 23
xii
3.14 PVC circular tubes 24
3.15 Bandsaw machine 25
3.16 Cutting process for aluminium tubes 26
3.17 Cutting process for PVC tubes 26
3.18 Three difference of height for aluminium and PVC tubes 26
3.19 Experimental set up for quasi static testing 27
3.20 Manila paper 28
3.21 The lines of folding and point of plastic hinges 29
4.1 Tensile test specimens break (aluminium and PVC) 31
4.2 Graph of tensile stress against tensile strain for aluminium 32
4.3 Graph of tensile stress against tensile strain for PVC 32
4.4 Aluminium tubes with three different length (100mm, 150mm,
200mm)
34
4.5 PVC tubes with three different length (100mm, 150mm, 200mm) 36
4.6 Sample 1 of load displacement curve for the aluminium tube with
length 100mm
37
4.7 Sample 1 of deforming mode for aluminium tube with length 100mm 38
4.8 Sample 3 of load displacement curve for the aluminium tube with
length 150mm
41
4.9 Sample 1 of deforming mode for aluminium tube with length 150mm 42
4.10 Sample 1 of load displacement curve for the aluminium tube with
length 200mm
45
4.11 Sample 1 of deforming mode for aluminium tube with length 200mm 46
4.12 Sample 1 of load displacement curve for PVC tube with length
100mm
52
4.13 Sample 1 of deforming mode for PVC tube with length 100mm 53
4.14 Sample 1 of load displacement curve for PVC tube with length
150mm
56
4.15 Sample 1 of deforming mode for PVC tube with length 150mm 57
4.16 Global buckling for sample 2 with length 200mm 60
4.17 Sample 1 of load displacement curve for PVC tube with length
200mm
61
xiii
4.19 Top view of tube and paper model 67
xiv
LIST OF ABBEREVATIONS
IEA - Impact Energy Absorption
PVC - Polyvinylchloride
xv
LIST OF SYMBOLS
Pcr - Critical Buckling Load
Pm - Mean Load
E - Young’s Modulus / Energy Absorb
σu - Tensile stress at yield
I - Moment of Inertia
L - Length of Tubes
S - Deformation
Hm - Half plastic folding
t - Thickness
v - Poisson Ratio
OD / d - Outer Diameter
mm - Millimetre
w - Width
LO - Overall Length
WO - Overall Width
GPa - Giga Pascal
1 CHAPTER 1
INTRODUCTION
1.1 BACKGROUND
2
Polyvinylchloride (PVC) and aluminium are most popular material that are suitable in making the IEA device. This is because the material provide significant benefit such has high strength and durability, lightweight materials and lower in cost of processing or machining process. PVC was introduced in industry on 1832 and the first PVC pipes and tubes were produced on 1932 using a roll mild and hydraulic extruder (Pled et al., 2007). While, the first aluminium was produced in 1885 that containing iron and copper (Sheasby & Pinner, 2001). Too many application using this material due to low density and high mechanical strength.
One of the testing to deform the PVC and aluminium tubes is by using quasi-static testing (Ahmad, 2009). In this testing, the tubes are compressed at a constant rate using conventional tensional testing machine (INSTRON 8802). Tubes are compressed at a very slow constant speed in range of 0.0015 m/s up to 0.1 m/s. The height of the collapse modes of the tubes depend on the long of the tube before testing (Meng et al., 1983).
3 1.2 PROBLEM STATEMENT
One of the objective of this topic is expose to the students on how the deforming modes occurred on the tubes after undergoes an impact test. Nowadays, additional tools is needed to understand on how the phenomena of the deforming mode of the tubes occurred during the testing. So, study and research about the properties of PVC and aluminium is needed in identifying the behaviour of deforming modes for both materials. Then, modelling the results of the deforming mode for square aluminium tubes only by using thick paper which it can be used as a teaching and learning purpose. The series of paper model is developed for presentation in order to increase the understanding of students on phenomenon occurred during compression test is various stages.
1.3 OBJECTIVE
The objectives of this project are as follows:
1. To perform and observe the deforming mode of PVC and aluminium tubes with
different length under quasi-static loading.
2. To model the deforming mode of the square aluminium tube only by using a thick
paper.
1.4 SCOPE OF PROJECT
The scopes of this project are:
1. Carry out a preliminary study and review past research on the scope of study
about quasi-static loading and deforming modes which is based on standard.
2. Perform a quasi-static loading on PVC and aluminium tubes and observe their
deforming mode.
3. Result of deforming mode for square aluminium tube only are modelling by
4 CHAPTER 2
LITERATURE REVIEW
2.1 INTRODUCTION
This chapter study about the paper model of the square aluminium tubes under quasi-static loading testing, axial loading on both types of materials used (aluminium and polyvinyl chloride, PVC) and high speed digital camera to capture the impact event.
5 2.2 ENERGY ABSORPTION
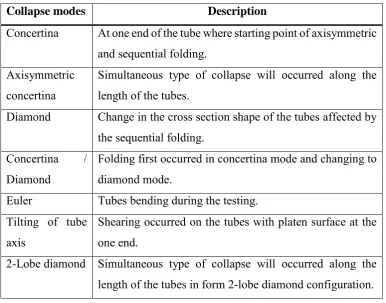
Energy absorption means that the required energy to cause the collapse of the structures or tubes under the impact loading (Andrews et al., 1983). The energy firstly transformed into elastic strain energy in the deformed tubes and the remainder of the energy is dissipated in plastic deformation on the tubes during collapse occurred (Alghamdi, 2001). There are seven types of collapse modes on tubes that has been identified which are concertina, axisymmetric concertina, diamond, concertina/diamond, Euler, tilting of tube axis and 2-lobe diamond (Albert et al., 2016).
2.2.1 COLLAPSE MODES
[image:22.595.139.526.440.743.2]Results from the axial loading to the test tubes produced seven types of collapse modes which is (Andrews et al., 1983):
Table 2. 1: Collapse modes under axial loading
Collapse modes Description
Concertina At one end of the tube where starting point of axisymmetric
and sequential folding. Axisymmetric
concertina
Simultaneous type of collapse will occurred along the length of the tubes.
Diamond Change in the cross section shape of the tubes affected by
the sequential folding.
Concertina /
Diamond
Folding first occurred in concertina mode and changing to diamond mode.
Euler Tubes bending during the testing.
Tilting of tube axis
Shearing occurred on the tubes with platen surface at the one end.
6
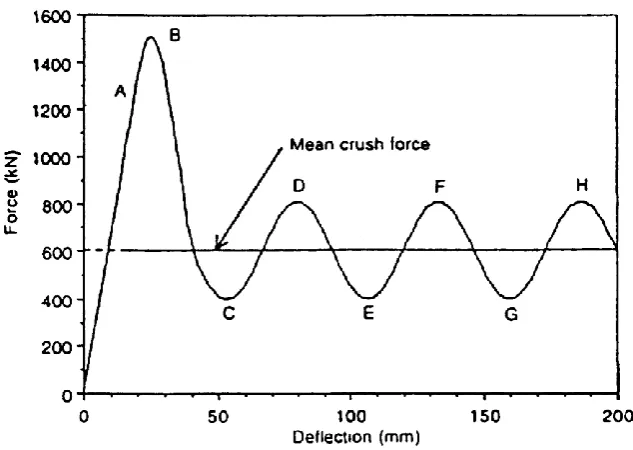
[image:23.595.159.476.174.399.2]There are four different regions in the force-displacement curve for the collapse mode as shown in the Figure 2.1 which is the post-buckling stage, elastic stage, the crippling stage and the collapse stage.
Figure 2. 1: Force displacement curve for collapse mode (Source : Junning Sun, 2000)
7 2.3 QUASI-STATIC TEST
The quasi-static test was carried out by using INSTRON 5585 testing machine (accuracy ± 1% of applied load) as shown in Figure 2.2. The plate at the lower part of the machine was fixed and not move (Trondheim, 2005). To ensure uniform load distribution of the test specimens, the load was applied through a rigid steel plate that connected to the hydraulic actuator. The friction between the rigid steel plate and the upper end surface of the test specimens is very important to prevent from any movement during the testing process. The axial load was applied at a constant speed during the testing which the speed in a range of 1.5 x 10⁻³ m/s to 0.1 m/s. The actual crush condition didn't be able represent by doing this quasi-static tests because during the crush, the structures of the tubes will dissipate energy over the entire period until the tubes are completely collapses. It means that the speed of the tests is one of the major factor influences on the capability of energy absorption. So, materials selection under the quasi-static tests are usually not represent the real performance of the structure in the event of a crash.
There are some advantages of the quasi-static tests (Junning Sun, 2000):
i. Lower maintenance and reduce the risk of damage on the crosshead of the tubes.
ii. Test’s equipment usually easy to conduct and operate.
iii. This test usually run to understand the different failure modes of the different
materials used based on the crush rate.
There are some disadvantages of the quasi-static test:
i. This quasi-static tests usually represent not an actual characteristic of the selected materials as a real performance of the structure in the event of a crash. This is because this test usually conducted to investigate the failure modes of the tubes.