www.adv-geosci.net/29/33/2011/ doi:10.5194/adgeo-29-33-2011
© Author(s) 2011. CC Attribution 3.0 License.
Advances in
Geosciences
Can a multi-model approach improve hydrological ensemble
forecasting? A study on 29 French catchments using 16 hydrological
model structures
J. A. Vel´azquez1, F. Anctil1, M. H. Ramos2, and C. Perrin2
1Chaire de recherche EDS en pr´evisions et actions hydrologiques, G´enie civil et g´enie des eaux, Universit´e Laval,
Qu´ebec, Canada
2Cemagref, Hydrosystems and Bioprocesses Research Unit, Parc de Tourvoie, BP 44, 92163 Antony Cedex, France
Received: 9 July 2010 – Revised: 19 November 2010 – Accepted: 19 November 2010 – Published: 28 February 2011
Abstract. An operational hydrological ensemble forecasting system based on a meteorological ensemble prediction sys-tem (M-EPS) coupled with a hydrological model searches to capture the uncertainties associated with the meteorological prediction to better predict river flows. However, the struc-ture of the hydrological model is also an important source of uncertainty that has to be taken into account. This study aims at evaluating and comparing the performance and the reliability of different types of hydrological ensemble pre-diction systems (H-EPS), when ensemble weather forecasts are combined with a multi-model approach. The study is based on 29 catchments in France and 16 lumped hydro-logical model structures, driven by the weather forecasts from the European centre for medium-range weather fore-casts (ECMWF). Results show that the ensemble predictions produced by a combination of several hydrological model structures and meteorological ensembles have higher skill and reliability than ensemble predictions given either by one single hydrological model fed by weather ensemble predic-tions or by several hydrological models and a deterministic meteorological forecast.
1 Introduction
In general, an ensemble forecasting system seeks to assess and to provide useful information on the uncertainty of hy-drological predictions by proposing, at each time step, an en-semble of forecasts from which one can estimate the prob-ability distribution of the predictant (the probabilistic fore-cast), in contrast with a single estimate of the flow for which no distribution is obtainable (the deterministic forecast).
Ef-Correspondence to: J. A. Vel´azquez
forts towards the development of probabilistic hydrological prediction systems have been made with the adoption of en-sembles of numerical weather predictions (NWPs). Several scientific programs thus address the issue of ensemble pre-dictions in hydrometeorological forecasting chains: see for instance, the COST 731 action (Zappa et al., 2010), the MAP D-PHASE initiative (Zappa et al., 2008) and the Hydrologi-cal ensemble prediction experiment HEPEX (Schaake et al., 2007; Thielen et al., 2008). Several case studies have in-tended to evaluate the additional information provided by different available Meteorological Ensemble Prediction Sys-tems (M-EPS) in a hydrological context (see the review by Cloke and Pappenberger, 2009). Most of these studies have investigated ensemble flow predictions from a single hydro-logical model set-up, over one catchment or a limited num-ber of them. In these cases, only the uncertainty originat-ing from weather predictions is assessed, through the use of meteorological ensembles. For example, the M-EPS of the European Centre for Medium-Range Weather Forecasts (ECMWF) was evaluated in the case studies reported by:
– Roulin and Vannitsem (2005) for two catchments in Belgium and a water-balance-based model;
– Bartholmes and Todini (2005) for the Po river basin and the TOPKAPI distributed hydrological model;
– Olsson and Lindstr¨om (2008) for 45 catchments in Swe-den and the HBV model;
– Younis et al. (2008) for the Elbe river basin and the LIS-FLOOD distributed model;
– Jaun et al. (2008) and Jaun and Ahrens (2009) for the upper Rhine basin and the semi-distributed hydrological model PREVAH;
– Renner et al. (2009) for 134 sub-catchments of the Rhine river basin and the HBV model.
– Kalas et al. (2008) for the Morava catchment in the Danube River basin, and the European Flood Alert Sys-tem (EFAS) based on the LISFLOOD model.
Some case studies use quantitative weather predictions com-ing from two or more sets of M-EPS, each comcom-ing from different meteorological centers (e.g., Thirel et al., 2008), and/or evaluate outputs from more than one hydrological model (e.g., Ranzi et al., 2009; Randrianasolo et al., 2010). However, ensemble flow prediction sets are usually investi-gated separately.
To provide ensemble predictions for hydrological applica-tions, an ensemble of meteorological forecasts can also be constructed by combining deterministic forecasts from dif-ferent weather agencies. For example, a case study is pre-sented by Davolio et al. (2008) based on deterministic fore-casts from six high-resolution limited-area models coupled with a distributed hydrological model for some events in the Reno catchment in Italy. Results showed that the tested sys-tem is promising for the prediction of peak discharges for warning purposes. The M-EPS for a single center only ac-counts for part of the uncertainties originating from initial conditions and model parameterization. The TIGGE net-work (THORPEX Interactive Grand Global Ensemble, Park et al., 2007) is a World Meteorological Organization project that searches to capture other sources of uncertainties associ-ated with the meteorological model structure and the ensem-ble size, through the set up of a grand-ensemensem-ble database, which comprises M-EPS from different meteorological cen-ters around the world. The TIGGE archive has been tested in hydrology in a combined multi M-EPS framework. Pappen-berger et al. (2008) used data from seven M-EPS (216 mem-bers) as meteorological input to the European Flood Alert System (Thielen et al., 2009), based on the LISFLOOD dis-tributed hydrological model, for the simulation of the Oc-tober 2007 flood event in Romania. The results showed that the grand-ensemble provides more reliable predictions of flood events. He et al. (2010) used predictions from six meteorological agencies to drive a hydrological forecasting model during the July–September 2008 flood event in the Huai River basin in China. Their results indicated that the multi-model TIGGE archive is a promising tool for 10-day-ahead discharge forecasting.
Although considered as an important contribution to the total uncertainty of flow predictions, uncertainties arising from the hydrological modeling are not often assessed. Re-cently, Dietrich et al. (2009) proposed to account for the un-certainty coming from weather ensemble predictions and the hydrological model. This was based on a multimodel su-perensemble of M-EPS forecasts, while the uncertainty of the hydrological model is represented by a parameter ensemble from the conceptual rainfall-runoff model ArcEGMO. Un-certainties from the structure of the hydrological model, i.e., in the mathematical representation of the hydrological pro-cesses involved in the rainfall-runoff transformation, were
however not considered. An operational forecasting system that takes into account model uncertainty is presented by Hopson and Webster (2010) for the Brahmaputra and Ganges Rivers. It is based on the ECMWF 51-member ensemble prediction system and two hydrological models (semi dis-tributed and lumped). In this system, multimodel discharge forecasts are generated for each ensemble member, by indi-vidually combining hydrological model outputs for the same ensemble member, according to the philosophy of multi-model regression weighting coefficients of Krishnamurti et al. (1999) and Georgakakos et al. (2004).
The aim of the present study is to evaluate and compare the performance and the reliability of different types of hy-drological ensemble prediction systems (H-EPS), by taking into account uncertainties from the meteorological input and the hydrological model structure, as well as by exploiting all the outputs generated, instead of only retaining the single (combined) ensemble prediction. The scenarios are built on the basis of 16 different lumped rainfall-runoff model struc-tures and 9-day ECMWF ensemble and deterministic fore-casts. The systems were implemented over 29 French catch-ments, representing a large range of hydro-climatic condi-tions, and evaluated over a period of 17 months. Three types of ensembles were constructed:
1. 16-member ensemble (all 16 models are driven by the deterministic forecast),
2. 50-member ensemble (each individual model is driven by the 50-member M-EPS forecast),
3. 800-member ensemble (all 16 models are driven by the 50-member M-EPS forecast).
The performance of the forecasting ensembles is first com-pared with their deterministic counterpart. Then, the reliabil-ity of each H-EPS is assessed through reliabilreliabil-ity diagrams. The operational value of the H-EPS systems is tested through their ability to detect strong events, by evaluating hit rates, false alarm rates and the Relative Operating Characteristic for discharges exceeding the 90% quantile. Results are dis-cussed in an operational perspective.
2 Methodology
Catchments and models are presented in this section, as well as the scores and tools used to evaluate the performance and reliability of the ensemble predictions.
2.1 Catchments and hydro-meteorological data
The study is conducted over 29 French catchments with areas ranging from 1470 km2to 9390 km2. Catchments are spread all over France and represent a large variety of physical con-ditions in terms of size, topography, geology, soil, land use, and climate (Fig. 1). The mean annual rainfall ranges from
Table 1. Main characteristics of the studied catchments.
Catchment Mean annual Mean annual Mean annual
area rainfall potential discharge
evapotranspiration
(km2) (mm) (mm) (mm)
Minimum 1470 667 619 130
Median 2990 948 684 343
Maximum 9390 1394 820 789
667 mm to 1394 mm, while mean annual discharges vary be-tween 130 mm and 789 mm (Table 1). A characteristic time scale for the hydrological response was evaluated for each catchment. In this study, this response time scale was eval-uated through the shape analysis of observed flood hydro-graphs, as proposed by Sauquet et al. (2008). Dimension-less hydrographs were computed, while the response time is defined as one third of the median duration for which dis-charges are greater than half of the peak flow. For the stud-ied catchments, the average response time corresponds to 3.2 days.
Temperature, rainfall and flow data are available at a daily time step over the period extending from 1970 to 2005, and were used for the calibration and validation of the hydro-logical models in each catchment. Observed data for the period 11 March 2005 to 31 July 2006 was used only for the evaluation of the forecasts. The forecast verification riod is thus independent from the calibration/validation pe-riod. Rainfall data come from the meteorological analysis system SAFRAN of M´et´eo-France (see Quintana-Segu´ı et al., 2008 for details). They consist of rainfall accumulated at a daily time step and available over France at an 8x8-km grid resolution. Temperature data were used to compute po-tential evapotranspiration using the formulation proposed by Oudin et al. (2005). Daily streamflow data come from the French database Banque Hydro that archives river water lev-els and flows for more than 3000 gauging stations in France (http://www.hydro.eaufrance.fr/). The length of available ob-served streamflow time series varies according to the catch-ment, with, on average, 29 years of available daily data for the catchment dataset used here.
2.2 Rainfall forecasts from ECMWF
ECMWF rainfall forecasts were available for the verifica-tion period of 17 months (11 March 2005 to 31 July 2006) and were provided at a 0.5◦×0.5◦lat/lon grid resolution over France. They consist of the ECMWF deterministic forecasts (M-DPS), based on the best estimate analysis, and the 50 perturbed forecasts of the M-EPS (see Buizza et al., 1999). Forecasts are issued at 12:00 UTC and extend over 240 h. Rainfall amounts were accumulated at 24-h time steps, start-ing at 0 h to match with observed daily data, which resulted in
Fig. 1. Location of the 29 studied catchments in France.
nine daily lead times (hereafter, D1 to D9). No bias removal or disaggregation was performed. For each catchment, areal mean rainfall forecasts were computed by averaging the rain-fall amounts of each grid above the catchment, weighted by the percentage of the catchment area inside the grid. 2.3 Hydrological models
The sixteen hydrological models applied in this study are lumped reservoir-type models and correspond to various con-ceptualizations of the rainfall-runoff transformation at the catchment scale. They are of low to moderate complexity: the number of parameters to calibrate against observed data ranges from 3 to 13. Table 2 lists the tested models, along with their number of optimized parameters. All the models include a soil moisture accounting procedure in their repre-sentation of the hydrological production function, but with various formulations (linear or non linear, possibly with sev-eral soil layers, etc.). The routing module includes from 1 to 5 linear or non linear stores, as well as unit hydrographs or pure time delays. Some of the models include a non-conservative function to adjust the water balance (correc-tion factors of inputs or groundwater exchange func(correc-tions). In this study, all the models were applied in the same condi-tions (some original model structures were modified to match
Table 2. Models studied, with their identification number, number
of optimized parameters and main reference.
ID Model Number of Derived from
optimized parameters
1 GR4J 4 Perrin et al. (2003)
2 HBV0 9 Bergstr¨om et al. (1973)
3 GR3J 3 Berthet et al. (2009)
4 WAGE 8 Warmerdam et al. (1997)
5 PDM0 8 Moore et al. (1981)
6 MORD 6 Garc¸on (1999)
7 CREC 8 Cormay et al. (1973)
8 TANK 10 Sugawara (1979)
9 SMAR 9 O’Connell et al. (1981)
10 TOPM 8 Michel et al. (2003)
11 HYM0 6 Yadav et al. (2007)
12 CEQU 9 Girard et al. (1972)
13 IHAC 6 Jakeman et al. (1990)
14 SIMH 8 Chiew et al. (2002)
15 MOHY 7 Fortin et al. (2006)
16 SACR 13 Burnash et al. (1973)
the test framework): they were run at a daily time step, us-ing the same rainfall and potential evapotranspiration inputs, and were calibrated with the same optimization procedure using the local search procedure described by Edijatno et al. (1999), applied in combination with a pre-screening of the parameter space as proposed by Mathevet (2005). The objective function was the root mean square error. Note that the objective here is not to test the original structures and compare them, but rather to have a variety of conceptual-izations to build ensemble flow predictions that account for uncertainties in the structure of lumped hydrological mod-els. Most of these models were previously tested by Perrin et al. (2001) and detailed presentations are provided by Math-evet (2005). It is out of the scope of this article to present the models and full descriptions of each model structure can be found in the references listed in Table 2.To avoid confusion with the original model from which they are derived, only 4 letter acronyms are used.
2.4 Experimental setup
Flow forecasting was performed in two steps:
1. the models were individually calibrated and validated for each watershed, based on the available observations; 2. the 12:00 UTC ECMWF meteorological deterministic forecasts (M-DPS) and the ensemble prediction system (M-EPS) were used to predict daily streamflows up to 9 days ahead over 507 days from March 2005 to July 2006 (period not used in calibration). The assimilation
of observed flow data was done by a simple objective output updating based on Refsgaard (1997).
Three types of hydrological ensemble prediction sets (H-EPS) were constructed, consisting of 16, 50, and 800 mem-bers (Table 3):
– The 16-member ensemble is obtained by running all 16 hydrological models with the deterministic meteorolog-ical forecast as input. Each catchment has thus 1 H-EPS of 16 members. An average performance per catchment is calculated over the evaluation period and the mean value over all catchments is considered.
– The 50-member ensemble consists of using the 50 per-turbed forecasts from the M-EPS as input to each in-dividual hydrological model. Each catchment has thus 16 H-EPS of 50 members. For each model, the corre-sponding H-EPS is evaluated at each catchment, result-ing on an average performance per catchment over the evaluation period. An average value (mean over the 29 catchments) is obtained for each model. The 16 scores obtained are graphically depicted by box plots.
– In the 800-member ensemble, all 16 models are driven by the 50 forecast members from the M-EPS and all the outputs are considered as a single ensemble. Each catchment has thus 1 H-EPS of 800 members. An aver-age performance per catchment is calculated over the evaluation period and the mean value over all catch-ments is considered.
The simple model average method (Shamseldin et al., 1997) was used to combine the 16-member and the 800-member ensembles to obtain one single value of each type of ensem-ble, so they can be compared with the single-model deter-ministic forecast obtained with the M-DPS.
2.5 Performance and reliability
The evaluation of the performance of the deterministic simu-lations is based on the absolute error (AE). The performance of the probabilistic simulations was assessed with the Contin-uous Ranked Probability Score (CRPS), (Matheson and Win-kler, 1976). The main advantage of these two scores is that they can be directly compared (Gneiting and Raftery, 2007). It thus provides a simplified way to compare the performance of ensemble simulations against the performance of deter-ministic simulations, for each individual catchment. An an-alytical solution to obtain the value of the integral defining the CRPS was proposed by Gneiting and Raftery (2007) and applied for normal predictive distributions. In this study, a Monte-Carlo approximation was used with a gamma distri-bution adjusted to the predictive function. In order to com-pare the different catchments, a Skill Score of the mean CRPS (here, SSCRPS)was calculated using the climatology
Table 3. Scenarios of hydrological ensemble predictions (H-EPS) tested in this study, based on 16 hydrological models, and deterministic
(M-DPS) and probabilistic (M-EPS) rainfall forecasts.
Meteorological Forecast
Hydrological M-DPS M-EPS
models (Deterministic) (Probabilistic)
Individual Deterministic forecast (H-DPS) 50-member ensemble
All 16-member ensemble 800-member ensemble
Reliability refers to the statistical consistency between simulations and observations. For instance, a reliable 90% confidence interval calculated using the predictive distribu-tion funcdistribu-tion should, on average, contain the observed value in 9 cases out of 10. In this study, the reliability diagram was used to evaluate reliability. It is a graphical approach to represent the performance of probability simulations of di-chotomous events (Wilks, 1995). Nine confidence intervals were verified, ranging from 10% to 90%. For each forecast, it was established whether or not the observation was included in the confidence intervals. This operation was repeated for all forecast-observation pair, so the mean effective coverage may be drawn against the nominal ones.
The relative operating characteristic (ROC) curve (Peter-son et al., 1954; Ma(Peter-son, 1982) plots the probability of detec-tion (POD) versus the probability of false detecdetec-tion (POFD). The POD is the fraction of the observed ”yes” events that were correctly forecasted. The POFD is the fraction of the observed “no” events that were incorrectly forecasted. The area under the ROC curve characterizes the quality of a sim-ulation system’s ability to correctly anticipate the occurrence or non occurrence of the events. The ROC area ranges from 0 to 1, 0.5 indicating no skill and 1 being the perfect score. ROC measures the ability of the simulation to discriminate between two alternative outcomes, thus measuring resolu-tion. It is not sensitive to bias in the simulation and thus gives no information about reliability.
3 Results
Before comparing the hydrological ensembles, the perfor-mance and reliability of the meteorological ensembles and the diversity of the lumped models are assessed. The analysis of the precipitation forecasts from the ECMWF M-EPS (not shown) revealed that the performance for all 29 catchments decreases, as expected, with increasing lead time, while re-liability was achieved for lead times greater or equal to 3 days. For each lumped model, the 50-member MAE val-ues are evaluated for all catchments and forecast lead times (Fig. 2). Results show that the models differ in performance; however, none is clearly better or worse than all the others. Note that Table 2 applies the model ordering given by Fig. 2.
1 2 3 4 5 6 7 8 9 10 11 12 13 14 15 16 0 0.1 0.2 0.3 0.4 0.5 0.6 MAE (mm) Model
Fig. 2. Mean absolute error (MAE) calculated for the 16 lumped
hydrological models and for all forecast lead times (1 to 9 days) over a 17-month period and for the 29 studied catchments. The box has lines at the lower, median, and upper quartile values (IQR) and
whiskers extend to 1.5×IQR.
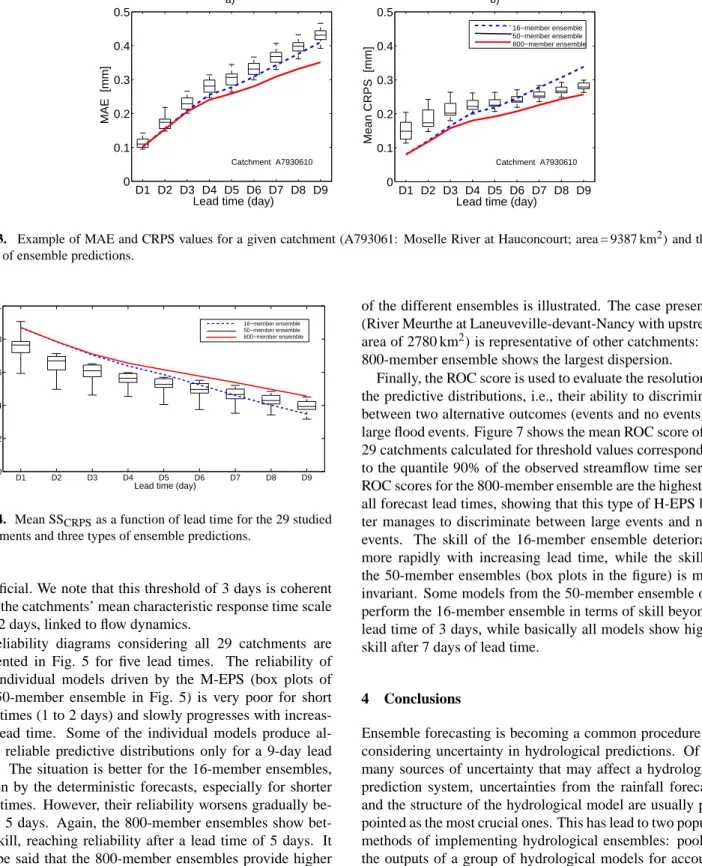
Is there more valuable information in the H-EPS than in the deterministic predictions, when comparing MAE and mean CRPS values? Results obtained for each catchment confirm the superiority of the H-EPS, as illustrated by the ex-ample given in Fig. 3 for the Moselle River at Hauconcourt (catchment A7930610 with an upstream area of 9387 km2), where the mean CRPS is lower than the MAE. When looking at the results in details, best results are achieved for the MAE (deterministic) and for the mean CRPS (probabilistic) when all 800 members are considered. The 16-member ensemble (driven by the deterministic forecasts) is competitive up to lead times of about 3 days. For these shorter lead times, the 50-member ensemble, where individual models are driven by ensemble predictions, clearly underperforms. For longer lead times, however, some individual models driven by the M-EPS perform better than the 16-member ensemble (as can be seen as the box plots of the 50-member ensemble cross the line representing the 16-member ensemble prediction), although individual M-EPS models are rarely as good as the 800-member ensemble. These findings are confirmed by Fig. 4, where the mean SSCRPSover all catchments is
plot-ted. The 16-member multi-model approach (several mod-els driven by deterministic forecasts) is again skilful up to about a lead time of 3 days, after which the inclusion of uncertainties arising from the prediction of rainfall becomes
D1 D2 D3 D4 D5 D6 D7 D8 D9 0 0.1 0.2 0.3 0.4 0.5 MAE [mm]
Lead time (day) a) D1 D2 D3 D4 D5 D6 D7 D8 D9 0 0.1 0.2 0.3 0.4 0.5 Mean CRPS [mm]
Lead time (day) b)
16−member ensemble 50−member ensemble 800−member ensemble
Catchment A7930610 Catchment A7930610
Fig. 3. Example of MAE and CRPS values for a given catchment (A793061: Moselle River at Hauconcourt; area = 9387 km2)and three types of ensemble predictions.
D1 D2 D3 D4 D5 D6 D7 D8 D9 0 0.2 0.4 0.6 0.8 1 Mean SS CRPS
Lead time (day)
16−member ensemble 50−member ensemble 800−member ensemble
Fig. 4. Mean SSCRPSas a function of lead time for the 29 studied catchments and three types of ensemble predictions.
beneficial. We note that this threshold of 3 days is coherent with the catchments’ mean characteristic response time scale of 3.2 days, linked to flow dynamics.
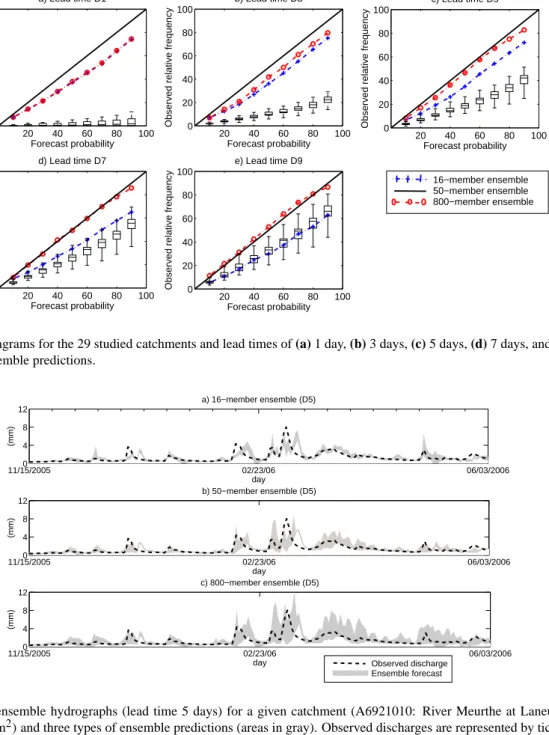
Reliability diagrams considering all 29 catchments are presented in Fig. 5 for five lead times. The reliability of the individual models driven by the M-EPS (box plots of the 50-member ensemble in Fig. 5) is very poor for short lead times (1 to 2 days) and slowly progresses with increas-ing lead time. Some of the individual models produce al-most reliable predictive distributions only for a 9-day lead time. The situation is better for the 16-member ensembles, driven by the deterministic forecasts, especially for shorter lead times. However, their reliability worsens gradually be-yond 5 days. Again, the 800-member ensembles show bet-ter skill, reaching reliability afbet-ter a lead time of 5 days. It can be said that the 800-member ensembles provide higher spread and “correct” to some extent the under-dispersion of the H-EPS with smaller number of members. In order to have a glimpse of the spread of the forecasts composing each ensemble prediction set, an example of the hydrographs ob-tained for each type of H-EPS tested is presented in Fig. 6 for the 5-day lead time. The range of discharge predictions
of the different ensembles is illustrated. The case presented (River Meurthe at Laneuveville-devant-Nancy with upstream area of 2780 km2)is representative of other catchments: the 800-member ensemble shows the largest dispersion.
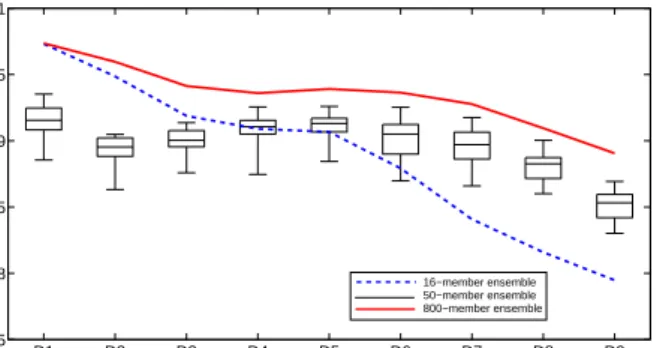
Finally, the ROC score is used to evaluate the resolution of the predictive distributions, i.e., their ability to discriminate between two alternative outcomes (events and no events) of large flood events. Figure 7 shows the mean ROC score of all 29 catchments calculated for threshold values corresponding to the quantile 90% of the observed streamflow time series. ROC scores for the 800-member ensemble are the highest for all forecast lead times, showing that this type of H-EPS bet-ter manages to discriminate between large events and non-events. The skill of the 16-member ensemble deteriorates more rapidly with increasing lead time, while the skill of the 50-member ensembles (box plots in the figure) is more invariant. Some models from the 50-member ensemble out-perform the 16-member ensemble in terms of skill beyond a lead time of 3 days, while basically all models show higher skill after 7 days of lead time.
4 Conclusions
Ensemble forecasting is becoming a common procedure for considering uncertainty in hydrological predictions. Of the many sources of uncertainty that may affect a hydrological prediction system, uncertainties from the rainfall forecasts and the structure of the hydrological model are usually pin-pointed as the most crucial ones. This has lead to two popular methods of implementing hydrological ensembles: pooling the outputs of a group of hydrological models for account-ing for the uncertainties related to the structure of the mod-els and driving a hydrological model with an ensemble of rainfall predictions to account for uncertainties related to the main meteorological forcing in the rainfall-runoff transfor-mation. This study used 16 lumped hydrological models and 9-day ECMWF ensemble rainfall forecasts to evaluate flow
20 40 60 80 100 0 20 40 60 80 100
Observed relative frequency
Forecast probability a) Lead time D1 20 40 60 80 100 0 20 40 60 80 100
Observed relative frequency
Forecast probability b) Lead time D3 20 40 60 80 100 0 20 40 60 80 100
Observed relative frequency
Forecast probability c) Lead time D5 20 40 60 80 100 0 20 40 60 80 100
Observed relative frequency
Forecast probability d) Lead time D7 20 40 60 80 100 0 20 40 60 80 100
Observed relative frequency
Forecast probability e) Lead time D9
16−member ensemble 50−member ensemble 800−member ensemble
Fig. 5. Reliability Diagrams for the 29 studied catchments and lead times of (a) 1 day, (b) 3 days, (c) 5 days, (d) 7 days, and (e) 9 days, and
for three types of ensemble predictions.
11/15/20050 02/23/06 06/03/2006 4 8 12 (mm) day c) 800−member ensemble (D5) 11/15/20050 02/23/06 06/03/2006 4 8 12 (mm) day b) 50−member ensemble (D5) 11/15/20050 02/23/06 06/03/2006 4 8 12 (mm) day a) 16−member ensemble (D5) Observed discharge Ensemble forecast
Fig. 6. Example of ensemble hydrographs (lead time 5 days) for a given catchment (A6921010: River Meurthe at
Laneuveville-devant-Nancy; area = 2780 km2)and three types of ensemble predictions (areas in gray). Observed discharges are represented by tick lines.
ensemble predictions over 29 French catchments and a pe-riod of 507 days. This lead to three types of hydrological en-sembles: a 16-member ensemble (driven by the deterministic prediction), a 50-member ensemble (driven by the M-EPS) and an 800-member ensemble that combines all hydrological models driven by the M-EPS. The two sources of uncertainty mentioned above (rainfall uncertainty and uncertainty from the structure of the hydrological model) were thus consid-ered, either individually or collectively.
Results indicated that in general the skill of the hydrolog-ical ensembles diminishes with increasing lead time, while the reliability increases with increasing lead time. If the former is expected from any standard hydro-meteorological forecasting system, the latter shows that the ensembles as-sembled here started becoming reliable only for long lead times, if ever. Part of this difficulty may be inherited from the meteorological ensembles, which are not reliable prior to about a 3-day lead time. More importantly, it is believed that not including uncertainties associated with the hydrological initial conditions at the onset of the forecasts takes also its
D1 D2 D3 D4 D5 D6 D7 D8 D9 0.75 0.8 0.85 0.9 0.95 1
Mean ROC score (Q 90%)
Lead time (day)
16−member ensemble 50−member ensemble 800−member ensemble
Fig. 7. Mean ROC score as a function of lead time for a flow
thresh-old given by the Q90% quantile for the 29 studied catchments and three types of ensemble predictions.
toll on reliability, at least for the first few time steps of the hydrological predictions.
As for the comparison per se between the three types of hydrological ensembles built here, the 800-member ensem-bles provide the most skilful solution for all lead times. Fur-thermore, it is the only system achieving reliability for some lead times (from 5 days ahead and on). There is thus a po-tential interest in combining sources of uncertainties. The 16-member ensembles show also comparable skill for the first lead times, but lose it more rapidly with increasing lead time than the 800-member ensembles. It appears that this approach is quite competitive up to about the mean charac-teristic response time scale of the studied catchments (3.2 days). It is also at around a lead time of 2 to 3 days that the 16-member ensembles are closest to achieving reliabil-ity. Even though the 16-member ensembles show some skill in the first lead times, these ensembles are the worse solu-tion for discriminating between large events (flows exceeding the 90% quantile) and non-events, especially for lead times longer than 6 days. Performance of the 50-member ensem-bles varies from a lumped model to the other. In the best cases (best models), their skill and reliability surpass the one of the 16-member ensembles, notably for longer lead times. From the analysis of the reliability diagrams and the visu-alisation of the ensemble hydrographs, it also appeared that under-dispersion is indeed a major issue of hydrological en-sembles built from EPS alone. The combination of M-EPS and hydrological models (i.e. the 800-member ensem-ble presented here) was the only reliaensem-ble ensemensem-ble obtained in this study. Even if the performance and reliability of the 800-member ensembles built here are quite satisfying, it may be too cumbersome and computer intensive to consider us-ing this procedure for an operational implementation. Work is underway to test techniques for member selection in or-der to consior-derably reduce the number of ensemble members for operational hydrological forecasting, while conserving or improving the reliability and performance of the ensemble predictions.
Acknowledgements. The authors acknowledge the fruitful
com-ments of two anonymous reviewers. The authors also acknowledge the Institut EDS, MITACS and CONACYT-M´exico for their
fi-nancial support and French MEEDM (Minist`ere de l’ ´Ecologie,
de l’Energie, du D´eveloppement durable et de la Mer) for the
hydrological data, M´et´eo-France for the weather data, and F. Pap-penberger and ECMWF for the rainfall forecasts.
Edited by: J. Thielen-del Pozo
Reviewed by: P. Burek and another anonymous referee
References
Bartholmes and Todini: Coupling meteorological and hydrological models for flood forecasting, Hydrol. Earth Syst. Sci., 9, 333– 346, doi:10.5194/hess-9-333-2005, 2005.
Bergstr¨om, S. and Forsman, A.: Development of a conceptual deter-ministic rainfall-runoff model, Nord. Hydrol., 4, 147-1-70, 1973. Berthet, L., Andr´eassian, V., Perrin, C., and Javelle, P.: How cru-cial is it to account for the antecedent moisture conditions in flood forecasting? Comparison of event-based and continuous approaches on 178 catchments, Hydrol. Earth Syst. Sci., 13, 819– 831, doi:10.5194/hess-13-819-2009, 2009.
Buizza, R., Miller, M., and Palmer, T. N.: Stochastic simulation of model uncertainties, Q. J. R. Meteorol. Soc., 125, 2887–2908, 1999.
Burnash, R. J. C., Ferral, R. L., and Mc Guire, R. A.: A generalized streamflow simulation system- Conceptual modeling for digital computers, U.S. Department of Commerce, National Weather Service and State of California, Department of Water Resources, 1973.
Chiew, F. H. S., Peel, M. C., and Western, A. W.: Application and testing of the simple rainfall-runoff model SIMHYD, in: Math-ematical Models of Small Watershed Hydrology and Applica-tions, edited by: Singh, V. P. and Frevret, D. K., Water Resources Publications, Highlands Ranch, 335–367, 2002.
Cormary, Y. and Guilbot, A.: ´Etude des relations pluie-d´ebit sur
trois bassins versants d’investigation, IAHS- AISH P., 108, 265– 279, 1973.
Cloke, H. L. and Pappenberger, F.: Ensemble flood forecasting: a review, J. Hydrol., 375, 613–626, 2009.
Davolio, S., Miglietta, M. M., Diomede, T., Marsigli, C., Morgillo, A., and Moscatello, A.: A meteo-hydrological prediction system based on a multi-model approach for precipitation forecasting, Nat. Hazards Earth Syst. Sci., 8, 143–159, doi:10.5194/nhess-8-143-2008, 2008.
Dietrich, J., Schumann, A. H., Redetzky, M., Walther, J., Den-hard, M., Wang, Y., Pf¨utzner, B., and B¨uttner, U.: Assessing uncertainties in flood forecasts for decision making: prototype of an operational flood management system integrating ensem-ble predictions, Nat. Hazards Earth Syst. Sci., 9, 1529–1540, doi:10.5194/nhess-9-1529-2009, 2009.
Edijatno, Nascimento, N. O., Yang, X., Makhlouf, Z., and Michel, C.: GR3J: a daily watershed model with three free parameters, Hydrolog. Sci. J., 44(2), 263–277, 1999.
Fortin, V. and Turcotte, R.: Le mod`ele hydrologique MOHYSE, Note de cours pour SCA7420, D´epartement des sciences de la terre et de l’atmosph`ere, Universit´e du Qu´ebec `a Montr´eal, 2006.
Garc¸on, R.: Mod`ele global Pluie-D´ebit pour la pr´evision et la pr´ed´etermination des crues, La Houille blanche, 7(8), 88–95, 1999.
Georgakakos, K. P., Seo, D.-J., Gupta, H., Schaake, J., and Butts, M. B.: Characterizing streamflow simulation uncertainty through multimodel ensembles, J. Hydrol., 298, 222–241, 2004. Girard, G., Morin G., and Charbonneau, R.: Mod`ele
pr´ecipitations-d´ebits `a discr´etisation spatiale, Cahiers ORSTOM S´erie Hydrolo-gie, IX 4, 35–52, 1972.
Gneiting, T. and Raftery, A. E.: Strictly proper scoring rules, pre-diction, and estimation, J. Am. Stat. Assoc., 102(477), 359–378, 2007.
He, Y., Wetterhall, F., Bao, H., Cloke, H., Li, Z., Pappenberger, F., Hu, Y., Manful, D., and Huang, Y.: Ensemble forecasting using TIGGE for the July-September 2008 floods in the Upper Huai catchment: a case study, Atmos. Sci. Lett., 11 (2), 132– 138, 2010.
Hopson, T. and Webster, P.: A 1–10 day ensemble forecasting scheme for the major river basins of Bangladesh: forecasting se-vere floods of 2003–07, J. of Hydrometeorol., 11(3), 618–641, 2010.
Jakeman, A. J., Littlewood, I. G., and Whitehead, P. G.: Computa-tion of the instantaneous unit hydrograph and identifiable com-ponent flows with applications to two small upland catchments, J. Hydrol., 117, 275–300, 1990.
Jaun, S. and Ahrens, B.: Evaluation of a probabilistic hydromete-orological forecast system, Hydrol. Earth Syst. Sci., 13, 1031– 1043, doi:10.5194/hess-13-1031-2009, 2009.
Jaun, S., Ahrens, B., Walser, A., Ewen, T., and Schr, C.: A probabilistic view on the August 2005 floods in the upper Rhine catchment, Nat. Hazards Earth Syst. Sci., 8, 281–291, doi:10.5194/nhess-8-281-2008, 2008.
Kalas, M., Ramos, M. H., Thielen, J., and Babiakova, G.: Eval-uation of the medium-range European flood forecasts for the March–April 2006 flood in the Morava River, J. Hydrol. Hy-dromech., 56(2), 116–132, 2008.
Krishnamurti, T. N.: Improved Weather and Seasonal Climate Forecasts from Multimodel Superensemble, Science, 285(1548), 1548–1550, 1999.
Mason, S. J.: A model for assessment of weather forecast, Aust. Met. Mag., 30, 291–303, 1982.
Matheson, J. E. and Winkler, R. L.: Scoring rules for continuous probability distributions, Manage Sci., 22, 1087–1096, 1976. Mathevet, T.: Quels mod`eles pluie-d´ebit globaux pour le pas de
temps horaire? D´eveloppement empirique et comparaison de mod`eles sur un large ´echantillon de bassins versants, Ph.D. the-sis, ENGREF (Paris), Cemagref (Antony), France, 463 pp., 2005. Michel, C., Perrin, C., and Andr´eassian, V.: The exponential store: a correct formulation for rainfall-runoff modeling, Hydrolog. Sci. J., 48(1), 109–124, 2003.
Moore, R. J. and Clarke, R. T.: A distribution function approach to rainfall-runoff modeling, Water Resour. Res., 17(5), 1367–1382, doi:10.1029/WR017i005p01367, 1981.
O’Connell, P. E. and Clarke R. T.: Adaptative hydrological forecast-ing: A review, Hydrolog. Sci. Bulletin, 26(2), 179–205, 1981. Olsson, J. and Lindstr¨om, G.: Evaluation and calibration of
oper-ational hydrological ensemble forecasts in Sweden, J. Hydrol., 350, 14–24, 2008.
Oudin, L., Hervieu, F., Michel, C., Perrin, C., Andr´eassian, V.,
An-ctil, F., and Loumagne, C.: Which potential evapotranspiration input for a rainfall-runoff model? Part 2 – Towards a simple and efficient PE model for rainfall-runoff modeling, J. Hydrol., 303(1–4), 290–306, 2005.
Pappenberger, F., Bartholmes, J., Thielen, J., Cloke, H., Buizza, R., and de Roo, A.: New dimensions in early flood warning across the globe using grand-ensemble weather predictions, Geophys. Res. Lett., 35, L10404, doi:10.1029/2008GL033837, 2008. Park, Y. Y., Buizza, R., and Leutbecher, M.: TIGGE:
prelimi-nary results on comparing and combining ensembles, ECMWF TM 548, European Centre for Medium-Range Weather Forecasts (ECWMF), Reading, UK, 2007.
Perrin, C., Michel, C., and Andr´eassian, V.: Does a large number of parameters enhance model performance? Comparative assess-ment of common catchassess-ment model structures on 429 catchassess-ments, J. Hydrol., 242(3–4), 275–301, 2001.
Perrin, C., Michel, C., and Andr´eassian, V.: Improvement of a parsi-monious model for streamflow simulation, J. Hydrol., 279, 275– 289, 2003.
Peterson, W. W., Birdsall, T. G., and Fox, W. C.: The theory of signal detectability, Trans. IRE Prof. Group. Inf. Theory, PGIT, 2–4, 171–212, 1954.
Quintana-Segu´ı, P., Le Moigne, P., Durand, Y., Martin, E., Habets, F., Baillon, M., Canellas, C., Franchisteguy, L., and Morel, S.: Analysis of near-surface atmospheric variables: Validation of the SAFRAN analysis over France, J. Appl. Meteorol. Climato., 47(1), 92–107, 2008.
Randrianasolo, A., Ramos M.H., Thirel G., Andr´eassian V., and Martin, E.: Comparing the scores of hydrological ensemble fore-casts issued by two different hydrological models, Atmos. Sci. Lett., 11(2), 100–107, 2010.
Ranzi R., Bacchi B., Ceppi A., Cislaghi M., Ehret U., Jaun S., Marx A., Hegg C., and Zappa M.: Real-time demonstration of hydrological ensemble forecasts in MAP D-PHASE, La-Houille-Blanche, 5, 95–103, 2009.
Refsgaard, J. C.: Validation and intercomparison of different up-dating procedures for real-time forecasting, Nord. Hydrol., 28, 65–84, 1997.
Renner, M., Werner, M. G. F., Rademacher, S., and Sprokkereef, E.: Verification of ensemble flow forecast for the River Rhine, J. Hydrol., 376, 463–475, 2009.
Roulin, E. and Vannitsem, S.: Skill of medium-range hydrological ensemble predictions, J. Hydrometeorol., 6, 729–744, 2005. Sauquet, E., Ramos, M.H., Chapel, L., and Bernardara, P.:
Stream-flow scaling properties: investigating characteristic scale from different statistical approaches, Hydrol. Processes, 22, 3462– 3475, 2008.
Schaake, J. C., Hamill, T. M., Buizza, R., and Clark, M.: HEPEX: The hydrological ensemble prediction experiment, B. Am. Me-teorol. Soc., 88(10), 1541–1547, 2007.
Shamseldin, A. Y., O’Connor, K. M., and Liang, G. C.: Methods for combining the outputs of different rainfall-runoff models, J. Hydrol., 197, 203–229, 1997.
Sugawara, M: Automatic calibration of the Tank Model, Hydrolog. Sci. J., 24(3), 375-388, 1979.
Thielen, J., Schaake J., Hartman R., and Buizza, R.: Aims, chal-lenges and progress of the Hydrological Ensemble Prediction Ex-periment (HEPEX) following the third HEPEX workshop held in Stresa 27 to 29 June 2007, Atmos. Sci. Lett., 9(2), 29–35, 2008.
Thielen, J., Bartholmes, J., Ramos, M.-H., and de Roo, A.: The European Flood Alert System Part 1: Concept and development, Hydrol. Earth Syst. Sci., 13, 125–140, doi:10.5194/hess-13-125-2009, 2009.
Thirel, G., Rousset-Regimbeau, F., Martin, E., and Habets, F.: On the impact of short-range meteorological forecasts for ensem-ble stream flow predictions, J. Hydrometeorol., 9(6), 1301–1317, 2008.
Warmerdam, P. M., Khole, J., and Chormansky, J.: Modelling rainfall-runoff process in the Hupsele Breek research Bassin, Ecohydrological process in small basins, in: Proceedings of the Strasbourg Conference (24–26 September 1996), Tech. Doc. Hy., 14, 155–160, 1997.
Wilks, D. S.: Statistical Methods in the Atmospheric Sciences, Aca-demic Press, 465 pp., 1995.
Yadav, M., Wagener, T., and Gupta, H.: Regionalization of con-straints on expected watershed response behavior for improved predictions in ungauged basins, Adv. Water Resour., 30(8), 1756–1774, 2007.
Younis, J., Ramos M. H., and Thielen J.: EFAS forecasts for the March-April 2006 flood in the Czech part of the Elbe River Basin – a case study, Atmos. Sci. Lett., 9(2), 88–94, 2008.
Zappa, M., Rotach, M. W., Arpagaus, M., Dorninger, M., Hegg, C., Montani, A., Ranzi, R., Ament, F., Germann, U., Grossi, G., Jaun, S., Rossa, A., Vogt, S., Walser, A., Wehrhan, J., and Wun-ram, C.: MAP D-PHASE: Real-time demonstration of hydrolog-ical ensemble prediction systems, Atmos. Sci. Lett., 2, 80–87, 2008.
Zappa, M., Beven, K.J., Bruen, M., Cofino, A., Kok, K., Martin, E., Nurmi, P., Orfila, B., Roulin, E., Schr¨oter, K., Seed, A., Stzurc, J., Vehvil¨ainen, B., Germann, U., and Rossa, A.: Propagation of uncertainty from observing systems and NWP into hydrological models: COST-731 Working Group 2, Atmos. Sci. Lett., 2, 83– 91, 2010.