HAL Id: hal-02317214
https://hal.archives-ouvertes.fr/hal-02317214
Submitted on 15 Oct 2019
HAL
is a multi-disciplinary open access
archive for the deposit and dissemination of
sci-entific research documents, whether they are
pub-lished or not. The documents may come from
teaching and research institutions in France or
abroad, or from public or private research centers.
L’archive ouverte pluridisciplinaire
HAL
, est
destinée au dépôt et à la diffusion de documents
scientifiques de niveau recherche, publiés ou non,
émanant des établissements d’enseignement et de
recherche français ou étrangers, des laboratoires
publics ou privés.
Elbow flexion and extension identification using surface
electromyography signals
A. Rubiano, J. Ramirez, M Korso, L. Gallimard, N. Jouandeau, O. Polit
To cite this version:
A. Rubiano, J. Ramirez, M Korso, L. Gallimard, N. Jouandeau, et al.. Elbow flexion and extension
identification using surface electromyography signals. 23th European Signal Processing Conference,
Aug 2015, Nice, France. �10.1109/EUSIPCO.2015.7362462�. �hal-02317214�
ELBOW FLEXION AND EXTENSION IDENTIFICATION USING SURFACE
ELECTROMYOGRAPHY SIGNALS
A. Rubiano
1,3, J. L. Ram´ırez
1,3, M. N. El Korso
1,3, L. Gallimard
1,3, N. Jouandeau
2,3, O. Polit
1,31
LEME, Universit´e Paris Ouest Nanterre La D´efense,
2LIASD, Universit´e Paris 8,
3
Universit´e Paris Lumi`ere,
50, rue de S`evres, 92410 Ville d’Avray, France.
ABSTRACT
In this paper, a new approach is presented for the analysis and the identification of the surface electromyography (EMG) signals of biceps and triceps muscles. The objective of this study is the accurate classification of elbow flexion and ex-tension movements. We propose a cropping method based on the agreement of the movement changes and the EMG signal using the upper limb kinematic. Then, we perform the extrac-tion and selecextrac-tion of several well known features in time and frequency domain. The selected features are used as inputs for our support vector machine classifier which is designed using an optimal weight vector criterion. Afterward, the train-ing and test steps are performed in the proposed scheme. Fi-nally, numerical simulation assess the accuracy of the classi-fication, as well as the robustness of the proposed approach considering noisy measurements.
Index Terms— Electromyography, feature extraction, upper limb kinematic, support vector machine, quaternions.
1. INTRODUCTION
The surface electromyography (EMG) signal contains rele-vant information about the electrical activity produced by the neuromuscular process during contraction or relaxation [1]. Due to the nature of the EMG, it is possible to extract some characteristics, which are useful to identify the produced movements, as function of the measured electrical activity. Nevertheless, the complexity of the measured EMG signals makes the detection and/or classification process a difficult task [2].
In the literature, different studies had been carried out, with the aim to identify movements from EMG signals. In [3], the authors focused on the identification of five hand move-ments in which the obtained accuracy range was 94% to 99%. In the same way, [4] proposed the detection of the wrist and ring finger movements, and achieved an accuracy of 87.3%.
This work has been supported by the Universit´e Paris Lumi`ere through the ProMain project. A. Rubiano acknowledges Universidad Militar Nueva Granada, where she is assistant professor.
More recently, in [5], the authors put forward the recognition of eight grasping gestures, and earned an accuracy between 96.9% and 99.65%.
Although these studies have reached good accuracies, none of them have considered the synchronization of the up-per limb kinematic with the EMG signal, in order to extract the signal fragment that match with each movement. One of the achievement of this communication, is the design of a real time synchronized process w.r.t. both kinematic and EMG signal, which guarantees the correct extraction of signals. Likewise, we consider variations in kinematical parameters, such as speed and angle range of the performed movements. These variations affect considerably the EMG signals, and so that, the classification accuracy. Even that, we achieve and maintain an accuracy of 99.79% using noisy measurements as input (i.e., measurements corrupted by an additive noise in order to asses the robustness of the proposed scheme) un-like the previous studies which used noise-free measurements (i.e., without adding an artificial additive noise).
Furthermore, we note that the obtained accuracy is ob-tained by testing the EMG signal from a new subject. This is of importance, since it means that the proposed scheme has both accurate accuracy and robustness to new subjects which could be not included in the learning process. Consequently, the proposed scheme earn generalization and applicability in real applications.
The main contributions of this paper are as follows: 1. The development of an open source software, which is able to: a) show in real time the synchronization of upper limb kinematic and EMG signals, b) fill automatically data gaps in kinematics using quaternion’s approach, c) extract EMG sig-nals in an accurate way through the calculation of angle and speed of movements, during the flexion and extension. 2. Design a methodology for analyzing and choosing the bests features to identify and classify movements, avoiding black boxes, which improve the control of the classification and generalization of the method.
3. Propose a nonlinear support vector machine (SVM) classi-fier which is feeded with an experimental data set, that
con-Fig. 1. Distribution of markers in the upper limb kinematic chain.
sider variations in kinematical parameters. Furthermore, we perform a proper exploration of the SVM settings, which give us an identification of the parameters influences in the learn-ing process. Finally, the robustness of the proposed scheme is test by artificially adding zero mean white gaussian noise.
2. EXPERIMENT AND MATERIALS
Three healthy subjects have participated in the proposed experiment. Each subject performed flexion and extension movements, changing the covered angle and speed of move-ment, while the upper limb motion tracking (ULMT) and EMG signals for biceps and triceps are recorded. Subject one, two, and three, performed one, four, and six trials re-spectively, thus making a total of44recorded EMG signals.
The EMG signals have been recorded using the ZE-ROWIRE wireless EMG system with a sampling frequency of1 kHz. All subjects were equipped with two EMG sen-sors, which were located over the biceps branchis and triceps. We selected these muscles, because they are the main mus-cles involved in the elbow flexion and extension [6], and consequently, they produce high electrical activity during the movements.
The ULMT, is performed using 7 3D VICON cameras and Nexus software. The system has a sampling frequency of 200Hz. The subjects were equipped with30retro-reflective markers, positioned all over the upper limb kinematic chain including the spinal column, see Fig. 1, distributed as fol-lows: i) Occipital bone (markers 1 to 3). ii) Cervical and lumbar vertebra (markers 4 to 13). iii) Sacrum (markers 13 to 15). iv) Scapula (markers 16 and 17) v) Medial epicondyle of humerus (marker 18). vi) Coronoid process of ulna and radius (markers 19 and 20). vii) Styloid process of ulna and radius (markers 21 and 22). viii) Metacarpophalangeal joint of fingers 1, 2, 3 and 5 (markers 23 to 26). ix) Proximal inter-phalangeal joint of the fingers 2, 3 and 5 (markers 27 to 29). x) Interphalangeal joints of finger 1 (marker 30).
3. PRE-PROCESSING OF DATA
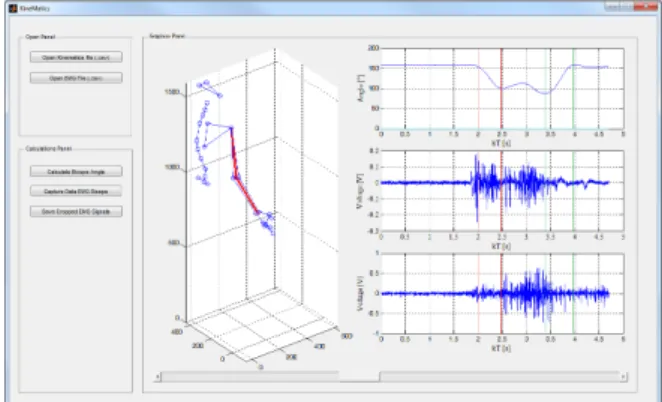
The pre-processing of data consist in the visualization and extraction of the EMG signals, that corresponds to the flexion and extension movement. For this issue, we develop a open
Fig. 2. Software’s interface.
source software1 (developed in Matlab, see Fig. 2) which: i) Displays ULMT data, ii) displays the corresponding EMG signals, iii) calculates the elbow angle and the correspond-ing angular velocity, iv) synchronizes in real time the EMG signals and the ULMT data, with the aim of extracting sig-nals for flexion and extension movements from the raw EMG data taking into account the diffident sampling frequencies. For the purpose of plotting the ULMT data, the markers are clustered by regions as follows: i) Head markers 1 to 3, ii) spinal column markers 4 to 13, iii) sacrum markers 13 to 15, iv) scapula markers 16 to 18, v) arm markers 18 to 20, vi) forearm markers 19 to 22 and vii) hand markers 21 to 30. These regions are used to draw lines between markers to al-low an easy interpretation of the 3D visualization, linking the scattered points in the graph (this explains that some markers are repeated in different clusters).
3.1. Automatic correction of missing data and outliers
Frequently, some markers of the ULMT disappear within several periods of times. Vicon Nexus Software try to fill the gaps of these missing markers. Nevertheless, sometimes, it appears that the software fails to fill it and let empty the values of the missing markers (which are set to 0 in Matlab, see Fig. 3). Nevertheless, each zero has a dramatic effect on the accuracy of the following classification steps.
Consequently, to over come this disadvantage, we develop a mathematic model, which is able to determine the values of the markers which disappear. The model use quaternions, since they are used to formulate spatial rotation in many fields, including computer graphics and robotics [7]. Due to space limitation, we briefly describe the model, more details are included in the open source package software.
Our proposed model consists of a coordinate system fixed to each marker, and a set of vectors which links the markers between them, maintaining the order of the markers cluster (e.g. marker 1 is linked to marker 2 by a vector, and marker
1The open source software will be available soon at http://leme.u-paris10.fr/promain-565200.kjsp?RH=1415865400449
Fig. 3. Examples of missing ULMT Markers.
2 is linked to marker 3 by another vector, and so on). Then, we define a group of quaternions, which express the rotations between the created vectors, in order to verify the position of each marker. When the position of a marker exceed a cer-tain threshold (in our case3mm) w.r.t. the calculated position with the quaternions, the marker is replaced by the calculated point, so that, the 3D model is automatically corrected.
3.2. Elbow angle evaluation and analysis
Once the 3D model is corrected, we can determine correctly the elbow angleϕ. For this, we use two vectors: one from the elbow to the wrist and the other from the elbow to the shoul-der. Since there are two markers in the elbow, it is required to find the position of the middle pointp1between the
coro-noid process ulna and radius (markers 19 and 20), and also the pointp2in the wrist, between the markers placed over the
styloid process of ulna and radius (markers 21 to 22). The arm vector denoted byva ∈R3is the vector that links
the pointp3(marker placed over the epicondyle of humerus), to the pointp1. The forearm vector denoted by vf a ∈ R3
links points p1 andp2. With these two vectors, the elbow angle ϕ is calculated as ϕ = arccos hva,vf ai
kvakkvf ak
. Since the EMG signal and the UMLT are synchronized, our soft-ware calculate the angular velocity, defined as ω = dϕ/dt,
to identify if the angle ϕis increasing or decreasing. The behavior ofϕallows the exact identification of elbow flex-ion and extensflex-ion movements, which is important for the cor-rect and accurate extraction of EMG signals. As result of the pre-processing, we obtain a set of EMG signals which corre-sponds to electromyography of biceps and triceps for flexion and extension at different angles and speeds (see Table. 1) for all subjects and all trials.
4. FEATURE EXTRACTION
Feature extraction is a technique to obtain relevant informa-tion of a signal, in time or frequency domain, which is given
Subj. Trial Range Angle [
◦
] Speeds [rad/s]
Flex Ext Flex Ext
1 1 057,92 -071,29 1,80 -2,04 2 1 097,37 -102,28 1,24 -1,30 2 108,69 -117,79 1,93 -1,76 3 117,27 -117,87 8,15 -6,22 4 117,27 -117,87 1,49 -1,32 3 1 048,54 -038,74 2,72 -1,77 2 043,18 -039,88 1,71 -1,22 3 036,80 -041,40 2,56 -2,18 4 046,60 -044,44 2,62 -1,52 5 046,76 -046,56 2,54 -1,84 6 045,63 -043,73 2,41 -1,49
Table 1. Angles and speeds of movements.
by a single vector value [3]. There are several features often used for analyzing EMG signals. Specifically, we consider the following features:
• Entropy : Ent(s) =−P io
2
ilog2(o2i)whereoirepresents
the projection coefficients of the signalsin an orthonor-mal basis [8].
• Mean Absolute Value : MAV(s) = n−1Pn i=1|[s]i|,
where[s]i represents thei-th sample of the signals, and
nis the number of samples.
• Mean value: M(s) =n−1Pni=1[s]i.
• Harmonic mean: HM(s) =n(Pni=1[s]−i1)−1.
• Mean frequency: MF(s) = (PNj=1Ij)−1PNj=1Ijfj
whereN denotes the number of harmonics in the spec-trum, Ij represents the magnitude of thej-th harmonic,
andfjis the frequency of thej-th harmonic.
As previously mentioned, the aim of this study is to iden-tify two movements (elbow flexion and extension) from EMG signals. Therefore, the proposed approach is to extract the aforementioned features of electromyography signals, to cre-ate two sets of features, one for flexion, and one for extension. These sets are used to characterize the difference between the features which is evaluated using an Euclidean distance. It is important to note that the generated sets of features are af-fected by the variations in kinematical parameters, such as speed and angle range of the performed movements.
In order to chose the best set of feature for our classifi-cation scheme, the maximum distance between the nearest values of each couple of feature is calculated. For this, we propose the following criterion which is applied to all trials in the two muscles (biceps and triceps):
(b, u) = arg max b,u min |zext b −z fle b |+|z ext u −zfleu| for
b 6= uin which zextb andz
fle
b are theb-th features for
ex-tension and flexion,zextu andzextu are theu-th features for
extension and flexion. Based on the the proposed criterion, the selected features are found to be the entropy and the mean frequency features. Therefore, with these selected features, we build a matrix X, in which each row is the value of
row
Flexion
row
Extension Biceps Triceps Biceps Triceps
Ent MF Ent MF Ent MF Ent MF
1 3,3 269,4 3,4 270,2 12 3,7 267,1 2,3 262,6 2 3,4 270,3 2,0 259,0 13 2,0 259,3 2,2 261,9 3 3,5 271,0 2,0 259,7 14 2,0 259,3 2,2 262,0 4 3,2 272,6 2,5 262,7 15 2,5 262,6 2,5 263,8 5 3,5 269,8 2,1 258,0 16 1,8 257,6 2,4 264,6 6 4,4 280,6 2,8 266,7 17 2,6 263,4 2,9 269,8 7 3,0 269,8 2,2 262,1 18 2,3 265,6 2,1 267,1 8 3,2 272,6 2,5 262,7 19 2,5 262,6 2,5 263,8 9 3,4 269,5 2,1 260,0 20 2,3 263,8 1,7 260,7 10 4,3 273,7 2,7 264,4 21 2,6 263,7 3,0 271,2 11 3,3 269,1 2,3 262,6 22 2,1 261,5 2,2 265,9
Table 2. The feature matrixX in which rows one and twelve are trial extracted from subject one, rows two to five and rows thirteen to sixteen are trials extracted from subject two, and the other rows are trials extracted from subject three.
[Ent(sbi),MF(sbi),Ent(str),MF(str)]for one trial, where
sbi andstr are the biceps and triceps recorded EMG signals
respectively (note that the extracted features are influenced by variations in kinematical parameters). Table 2 shows the extracted values of the selected features stored in the matrix
Xfor different subject and different trials.
5. CLASSIFICATION SCHEME
The matrixX, can be considered as a set of points in a4-th dimensional features space, wherein eachl-th pointxl∈R4,
has an etiquetteyl ∈ {1,−1}. The etiquette classifies the
points into two categories: flexion or extension. The points of the matrixXcan be separated, using a learning strategy based on statistical theory, called support vector machine (SVM). The SVM calculate an optimal hyperplane between such cat-egories, using a matrixX0composed byqrows, where each rowx0q is a support vector. In our case, the support vectors
are the rows three, four, six, fourteen, fifteen and seventeen of the matrixX, i.e. three vectors for flexion and three for extention.
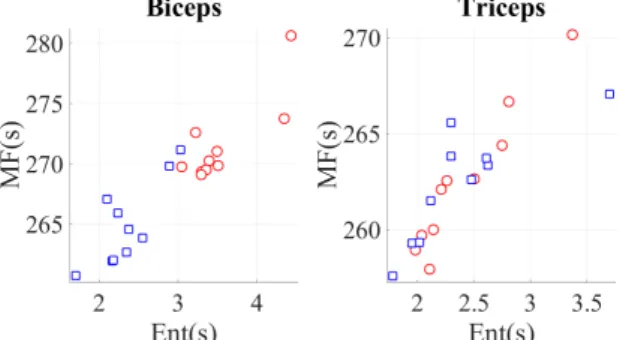
In our study, a linear separation is not possible, as can be seen from Fig. 4. Consequently, we propose to use a non-linear SVM classifier, where the optimal hyper-plane is obtained by solving a quadratic programming prob-lem (QPP) [9], given by minw,b,ξ12wTw + C
Pm q=1[ξ]q
s.t. yq wTφ(x0q) +b
≥ 1 − [ξ]q and [ξ]q ≥ 0 for
q = 1, . . . , m wherew and b determine the hyperplane in feature space, [ξ]q represents the error soft margin, C is a
term to control the overfitting,mdenotes the amount of sup-port vectors insideX0, andφmapsx0qinto high-dimensional
space. The solution of this problem, is the following decision function: Γ(xl) = sign Pm q=1αqyqK(x 0 q,xl) +b in which αq
are the lagrange coefficients used to solve the QPP prob-lem [8], andK(x0q,xl)denotes a kernel function, that is, in
Fig. 4. Distribution of features for flexion and extension. Red circles and blue squares represent, respectively, flexion and extension features.
our case, given by the following radial basis function (RBF):
K(x0q,xl) = exp−
||x0q−xl||2
2σ2 where σ denotes a positive
parameter for controlling the radius. This RBF function is se-lected due to its capacity of maximizing the distance between the hyperplane and the points [10].
Since we use six support vectors, the decision functionΓ(xl)
is applied to the remaining pointsxlof the matrixX. Then,
the result ofΓ(xl), is compared withyl. If the values match,
it is considered that the SVM has correctly classified the point
xl. As result, using a non optimal setting ofσandC, the
al-gorithm may achieve a classification percentage of 90.91%. This result shows that only two movements of all the trials (flexion of second subject with trial three, and flexion of the third subject with trial three) are not correctly classified. It is important to remark that the SVM is trained only with 13.63% of the whole trials (considering trials of subject two and three), but the algorithm is able to classify correctly the EMG signals produced during flexion and extension of the first subject whose patterns are new for the classifier and was not used in the training step.
In order to improve this result, we analyse the effect of the parameters σ and C in order to identify their influence in the final percentage of classification. This numerical analy-sis conanaly-sists of a double iteration changing the values of the enounced parameters. As result, we find that there is an opti-mal area for values ofσnear to1.1andCclose to2.5, where the percentage of classification reaches 100% as is shown in Fig. 5. It is important to note that the 100% of successful classification is due to the fixed (finite) number of testing data. To test the method in a more realistic environment, the EMG signal may be corrupted by some noisy data. Such scenario is discussed in the following section.
6. CLASSIFICATION ROBUSTNESS IN THE PRESENCE OF NOISY MEASUREMENTS
Even if we obtained an accurate result of EMG signals iden-tification with the nonlinear SVM classifier, it is necessary to consider that there are several conditions that could influence
Fig. 5. Percentage of classification as function ofσandC.
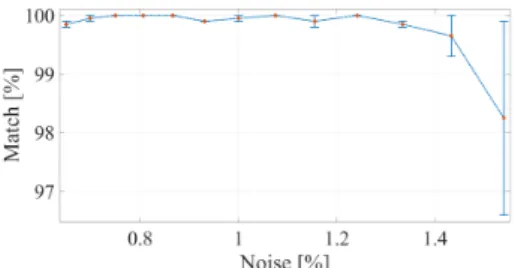
Fig. 6. Classification results after adding noise for the first subject and trial one.
the results (e.g. the sweat and fatigue of the subject and dis-placement of the recording electrodes). The effect of some non idealistic conditions can be modeled as an additive white Gaussian noise (AWGN) [1]. In our simulations, we added AWGN to the biceps and triceps EMG signal measurements of: (a) the first subject for trial1, (b) the second subject for trial1, (c) the third subject for trial5. Note that the contam-inated trials are only used to test robustness and thus, they ware not in the training setX0 of SVM. The noise is gener-ated for several values of signal to noise ratio (SNR), using 1000 Monte Carlo trials for each value of SNR. The corre-sponding percentages of the additive power of noise, over the power of EMG signal, lies between 0.64% and 1.43%. Sub-sequently of adding noise to these signals, the same process described in section 4 is applied in order to obtain features of the noisy signals. The SVM achieves a successful classifi-cation of99.79%. The results of percentage of classification with respect to the percentage of noise added to the signal, for the subject one, is presented in Fig. 6 (for the other subjects the same behavior is noticed but due to space limitation it is not presented here).
7. CONCLUSION
In this paper, a new elbow flexion and extension identifica-tion scheme is proposed. Quaternion based method was used to correct the ULMT data analysis, which allow us to calcu-late the position of missing kinematic markers. Accordingly, with the ULMT, we calculated, in an accurate way, the angles and speeds of the movement. These values are important, in order to select the exact time window, that matches with each movement, avoiding to extract features with wrong informa-tion. Furthermore, we designed a novel criterion to select the
best couple of feature for the classification. Then, we set up a non linear SVM classifier which has as input the selected fea-tures. Finally, numerical simulation showed that the proposed scheme performs almost perfectly (99,79%) with a moderate contaminated measurement.
REFERENCES
[1] M. B. I. Reaz, M. S. Hussain, and F. Mohd-Yasin, “Techniques of EMG signal analysis: detection, pro-cessing, classification and applications,” Biological Procedures Online, vol. 8, no. 1, pp. 11–35, Dec. 2006. [2] A. Alkan and M. Gnay, “Identification of EMG signals using discriminant analysis and SVM classifier,”Expert Systems with Applications, vol. 39, no. 1, pp. 44–47, Jan. 2012.
[3] M.A. Oskoei and H. Huosheng, “Support vector machine-based classification scheme for myoelectric control applied to upper limb,” IEEE Transactions on Biomedical Engineering, vol. 55, no. 8, pp. 1956–1965, Aug. 2008.
[4] G. R. Naik, D.K. Kumar, and Jayadeva, “Twin SVM for gesture classification using the surface electromyo-gram,” IEEE Transactions on Information Technology in Biomedicine, vol. 14, no. 2, pp. 301–308, Mar. 2010. [5] N. Wang, Y. Chen, and X. Zhang, “The recognition of multi-finger prehensile postures using LDA,” Biomed-ical Signal Processing and Control, vol. 8, no. 6, pp. 706–712, Nov. 2013.
[6] A. Ali, K. Sundaraj, R. B. Ahmad, N. U. Ahamed, and A. Islam, “Surface electromyography for assessing tri-ceps brachii muscle activities: A literature review,” Bio-cybernetics and Biomedical Engineering, vol. 33, no. 4, pp. 187 – 195, 2013.
[7] P. Bell and I. Potapov, “Reachability problems in quaternion matrix and rotation semigroups,” Informa-tion and ComputaInforma-tion, vol. 206, no. 11, pp. 1353 – 1361, 2008.
[8] Q. Liu, X. Zhao, and Z. Hou, “Metric learning for event-related potential component classification in EEG signals,” inProceedings of the 22nd European Signal Processing Conference (EUSIPCO), Lisbon, Portugal, Sept. 2014, pp. 2005–2009, .
[9] F. F. Chamasemani and Y. P. Singh, “Multi-class sup-port vector machine (SVM) classifiers - an application in hypothyroid detection and classification,” in Sixth conference on Bio-Inspired Computing: Theroies and applications, IEEE, Penang, Malaysia, Sept. 2011, pp. 351–356, .
[10] X. Peng, “TPMSVM: A novel twin parametric-margin support vector machine for pattern recognition,” Pat-tern Recognition, vol. 44, no. 10-11, pp. 2678–2692, Oct. 2011.