Pharmacosurveillance without borders: electronic health records in
different countries can be used to address important methodological
issues in estimating the risk of adverse events
Robyn Tamblyn
a,b,c,*
, Nadyne Girard
c, William G. Dixon
d, Jennifer Haas
e,
David W. Bates
e, Th
er
ese Sheppard
d, Tewodros Eguale
a, David Buckeridge
a,
Michal Abrahamowicz
a, Alan Forster
faDepartment of Epidemiology, Biostatistics and Occupational Health, Purvis Hall, McGill University, 1020 Pine Avenue West, Montreal, Quebec H3A 1A2,
Canada
b
Department of Medicine, McGill University Health Center, 1001 Decarie Boulevard, Montreal, Quebec H4A 3J1, Canada
c
Clinical and Health Informatics Research Group, McGill University, 1140 Pine Avenue, Montreal, Quebec H3A 1A3, Canada
d
Arthritis Research UK Centre for Epidemiology, Centre for Musculoskeletal Research, Institute of Inflammation and Repair, Manchester Academic Health Science Centre, The University of Manchester, 2nd Floor, Stopford Building, Oxford Road, Manchester M13 9PT, UK
e
Brigham and Women’s Hospital, 75 Francis Street, Boston, MA 02115, USA
f
The Ottawa Hospital, 501 Smyth Road, Ottawa, Ontario K1H 8L6, Canada Accepted 11 March 2016; Published online 20 May 2016
Abstract
Objectives: Evaluate methodological advantages and limitations of an international pharmacosurveillance system based on electronic health records (EHRs).
Study Design and Settings: Type 2 diabetes was used as an exemplar. Cohorts of newly treated diabetics were followed in each country (Quebec, Canada; Massachusetts, United States; Manchester, UK) from 2009 to 2012 using local EHR systems. Cox proportional hazards models were used to assess the risk of cardiovascular events.
Results: A total of 44,913 newly treated diabetics were identified; 82.6% (United States) to 93.1% (Canada) were started on biguanides; 13% of patients failed to fill initial prescriptions. An increased risk of cardiovascular events with sulfonylureas was observed when dispensing [hazard ratio (HR): 2.83] vs. EHR prescribing (HR: 2.47) data were used. The addition of clinical data produced a threefold to 10-fold increase in comorbidity for obesity and renal disease, but had no impact on the risk of different hypoglycemic therapies. The risk of cardiovascular events with sulfonylureas was higher in the United States [HR: 3.4; 95% confidence interval (CI): 2.1, 5.5] compared to England (HR: 1.3; 95% CI: 1.1, 1.6).
Conclusion: An international surveillance system based on EHRs may provide more timely information about drug safety and new opportunities to estimate potential sources of bias and health system effects on drug-related outcomes. Ó2016 The Author(s). Published by Elsevier Inc. This is an open access article under the CC BY-NC-ND license (http://creativecommons.org/licenses/by-nc-nd/4.0/).
Keywords: Pharmacosurveillance; Medication adherence; Electronic health record; Adverse outcome; Risk assessment; Health informatics; Pharmacoepidemiology
1. Introduction
Although an estimated $1.3 trillion will be spent world-wide on drugs each year [1], there is limited capacity to assess the comparative risks and effectiveness of medica-tions after they enter the market [2e6]. In addition, even when safety problems are identified, there is no timely or effective method of reliably communicating this informa-tion to physicians to inform prescribing decisions[7e9].
However, there are new opportunities to address both of these problems. In the last 2 decades, the use of electronic health records (EHRs) has increased steadily. In particular,
Conflict of interest: There are no conflicts of interest.
Funding: This project was funded by the Canadian Institutes of Health Research (CIHR) operating grant # 201009MOP. T.E. was supported by a CIHR postdoctoral fellowship. W.G.D. was supported by a Medical Research Council (MRC) Clinician Scientist Fellowship (G0902272).
* Corresponding author. McGill University, Morrice House, 1140 Pine Ave West, Montreal, Quebec, Canada, H3A 1A3. Tel.: (514)-934-1934x32999; fax: (514)-843-1551.
E-mail address:[email protected](R. Tamblyn).
http://dx.doi.org/10.1016/j.jclinepi.2016.03.033
0895-4356/Ó2016 The Author(s). Published by Elsevier Inc. This is an open access article under the CC BY-NC-ND license (http://creativecommons.org/ licenses/by-nc-nd/4.0/).
What is new?
Key findings
There is an increased risk of cardiovascular events with sulfonylureas compared to biguanides, in the United States compared to England.
The prevalence of comorbiditiesdobesity, lipid disorders, and renal diseasedmore than doubles when clinical information is included in measurement.
What this adds to what was known?
Thirteen percent of patients newly started on oral hypoglycemic therapy will not fill the initial pre-scription; drug cost and copayment are health sys-tem effects that may influence adherence.
What is the implication and what should change now?
Efforts to implement EHR standards nationally and internationally should focus on semantic interopera-bility for data required for international pharmacosur-veillance: classification of prescription drugs, adverse events, and therapeutic outcomes (e.g., HbgA1c).
Evidence suggests that gliclazide may have a supe-rior safety profile for the second-line management of type 2 diabetes compared to other drugs, and further research in this area with future real-world trials would be beneficial.
many countries see computerizing drug management as a priority because errors in medication use can be potentially reduced by computerizing prescribing, dispensing, adminis-tration, and information sharing[10e21]. One of the bene-fits of the rise in EHR adoption is that it has catalyzed global efforts to establish international clinical data classi-fication and communication standards, and vendors of health information technologies are encouraged to meet these requirements [22e25]. This concerted international investment creates an unprecedented opportunity to replace antiquated systems of postmarket surveillance and risk communication, with real-time monitoring and communi-cation of the population experience with a particular drug across multiple jurisdictions [21,26,27]. An international surveillance system has great potential to provide timely measurement of treatment effectiveness and detection of adverse effects as tens of millions of new users could be monitored, not only to assess the overall effects in the pop-ulation, but to have the power and sufficient population het-erogeneity to detect differences in safety and effectiveness in genetic, ethnic, and clinically defined subpopulations
[6,28,29]. This surveillance capacity is important because the effects of treatment may vary by sex, race, and ethnicity [30e35]likely because of subpopulation differences in the prevalence of genetic polymorphisms that influence the metabolism of medication and its efficacy and toxicity [36,37]. Moreover, countries will vary in the introduction and uses of new drugs, creating natural experiments to eval-uate treatment effectiveness within therapeutic classes.
To effectively use these rich, multinational real-time data resources we need to expand our knowledge on how to use these data in epidemiologic contexts. Specifically, for pharmacosurveillance, we need to evaluate potential methodological advantages and limitations of using EHRs for pharmacosurveillance, as well as the potential benefits of assessing drug safety and effectiveness in different pop-ulations and health systems.
In this study, we addressed two methodological issues that are pertinent to the use of EHRs in comparison to administrative data. First, we assessed the potential disad-vantage of using prescriptions to measure drug exposure rather than administrative records of dispensed medication, misclassification that may bias estimates of safety and effectiveness because of nonadherence to prescribed ther-apy. The availability of linked electronic prescription and dispensing data in one country enabled us to estimate the incidence of primary nonadherence, the characteristics of patients who failed to fill the initial prescription, and the consequences of using prescribed vs. dispensed data on the risk of adverse events. Second, one of the advantages of EHRs is that they provide rich clinical data that can be used to measure comorbidity such as laboratory and phys-iologic measures. We used more detailed clinical data avail-able in EHRs in three countries to estimate the extent of misclassification of comorbidity and the impact of more ac-curate measurement on the risk of adverse events.
We used type 2 diabetes and the risk of cardiovascular events in relationship to oral hypoglycemics to assess these methodological issues, as the risk associated with older prod-ucts such as the sulfonylureas has been well characterized [38e46]and could serve as a means of validating the results. New hypoglycemics are also differentially entering these markets providing an opportunity to use international sur-veillance as a powerful means of assessing risk and benefit.
2. Methods
2.1. Design and population
Three prospective cohorts of persons who were new users of oral hypoglycemics between 2009 and 2012 were assembled in Canada, England, and the United States from local EHR systems. To be included in the cohort, individ-uals had to be 18 years or older and be newly started on oral hypoglycemic therapy, defined as having no prescription for an oral hypoglycemic or insulin in the past 2 years.
Patients were excluded if they had a diagnosis of gesta-tional diabetes or polycystic ovarian syndrome, as these conditions are also indications for biguanides. The occur-rence of cardiovascular events [stroke and myocardial infarction (MI)] was assessed before the start of treatment as well as during follow-up, starting with the date of the first oral hypoglycemic prescription to a maximum of 30 months.
2.2. Data sources
2.2.1. Quebec, Canada cohort
Data were extracted from the Medical Office of the 21st Century (MOXXI) EHR that includes a real-time linkage to the Quebec insurance agency, the Regie de l’assurance mal-adie du Quebec databases, providing historical, and daily updates of patients’ medical services received (diagnosis, procedure, date, location, provider), prescriptions dispensed from community pharmacies for persons who are publically insured (prescriber, pharmacy, drug, dose, dispensing date, duration, refills), and mortality. Approximately 110 primary care physicians in Quebec use MOXXI for approximately 90,000 of their patients.
2.2.2. Boston, US cohort
Data were extracted from the Partners HealthCare Research Patient Data Registry (RPDR). RPDR includes data from the longitudinal medical record (LMR), an inter-nally developed, web-based, fully functional EHR that was in use during this period for the participating clinics from Brigham and Women’s Hospital (BWH) and Massachusetts General Hospital (MGH), the two founding members of Partners Healthcare in Boston, Massachusetts. Data were retrieved from the structured clinical encounter information from RPDR. To ensure complete follow-up, patients were eligible if they were seen in 1 of 37 BWH- or MGH-affiliated primary care or diabetes clinics.
2.2.3. England cohort
Data were extracted from the CPRD (Clinical Practice Research Datalink). CPRD is an anonymized LMRs data-base for primary care. The primary care EHR includes in-formation on all primary care interactions including documented health problems, visit notes, prescriptions,
and records of specialty referrals, as well as information on laboratory results, hospitalizations, and death. The CPRD includes more than 5 million active patients and around 600 primary care practices. Patients were included if their records met minimum quality standards and there were no gaps in registration.
2.3. Drug exposure
2.3.1. International data mapping
Approved oral hypoglycemics in the following thera-peutic classes were identified in each country from the federal regulatory agency: thiazolidinediones, sulfonyl-ureas, biguanides, alpha glucosidase inhibitors, and DPP-IV inhibitors. Drugs from each country were mapped to the World Health Organization (WHO) Anatomical Ther-apeutic Chemical classification system [47], and WHO-defined daily doses were used to calculate the percent of the maximum adult dose that each patient was prescribed. Insulin was also included in the identification and mapping exercise to allow for control of confounding by concurrent use.
2.3.2. Oral hypoglycemic exposure measurement
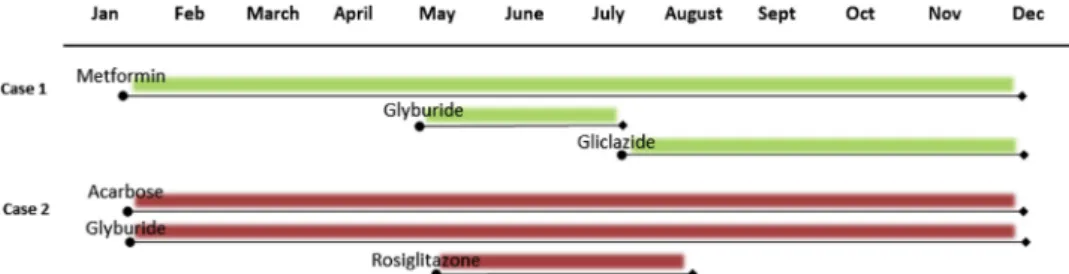
Electronic prescription records were the common data available in all three countries to measure drug exposure. In Canada, records of dispensed medications were also available, allowing an assessment of the accuracy of using prescription data vs. dispensed data to measure drug expo-sure and the impact of primary medication nonadherence on the risk of adverse events. The prescribing date, drug, duration, and number of refills recorded in each electronic prescription were used to create a drug by day matrix (Fig. 1). Each individual’s exposure to oral hypoglyce-mic(s) was characterized using time-dependent measures of drug use for each day from the date of the first prescrip-tion to the end of follow-up or the date of the first cardio-vascular event, whichever came first. For each hypoglycemic, each user was classified on each day using a dichotomous indicator of an active prescription. A pre-scription was considered ‘‘active’’ if a supply of medica-tion should exist on that day according to the prescription date and duration (including refills). Individ-uals prescribed more than one drug concurrently
contributed to the comparative risk and effectiveness for each drug, respectively.
Using prescription data will result in classification errors in drug exposure if patients do not fill their prescriptions. Quebec had data on electronic prescriptions linked to data on dispensing. We were able to use these linked data to determine if there were differences in the drug-outcome relationship when drug exposure was assessed using dispensing data as opposed to prescription data for the same patients. We were also able to estimate the extent of misclassification and the characteristics of the population involved by determining the incidence and factors associ-ated with primary nonadherence in filling the first prescrip-tion for diabetes treatment.
2.4. Adverse cardiovascular outcomes
Cardiovascular events were defined as the first date on which an acute MI, acute coronary syndrome, or stroke were diagnosed in the 30 months of follow-up. For each country, we measured outcomes by retrieving electronic medical record diagnostic codes and dates, physician billing (United States and Canada), and hospitalization re-cords. International Classification of Diseases (ICD) 9 and ICD 10 codes were used in Canada and the United States. In England, patients in the CPRD are linked to a national registry of hospital admissions, Hospital Episode Statis-tics (HES), where admission and discharge dates and di-agnoses are recorded using ICD 10, whereas Read codes are used to record diagnostic data in the CPRD (see Online Appendix at www.jclinepi.com for Harmonized Codes).
2.5. Confounding by demographic and comorbidity characteristics
The choice of an oral hypoglycemic may be influenced by a patient’s overall risk, including comorbid conditions, disease severity and complications, age and sex, as well as the capacity to pay for medication. All these factors may also influence treatment outcome. To create compara-ble patient populations, we measured these patient charac-teristics and adjusted for them in the analysis. While less efficient than high dimension propensity score stratification [48,49], comorbidity-specific measurement and adjustment will produce more transparent information about the comparability of effects for specific patient characteristics in different countries or settings and enable evaluation of effect modification by patient characteristics. Although oral hypoglycemics are almost exclusively prescribed for type 2 diabetes (i.e., single indication therapy), we assessed whether the presence or absence of a diagnostic code for diabetes before or at the start of therapy influenced the results.
2.6. Demographic characteristics 2.6.1. Age and sex
Date of birth and sex were retrieved from the EHR de-mographic information in the US and England cohorts and from the administrative data in Quebec, as these data are verified at the time of enrollment in the health plan.
2.6.2. Socioeconomic status
Financial resource capacity (household income, employ-ment status, home ownership) and education [number of years of education, highest level of achievement (no formal education, primary school, high school, university)] were measured by mapping, when available, the patient’s current postal code (Canada) or zip code (United States) to small area aggregated census information for persons living in the same location. These area-level data have been shown to provide a good proxy measure of individual socioeco-nomic status [50]. These data were not available for England.
2.7. Prior cardiovascular events
Prior events are one of the most important predictors of future events, irrespective of treatment[51,52]. Therefore, cardiovascular events in the year before starting oral hypo-glycemic therapy were assessed using the same approach as outlined for outcome assessment.
2.8. Diabetes control
Insulin use during the follow-up period was measured as a marker of diabetes control. Any insulin products and an-alogues were included. A dichotomous indicator was used to create a time-dependent measure of whether an individ-ual was exposed to insulin during the follow-up period based on the start and completion dates for respective insu-lin prescriptions.
2.9. Code-based and clinically enhanced measures of comorbidity
Comorbid conditions that could influence the risk of a cardiovascular event as well as drug selection and meta-bolism were assessed using standard diagnostic codes, ICD 9-10, and Read (see Online Appendix at www. jclinepi.com). We also examined whether clinically enhanced measures of comorbidity based on additional data from the electronic medical record (e.g., laboratory results, weight) would increase the detection and prevalence of co-morbid conditions, and whether more accurate classifica-tion would have an impact on the risk associated with the risk of cardiovascular events with hypoglycemic medications.
2.10. Code-based measures of comorbidity
Using ICD 9, ICD 10, and Read diagnostic codes, the following comorbidities were measured: asthma, COPD, hypertension, dementia, and cancer. Diagnostic codes were based on data recorded in the electronic medical record problem list as well as ICD 9 codes documented for med-ical visits in the administrative billing data (Canada, United States), and Read codes that are used to document clinical care in England (see Online Appendix at www.jclinepi. com).
2.11. Clinically enhanced measures of comorbidity
The clinically enhanced measures for each condition were based on diagnostic data from administrative and EMR data problem lists, as well as EMR drugs, vital signs, and laboratory data. Each measure that was chosen was based on literature in addition to clinical judgment [53e56].
2.11.1. Obesity
In addition to using diagnostic codes (see Online Appendixatwww.jclinepi.com), we also measured obesity by calculating body mass index (BMI)[57]. BMI was based on height and weight retrieved from the respective vital signs files in the EMRs in England and the United States. Obesity was defined as BMI30. We used the most recent height and weight (or BMI) recorded in the 2 years before the first prescription date to measure BMI. Equivalent data were not available for the Quebec cohort.
2.11.2. Renal disease
In addition to using diagnostic codes (see Online Appendixatwww.jclinepi.com), we measured renal disease using laboratory results, age, and sex. Enhanced measure-ment of renal disease was defined as either a diagnostic code or at least one glomerular filtration rate (GFR) or esti-mated GFR below 60 or at least one creatinine level that is above: 137 mL/min for males and 128 mL/min for females in the year before the first oral hypoglycemic prescription.
2.11.3. Hyperlipidemia
In addition to using diagnostic codes (ICD 9 272; ICD 10 E78), we measured hyperlipidemia by using prescrip-tions for lipid-lowering medication in the year before the first oral hypoglycemic prescription. Therapeutic classes included as lipid-lowering drugs were: HMG-CoA reduc-tase inhibitors, cholesterol absorption inhibitors, bile acid sequestrants, nicotinic acid groups, fibric acid derivatives, and combinations of these drugs.
2.12. Statistical analysis
Descriptive statistics were used to characterize the dia-betes cohorts in the three countries. To assess the impact of using prescribed vs. dispensed drugs to characterize drug
exposure, the incidence of primary nonadherence (individ-uals that did not fill their first prescription) was estimated in the Quebec cohort, where both prescribed and dispensed drug information were available. The drug, patient, and physician characteristics associated with primary nonadher-ence were estimated to characterize possible systematic biases in drug exposure measurement using multivariate lo-gistic regression within a generalized estimating equation framework with an exchangeable correlation structure. Physicians were the cluster and patient-drug combinations were the unit of analysis.
Cox proportional hazards models were used to estimate the risk of adverse cardiovascular events in the Quebec cohort in relationship to primary nonadherence as well as the two approaches to drug exposure measurement: elec-tronic prescription data and dispensed medication data. Both analyses provided information on whether systematic measurement errors in drug exposure assessment would impact the estimated risk of cardiovascular events. Primary nonadherence was assessed as a binary exposure based on whether the individual filled or failed to fill their initial pre-scription in the first 12 months. To measure drug use during follow-up, exposure was modeled as a time-dependent co-variate, starting at the date of the first prescription. Risk was estimated for each therapeutic category of oral hypo-glycemic, using biguanides as the reference category. Pe-riods where there was no drug prescription or supply were included in the drug exposure classification as ‘‘no drug use.’’ Patients were followed until the occurrence of the first cardiovascular event or to the end of the follow-up period. We conducted a sensitivity analysis to determine if the presence or absence of a diagnosis of diabetes influ-enced the results.
The same approach was used to evaluate the impact of having richer clinical data vs. diagnostic codes alone to measure clinically relevant comorbidities: obesity, lipid dis-order, and renal disease. Differences in the prevalence of these conditions were first estimated using the two data sources, and then, two Cox proportional hazards models were fit for clinical data enriched and diagnostic code alone measures of comorbidity in each site.
The study was approved by the McGill IRB, Brigham and Women’s ethics committee, and the Independent Scien-tific Advisory Committee of CPRD.
3. Results
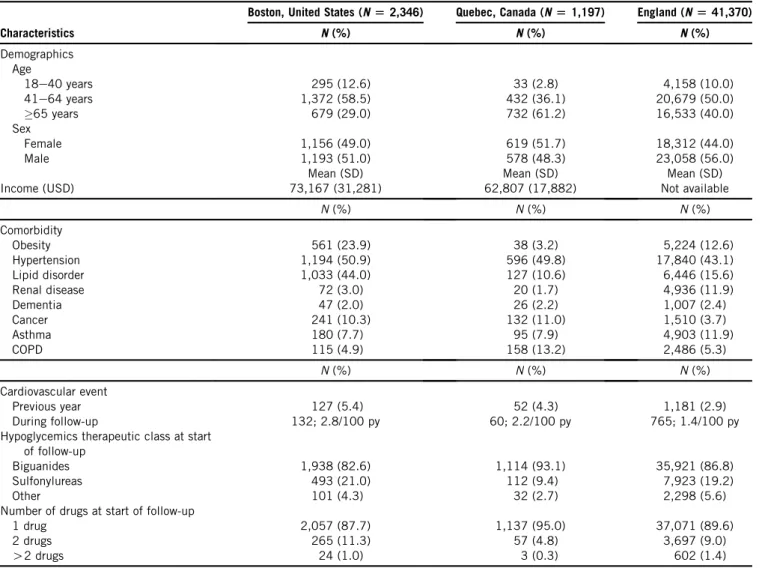
Overall, 1,197 to 41,370 new users of oral hypoglycemic were identified in each country (Table 1). The Boston cohort of new users was younger, with only 29% of new users being aged 65 years or older compared to 40% in En-gland and 61.2% in Quebec, but the sex distribution was similar. The prevalence of obesity (23.9%) and lipid disor-der (44.0%) was substantially higher in the Boston cohort than either the Quebec (3.2%, 10.6%) or England cohort
(12.6%, 15.6%). The cohorts also differed in the prevalence of COPD and cancer. Overall, 2.9 to 5.4% of patients had a cardiovascular event (MI or stroke) in the year before start-ing therapy, and the incidence of cardiovascular events dur-ing follow-up varied from 1.4 to 2.8 per 100 person years. The US cohort had the highest rate of cardiovascular events. In each country, most patients were started on monotherapy, the most common therapy being metformin (82.6% in Boston to 93.1% in Quebec).
In the Quebec cohort, 894 of the 1,197 patients had continuous drug insurance providing complete data on pre-scribed and dispensed drugs during follow-up. Overall, 13% of patients who were prescribed new oral hypoglyce-mic therapy failed to fill their prescription (Table 2). There was a lower risk of primary nonadherence among patients who were older (a 3% reduction in risk with each additional year [odds ratio (OR): 0.97;P50.01)], had no copayment [a 81% reduction in risk (OR: 0.19;P!0.001)], were pre-scribed a biguanide [an 83% reduction in risk compared to sulfonylureas (OR: 0.17; P ! 0.001)], and were already taking a greater number of medications in the year before
starting diabetes therapy [an 18% reduction in risk with each additional medication (OR: 0.82; P ! 0.001)]. Pri-mary nonadherence was associated with a nonstatistically significant increase in the rate of cardiovascular events dur-ing follow-up [4.8% vs. 2.8% for adherent patients; hazard ratio (HR) 1.69; 95% CI: 0.57, 5.01;P5 0.35].
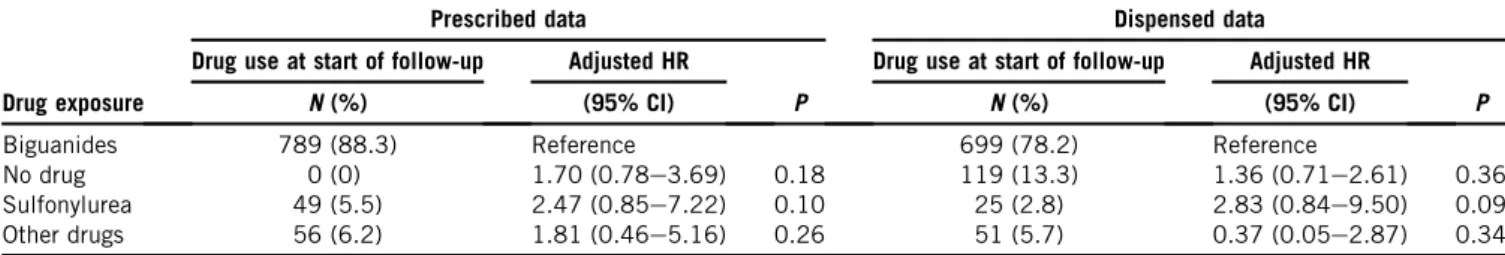
In comparing the risks of cardiovascular events using prescribed vs. dispensed information to classify drug expo-sure, misclassification of exposure attenuated the risks associated with the sulfonylureas (from HR: 2.83 to HR: 2.47;Table 3). In comparison, the use of prescription data was associated with an increase in the risk associated with periods of nondrug use. The increase in the risk of cardio-vascular events with nondrug use based on the prescription data was seen in all three country cohorts (Quebec HR: 1.70, 95% CI: 0.8, 3.4; England HR: 2.0, 95% CI: 1.7, 2.4; and Boston HR: 2.4, 95% CI: 1.4, 4.1;Table 4). The mean duration of the first prescription was approximately 1 year in all three countries. Thus, compared to the dispensing data, the risk of nondrug use would occur later in the course of follow-up.
Table 1.Characteristics of all new users of oral hypoglycemics in the three countries
Characteristics
Boston, United States (N[2,346) Quebec, Canada (N[1,197) England (N[41,370)
N(%) N(%) N(%) Demographics Age 18e40 years 295 (12.6) 33 (2.8) 4,158 (10.0) 41e64 years 1,372 (58.5) 432 (36.1) 20,679 (50.0) 65 years 679 (29.0) 732 (61.2) 16,533 (40.0) Sex Female 1,156 (49.0) 619 (51.7) 18,312 (44.0) Male 1,193 (51.0) 578 (48.3) 23,058 (56.0) Mean (SD) Mean (SD) Mean (SD) Income (USD) 73,167 (31,281) 62,807 (17,882) Not available
N(%) N(%) N(%) Comorbidity Obesity 561 (23.9) 38 (3.2) 5,224 (12.6) Hypertension 1,194 (50.9) 596 (49.8) 17,840 (43.1) Lipid disorder 1,033 (44.0) 127 (10.6) 6,446 (15.6) Renal disease 72 (3.0) 20 (1.7) 4,936 (11.9) Dementia 47 (2.0) 26 (2.2) 1,007 (2.4) Cancer 241 (10.3) 132 (11.0) 1,510 (3.7) Asthma 180 (7.7) 95 (7.9) 4,903 (11.9) COPD 115 (4.9) 158 (13.2) 2,486 (5.3) N(%) N(%) N(%) Cardiovascular event Previous year 127 (5.4) 52 (4.3) 1,181 (2.9) During follow-up 132; 2.8/100 py 60; 2.2/100 py 765; 1.4/100 py Hypoglycemics therapeutic class at start
of follow-up
Biguanides 1,938 (82.6) 1,114 (93.1) 35,921 (86.8) Sulfonylureas 493 (21.0) 112 (9.4) 7,923 (19.2)
Other 101 (4.3) 32 (2.7) 2,298 (5.6)
Number of drugs at start of follow-up
1 drug 2,057 (87.7) 1,137 (95.0) 37,071 (89.6) 2 drugs 265 (11.3) 57 (4.8) 3,697 (9.0)
O2 drugs 24 (1.0) 3 (0.3) 602 (1.4)
Abbreviations:COPD, chronic obstructive pulmonary disease; SD, standard deviation.
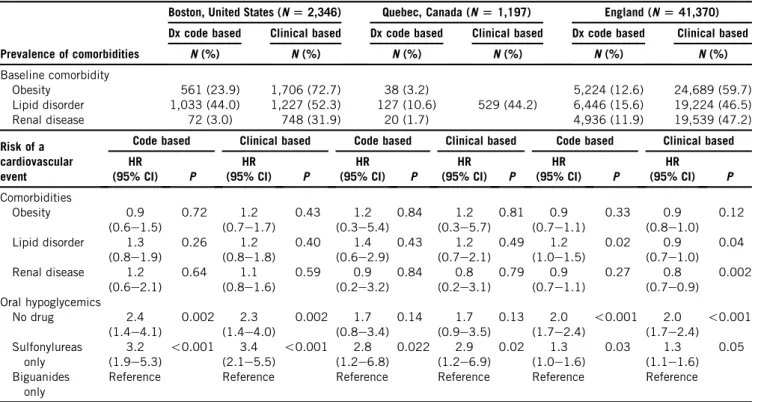
The prevalence of obesity, lipid disorders, and renal dis-ease incrdis-eased substantially when additional clinical infor-mation was used to measure comorbidity. Obesity increased the most from 23.9% to 72.7% in Boston and from 12.6% to 59.7% in England. However, with the exception of En-gland, neither diagnostic codes nor clinical measurements of comorbidity had a significant association with the risk of cardiovascular events during follow-up. The risk of car-diovascular events was significantly higher for patients us-ing sulfonylureas compared to biguanides in all three countries and was unaffected by adjustment for code-based or clinically enhanced measures of comorbidity. The risk of cardiovascular events with sulfonylureas was highest for the Boston-based cohort (HR 3.4; 95% CI:
2.1, 5.5), an almost threefold greater risk than the England cohort (HR: 1.3; 95% CI: 1.1, 1.6). Of all sulfonylurea pre-scriptions in England, 87.6% are for gliclazide, a drug that is not approved in the United States.
4. Discussion
This study created a novel prototype of a multinational sur-veillance system to monitor drug safety through EHRs. Using the risk of cardiovascular disease in relationship to oral hypo-glycemic treatment in type 2 diabetics as an exemplar, we suc-cessfully assembled three cohorts of patients that were newly started on therapy using EHRs in three countries. We
Table 2.The patient and drug characteristics associated with primary adherence in the Quebec cohort
Characteristics
Primary adherence status
Risk of primary nonadherence Nonadherent Adherent N(%) N(%) Number of patients 116 (13.0) 778 (87.0) Predictor N(%) N(%) OR (95% CI) P Patient characteristics Age 59 50 (17.7) 233 (82.3) 60e68 26 (11.4) 203 (88.7) 69e75 16 (8.2) 179 (91.8) 75 24 (12.8) 163 (87.2) Age 0.97 (0.95e0.99) 0.01 Sex Male 60 (13.9) 372 (86.1) Reference Female 56 (12.1) 406 (87.9) 1.08 (0.66e1.76) 0.76 Drug insurance status
Maximum copayment 87 (16.5) 440 (83.5) Reference
Partial copayment 20 (9.3) 195 (90.7) 0.69 (0.4e1.19) 0.18 No copayment 9 (5.9) 143 (94.1) 0.19 (0.08e0.49) !0.001 Drug characteristics Oral hypoglycemicsa Sulfonylureas 32 (36.4) 56 (63.6) Reference Biguanides 82 (9.9) 748 (90.1) 0.17 (0.09e0.33) !0.001 Other 12 (48.0) 13 (52.0) 0.004 (0e2.93) 0.10 Mean (SD) Mean (SD)
Drug cost (per $ increase) $10.52 (13.5) $6.82 (3.1) 1.11 (0.99e1.25) 0.08 No. of drugs in the baseline (per 1 drug
increase)
2.87 (4.6) 7.10 (5.3) 0.82 (0.75e0.89) !0.001 Abbreviations:SD, standard deviation; OR, odds ration; CI, confidence interval.
a
Values correspond to number of prescriptions and not number of patients as certain individuals had more than one prescription for an oral hypoglycemic.
Table 3.Difference in estimated risk of cardiovascular events using prescribed vs. dispensed data for 894 patients from Quebec
Drug exposure
Prescribed data Dispensed data Drug use at start of follow-up Adjusted HR
P
Drug use at start of follow-up Adjusted HR
P N(%) (95% CI) N(%) (95% CI)
Biguanides 789 (88.3) Reference 699 (78.2) Reference
No drug 0 (0) 1.70 (0.78e3.69) 0.18 119 (13.3) 1.36 (0.71e2.61) 0.36 Sulfonylurea 49 (5.5) 2.47 (0.85e7.22) 0.10 25 (2.8) 2.83 (0.84e9.50) 0.09 Other drugs 56 (6.2) 1.81 (0.46e5.16) 0.26 51 (5.7) 0.37 (0.05e2.87) 0.34
developed methods to map different diagnostic, clinical and drug use measures to a common international standard and used the information assets in one country to estimate the extent of bias in drug exposure and comorbidity measurement. In each country, we showed the expected results: an in-crease in the risk of cardiovascular events with sulfonyl-ureas compared to metformin. Risk estimates were within the CIs of those reported previously using both administra-tive data and EHRs[38e46].
One unexpected finding was that there were substantial differences in the magnitude of the risk among countriesd an almost threefold greater risk of cardiovascular events with the sulfonylureas in the US cohort compared to En-gland that appear to be related to health system effects on prescribing practices. Although differences in risk may represent unmeasured confounding, a more plausible expla-nation is the sulfonylureas prescribed in the two countries. England almost exclusively used gliclazide as the sulfonyl-urea of choice. In the United States, gliclazide is not approved, and glipizide (58.7%) and glyburide (38.0%) ac-count for 97% of the sulfonylurea prescriptions. Both ani-mal and human studies [43,58,59] consistently show that the risk of cardiovascular events with gliclazide is no different than with the metformin, whereas with all other sulfonylureas, there is a significant increase in the risk of cardiovascular events. The selective affinity of gliclazide for K ATP channels in the pancreatic beta cells rather than the heart and smooth muscle is thought to be responsible for
these differences in risk[59]. These findings highlight the value of a multinational surveillance system that can mine natural experimental differences in health systems and pop-ulations such as drug approval, prescribing practices, and case mix to more rapidly illuminate important attributes of drug risk and benefit that require further investigation.
One of the benefits of multinational surveillance is that investigators are able to use assets in one country to esti-mate potential sources of bias. In this study, the Canadian site was used to evaluate the potential limitations of using prescription data to measure drug exposure. We showed that approximately 1 in 10 patients who are newly started on an oral hypoglycemic do not fill the initial prescription that primary noncompliance was differential across thera-peutic classes and was most strongly associated with health systemerelated policies that define the amount the patient will have to pay for the drug. Drug costs and patient cost-sharing policies within a country or jurisdiction have been shown to influence primary and secondary adherence to therapy[60e63]. As a result, measurement error will be introduced, particularly for higher cost new drug therapies that will attenuate the estimated risk of drug use in post-market surveillance studies. In this study, the risk of cardio-vascular events with the use of sulfonylureas was greater when dispensing data were used to measure drug exposure compared to prescribing data, from HR 2.49 to HR 2.83, a 13% increase in risk. When dispensing data are not avail-able, the positive predictive value for a subset of the
Table 4.Difference in code vs. clinical measurements of comorbidity and its impact on the risk of cardiovascular events with oral hypoglycemics
Prevalence of comorbidities
Boston, United States (N[2,346) Quebec, Canada (N[1,197) England (N[41,370) Dx code based Clinical based Dx code based Clinical based Dx code based Clinical based
N(%) N(%) N(%) N(%) N(%) N(%) Baseline comorbidity Obesity 561 (23.9) 1,706 (72.7) 38 (3.2) 5,224 (12.6) 24,689 (59.7) Lipid disorder 1,033 (44.0) 1,227 (52.3) 127 (10.6) 529 (44.2) 6,446 (15.6) 19,224 (46.5) Renal disease 72 (3.0) 748 (31.9) 20 (1.7) 4,936 (11.9) 19,539 (47.2) Risk of a cardiovascular event
Code based Clinical based Code based Clinical based Code based Clinical based HR (95% CI) P HR (95% CI) P HR (95% CI) P HR (95% CI) P HR (95% CI) P HR (95% CI) P Comorbidities Obesity 0.9 (0.6e1.5) 0.72 1.2 (0.7e1.7) 0.43 1.2 (0.3e5.4) 0.84 1.2 (0.3e5.7) 0.81 0.9 (0.7e1.1) 0.33 0.9 (0.8e1.0) 0.12 Lipid disorder 1.3 (0.8e1.9) 0.26 1.2 (0.8e1.8) 0.40 1.4 (0.6e2.9) 0.43 1.2 (0.7e2.1) 0.49 1.2 (1.0e1.5) 0.02 0.9 (0.7e1.0) 0.04 Renal disease 1.2 (0.6e2.1) 0.64 1.1 (0.8e1.6) 0.59 0.9 (0.2e3.2) 0.84 0.8 (0.2e3.1) 0.79 0.9 (0.7e1.1) 0.27 0.8 (0.7e0.9) 0.002 Oral hypoglycemics No drug 2.4 (1.4e4.1) 0.002 2.3 (1.4e4.0) 0.002 1.7 (0.8e3.4) 0.14 1.7 (0.9e3.5) 0.13 2.0 (1.7e2.4) !0.001 2.0 (1.7e2.4) !0.001 Sulfonylureas only 3.2 (1.9e5.3) !0.001 3.4 (2.1e5.5) !0.001 2.8 (1.2e6.8) 0.022 2.9 (1.2e6.9) 0.02 1.3 (1.0e1.6) 0.03 1.3 (1.1e1.6) 0.05 Biguanides only
Reference Reference Reference Reference Reference Reference Abbreviations:HR, hazard ratio; CI, confidence interval.
Notes: 1. Multivariate Cox Proportional hazards models were estimated separately for each country and for code vs. clinically enhanced comor-bidities. Each model was adjusted for age, sex, comorbidities, insulin use, and prior cardiovascular events.
population from a country with comparable costs and co-payment policies could be used to adjust for the underesti-mate of risk. Abrahamowicz has outlined several approaches that could be used to adjust for these biases [64].
Periods of nondrug use were associated with a signifi-cant increase in risk of cardiovascular events in all three countries, but only when prescribing data were used to measure drug exposure. Failure to return to obtain subse-quent prescriptions may represent medication nonadher-ence, which in diabetes has been associated with a 41% increase in inpatient costs; findings that are consistent with our study, which also shows a risk of cardiovascular events with nonadherence[65]. Once drug exposure measurement was corrected for actual drug supply using dispensing data, there was a substantial reduction in the risk. This is likely due to a mix of effects that include both the healthier subset of newly treated diabetics that did not fill their first pre-scription (that are never included in medication adherence studies), as well as those that were less adherent after start-ing therapy.
We found a substantial, but not surprising, increase in the prevalence of comorbidity when measurement was based on clinical data in addition to diagnostic data. This was particularly true for obesity and renal disease where there was a twofold to threefold increase in prevalence once additional clinical data were considered. These results un-derline the value of increasing capacity to use EHRs in pharmacosurveillance research. Although better measure-ment of comorbidity did not have an impact on the esti-mated risk of oral hypoglycemics, they were not strong confounders for adverse cardiovascular events in relation-ship to drug exposure. Enrichment of other, more signifi-cant, confounders in another setting may well impact the results more profoundly.
One of the challenges in using EHR data from different countries is the differences in classification systems used to code health problems and medications. Fortunately, most EHR-based prescribing systems document the drug pre-scribed using standardized text strings. These standardized text strings can be easily mapped to the WHO master list to harmonize drug exposure measures [47]. In contrast, dosing information is typically entered as free text, and text-mining algorithms need to be developed to extract in-formation about the dose per administration and the fre-quency per day. Some progress is being made in developing accurate extraction methods for drug dosing data [66]. Diabetes and other comorbidities that were relevant to the risk of cardiovascular disease were identified using ICD 9, ICD 10 (United States and Canada), and Read codes (En-gland). Ultimately, the aim is to use SNOMED CT as the classification system for EHRs as it provides the refinement needed for clinical documentation and ICD 10 for adminis-trative documentation. Approximately 69% of problems can be equivalently identified by both systems[67]. Differences in the prevalence of comorbidities in the different
jurisdictions noted in this study may be related to the lack of precision of the coding systems, local diagnostic prac-tices, or true differences in population rates. Future research should extend recommended approaches for validating diag-noses in EHR systems to support international investigation [68].
There are a number of limitations to consider in this study. First, the estimation of risk by therapeutic class masked important differences that may exist in the cardio-vascular risk of different sulfonylureas; however, the almost complete nesting of sulfonylureas used in the respective countries made it impossible to separate drug from country effects. Second, the smaller sample size in the Quebec cohort compromised the power to identify clinically mean-ingful associations. Third, although prior studies have pro-vided evidence of the validity of diagnostic data within the EHRs used in this study[68e74], we do not know whether there was equivalent ascertainment of comorbidities across jurisdictions.
In summary, a multinational surveillance system that builds on international efforts to deploy EHRs has the po-tential to produce more timely information about drug safety and effectiveness than traditional approaches because millions of new users can be monitored worldwide, and differential effects by race, sex, and clinical subgroups can be more rapidly detected. We have shown that this approach is feasible, and the results are validated by sub-stantial existing evidence of a greater risk of cardiovascular events with sulfonylureas. Multiple countries also provided unique opportunities to estimate potential sources of bias and identify health system characteristics and prescribing practices can modify drug safety and effectiveness.
Supplementary Data
Supplementary data related to this article can be found at http://dx.doi.org/10.1016/j.jclinepi.2016.03.033.
References
[1] IMS Institute for Healthcare Informatics. Global outlook for medi-cines through 2018. 2014. Available at:http://www.imshealth.com/ en/thought-leadership/ims-institute/reports/global-outlook-for-medic ines-through-2018.
[2] Weaver J, Willy M, Avigan M. Informatic tools and approaches in postmarketing pharmacovigilance used by FDA. AAPS J 2008;10: 35e41.
[3] Couzin J. Drug safety. Gaps in the safety net. Science 2005;307: 196e8.
[4] Gough S. Post-marketing surveillance: a UK/European perspective. Curr Med Res Opin 2005;21:565e70.
[5] Budnitz DS, Pollock DA, Weidenbach KN, Mendelsohn AB, Schroeder TJ, Annest JL. National surveillance of emergency department visits for outpatient adverse drug events. JAMA 2006; 296:1858e66.
[6] Platt R, Wilson M, Chan KA, Benner JS, Marchibroda J, McClellan M. The new sentinel networkeimproving the evidence
[7] Lasser KE, Seger DL, Yu DT, Karson AS, Fiskio JM, Seger AC, et al. Adherence to black box warnings for prescription medications in outpatients. Arch Intern Med 2006;166:338e44.
[8] Ray WA, Stein CM. Reform of drug regulationebeyond an
indepen-dent drug-safety board. N Engl J Med 2006;354:194e201. [9] Waxman HA. The lessons of Vioxxedrug safety and sales. N Engl J
Med 2005;352:2576e8.
[10] Institute of Medicine. Crossing the quality chasm: a new health sys-tem for the 21st century. Washington: National Academy Press; 2001. [11] Wolfstadt JI, Gurwitz JH, Field TS, Lee M, Kalkar S, Wu W, et al. The effect of computerized physician order entry with clinical deci-sion support on the rates of adverse drug events: a systematic re-view. J Gen Intern Med 2008;23:451e8.
[12] Kuperman GJ, Bobb A, Payne TH, Avery AJ, Gandhi TK, Burns G, et al. Medication-related clinical decision support in computerized provider order entry systems: a review. J Am Med Inform Assoc 2007;14:29e40.
[13] Figge H. Reducing medication errors using technological innova-tions. U S Pharmacist; Clifton Park, NY; 2009:HS-15e6. [14] Kaushal R, Shojania KG, Bates DW. Effects of computerized
physi-cian order entry and clinical decision support systems on medication safety: a systematic review. Arch Intern Med 2003;163:1409e16. [15] Ammenwerth E, Schnell-Inderst P, Machan C, Siebert U. The effect of
electronic prescribing on medication errors and adverse drug events: a systematic review. J Am Med Inform Assoc 2009;15:585e600. [16] Durieux P, Trinquart L, Colombet I, Nies J, Waltom R, Rajeswaran A,
et al. Computerized advice on drug dosage to improve prescribing practice (review). The Cochrane Libr 2009;1e55.
[17] van Rosse F, Maat B, Rademaker CM, van Vught AJ, Egberts AC, Bollen CW. The effect of computerized physician order entry on medication prescription errors and clinical outcome in pediatric and intensive care: a systematic review. Pediatrics 2009;123: 1184e90.
[18] Yourman L, Concato J, Agostini JV. Use of computer decision sup-port interventions to improve medication prescribing in older adults: a systematic review. Am J Geriatr Pharmacother 2008;6:119e29. [19] Canadian Agency for Drugs and Technologies in Health (CADTH).
Technologies to reduce errors in dispensing and administration of medication in hospitals: clinical and economic analyses. CADTH Technol Overv 2010;1:e0116.
[20] Corley ST. Electronic prescribing: a review of costs and benefits. Top Health Inf Manage 2003;24:29e38.
[21] Schiff GD, Rucker TD. Computerized prescribing: building the elec-tronic infrastructure for better medication usage. JAMA 1998;279: 1024e9.
[22] International Health Terminology Standards Development Organi-sation. IHTSDO Appoints Chief Officers 2010. Available at:
http://www.ihtsdo.org/. Accessed May 26, 2016.
[23] Blumenthal D, Tavenner M. The ‘‘meaningful use’’ regulation for electronic health records. N Engl J Med 2010;363:501e4. [24] Hoffman C. Canadian Standards Association and Canada Health
In-foway Team Up for the Advancement of International Health Infor-mation Technology Standards. 2006. Available at: http://www. csa.ca/cm/ca/en/search/article/advancement-of-international-health-standards.
[25] U.S. National Library of Medicine. Health Information Technology and Health Data Standards at NLM 2010. Available at:https://www. nlm.nih.gov/healthit/index.html. Accessed May 26, 2016. [26] McMahon AW, Wharton GT, Bonnel R, DeCelle M, Swank K,
Testoni D, et al. Pediatric post-marketing safety systems in North America: assessment of the current status. Pharmacoepidemiol Drug Saf 2015;24:785e92.
[27] French DD, Margo CE, Campbell RR. Enhancing postmarketing sur-veillance: continuing challenges. Br J Clin Pharmacol 2015;80:615e7. [28] Platt R, Madre L, Reynolds R, Tilson H. Active drug safety surveil-lance: a tool to improve public health. Pharmacoepidemiol Drug Saf 2008;17:1175e82.
[29]Behrman RE, Benner JS, Brown JS, McClellan M, Woodcock J, Platt R. Developing the sentinel systemea national resource for
ev-idence development. N Engl J Med 2011;364:498e9.
[30]Keshavjee K, Manji A, Singh B, Pairaudeau N. Failure of electronic medical records in Canada: a failure of policy or a failure of tech-nology? Stud Health Technol Inform 2009;143:107e14.
[31]Mikuls TR, Fay BT, Michaud K, Sayles H, Thiele GM, Caplan L, et al. Associations of disease activity and treatments with mortality in men with rheumatoid arthritis: results from the VARA registry. Rheumatology (Oxford) 2011;50:101e9.
[32]Kim HM, Zivin K, Ganoczy D, Pfeiffer P, Hoggatt K, McCarthy JF, et al. Predictors of alternative antidepressant agent initiation among U. S. veterans diagnosed with depression. Pharmacoepidemiol Drug Saf 2010;19:1049e56.
[33]Bansard C, Lequerre T, Daveau M, Boyer O, Tron F, Salier JP, et al. Can rheumatoid arthritis responsiveness to methotrexate and bio-logics be predicted? Rheumatology (Oxford) 2009;48:1021e8. [34]Hippisley-Cox J, Coupland C. Unintended effects of statins in men
and women in England and Wales: population based cohort study using the QResearch database. BMJ 2010;340:c2197.
[35]Hippisley-Cox J, Coupland C. Individualising the risks of statins in men and women in England and Wales: population-based cohort study. Heart 2010;96:939e47.
[36]Evans WE, Relling MV. Pharmacogenomics: translating functional genomics into rational therapeutics. Science 1999;286:487e91. [37]Malhotra AK, Murphy GM Jr, Kennedy JL. Pharmacogenetics of
psychotropic drug response. Am J Psychiatry 2004;161:780e96. [38]Simpson SH, Majumdar SR, Tsuyuki RT, Eurich DT, Johnson JA.
Dose-response relation between sulfonylurea drugs and mortality in type 2 diabetes mellitus: a population-based cohort study. CMAJ 2006;174(2):169e74.
[39]Tzoulaki I, Molokhia M, Curcin V, Little MP, Millett CJ, Ng A, et al. Risk of cardiovascular disease and all cause mortality among patients with type 2 diabetes prescribed oral antidiabetes drugs: retrospective cohort study using UK general practice research data-base. BMJ 2009;339:b4731.
[40]Sullivan D, Forder P, Simes J, Whiting M, Kritharides L, Merrifield A, et al. Associations between the use of metformin, sul-phonylureas, or diet alone and cardiovascular outcomes in 6005 people with type 2 diabetes in the FIELD study. Diabetes Res Clin Pract 2011;94:284e90.
[41]Mazzone T, Meyer PM, Feinstein SB, Davidson MH, Kondos GT, D’Agostino RB Sr, et al. Effect of pioglitazone compared with gli-mepiride on carotid intima-media thickness in type 2 diabetes: a randomized trial. JAMA 2006;296:2572e81.
[42]de Jager J, Kooy A, Schalkwijk C, van der Kolk J, Lehert P, Bets D, et al. Long-term effects of metformin on endothelial function in type 2 dia-betes: a randomized controlled trial. J Intern Med 2014;275:59e70. [43]Abdelmoneim AS, Eurich DT, Gamble JM, Johnson JA, Seubert JM,
Qiu W, et al. Risk of acute coronary events associated with glybur-ide compared with gliclazglybur-ide use in patients with type 2 diabetes: a nested case-control study. Diabetes Obes Metab 2014;16:22e9. [44]Schramm TK, Gislason GH, Vaag A, Rasmussen JN, Folke F,
Hansen ML, et al. Mortality and cardiovascular risk associated with different insulin secretagogues compared with metformin in type 2 diabetes, with or without a previous myocardial infarction: a nation-wide study. Eur Heart J 2011;32:1900e8.
[45]Jorgensen CH, Gislason GH, Andersson C, Ahlehoff O, Charlot M, Schramm TK, et al. Effects of oral glucose-lowering drugs on long term outcomes in patients with diabetes mellitus following myocar-dial infarction not treated with emergent percutaneous coronary in-terventionea retrospective nationwide cohort study. Cardiovasc
Diabetol 2010;9:54.
[46]Roumie CL, Hung AM, Greevy RA, Grijalva CG, Liu X, Murff HJ, et al. Comparative effectiveness of sulfonylurea and metformin monotherapy on cardiovascular events in type 2 diabetes mellitus: a cohort study. Ann Intern Med 2012;157:601e10.
[47] WHO Collaborating Centre for Drug Statistics Methodology. ATC/DDD Index 2015. 2014. Available at:http://www.whocc.no/ atc_ddd_index/. Accessed May 26, 2016.
[48]Sturmer T, Joshi M, Glynn RJ, Avorn J, Rothman KJ, Schneeweiss S. A review of the application of propensity score methods yielded increasing use, advantages in specific settings, but not substantially different estimates compared with conventional multivariable methods. J Clin Epidemiol 2006;59:437e47. [49]Shah BR, Laupacis A, Hux JE, Austin PC. Propensity score methods
gave similar results to traditional regression modeling in observa-tional studies: a systematic review. J Clin Epidemiol 2005;58: 550e9.
[50]Wilkins R. Use of postal codes and addresses in the analysis of health data. Health Rep 1993;5:157e77.
[51]Anavekar NS, Gans DJ, Berl T, Rohde RD, Cooper W, Bhaumik A, et al. Predictors of cardiovascular events in patients with type 2 dia-betic nephropathy and hypertension: a case for albuminuria. Kidney Int Suppl 2004;S50e5.
[52]McMurray JJ, Uno H, Jarolim P, Desai AS, de ZD, Eckardt KU, et al. Predictors of fatal and nonfatal cardiovascular events in pa-tients with type 2 diabetes mellitus, chronic kidney disease, and ane-mia: an analysis of the Trial to Reduce cardiovascular Events with Aranesp (darbepoetin-alfa) Therapy (TREAT). Am Heart J 2011; 162:748e55.
[53]Martin BJ, Chen G, Graham M, Quan H. Coding of obesity in administrative hospital discharge abstract data: accuracy and impact for future research studies. BMC Health Serv Res 2014;14:70. [54]Kern EF, Maney M, Miller DR, Tseng CL, Tiwari A, Rajan M, et al.
Failure of ICD-9-CM codes to identify patients with comorbid chronic kidney disease in diabetes. Health Serv Res 2006;41:564e80. [55]Quan H, Li B, Saunders LD, Parsons GA, Nilsson CI, Alibhai A,
et al. Assessing validity of ICD-9-CM and ICD-10 administrative data in recording clinical conditions in a unique dually coded data-base. Health Serv Res 2008;43:1424e41.
[56]Romano PS, Roos LL, Luft HS, Jollis JG, Doliszny K. A compari-son of administrative versus clinical data: coronary artery bypass surgery as an example. Ischemic Heart Disease Patient Outcomes Research Team. J Clin Epidemiol 1994;47:249e60.
[57] World Health Organization. Obesity and overweight 2015. Available at: http://www.who.int/mediacentre/factsheets/fs311/en/. Accessed May 26, 2016.
[58]Wang H, Yafang N, Yang S, Huizhi L, Xu L, Feng B. The effects of gliclazide, metformin, and acarbose on body composition in patients with newly diagnosed type 2 diabetes mellitus. Curr Ther Res 2013; 75:88e92.
[59]Lawrence CL, Proks P, Rodrigo GC, Jones P, Hayabuchi Y, Standen NB, et al. Gliclazide produces high-affinity block of KATP channels in mouse isolated pancreatic beta cells but not rat heart or arterial smooth muscle cells. Diabetologia 2001;44: 1019e25.
[60] Tamblyn R, Eguale T, Huang A, Winslade N, Doran P. The inci-dence and determinants of primary nonadherence with prescribed medication in primary care: a cohort study. Ann Intern Med 2014; 160:441e50.
[61] Fischer MA, Choudhry NK, Brill G, Avorn J, Schneeweiss S, Hutchins D, et al. Trouble getting started: predictors of primary medication nonadherence. Am J Med 2011;124:1081.e9e1081.e22. [62] Raebel MA, Ellis JL, Carroll NM, Bayliss EA, McGinnis B, Schroeder EB, et al. Characteristics of patients with primary non-adherence to medications for hypertension, diabetes, and lipid disor-ders. J Gen Intern Med 2012;27:57e64.
[63] Hakim A. E-prescribing and primary noncompliance: physician and patient experience. Prof Case Management 2010;15:62.
[64] Abrahamowicz M, Xiao Y, Ionescu-Ittu R, Lacaille D. Simulations showed that validation of database-derived diagnostic criteria based on a small subsample reduced bias. J Clin Epidemiol 2007;60:600e9. [65] Egede LE, Gebregziabher M, Dismuke CE, Lynch CP, Axon RN, Zhao Y, et al. Medication nonadherence in diabetes: longitudinal ef-fects on costs and potential cost savings from improvement. Dia-betes Care 2012;35:2533e9.
[66] Jiang M, Wu Y, Shah A, Priyanka P, Denny JC, Xu H. Extracting and standardizing medication information in clinical text - the MedEx-UIMA system. AMIA Jt Summits Transl Sci Proc 2014; 2014:37e42.
[67] Steindel SJ. A comparison between a SNOMED CT problem list and the ICD-10-CM/PCS HIPAA code sets. Perspect Health Inf Manag 2012;9:1b.
[68] Herrett E, Thomas S, Schoonen WM, Smeeth L, Hall Andrew J. Validation and validity of diagnoses in the general practice research database: a systematic review. Br J Clin Pharmacol 2010;69:4e14. [69] Lewis James D, Bilker WB, Weinstein RB, Strom BL. The relation-ship between time since registration and measured incidence rates in the General Practice Research Database. Pharmacoepidemiol Drug Saf 2005;14:443e51.
[70] Kaye JA, Derby LE, del Mar Melero-Montes M, Quinn M, Jick H. The incidence of breast cancer in the General Practice Research Database compared with national cancer registration data. Br J Can-cer 2000;83:1556e8.
[71] Wilchesky M, Tamblyn RM, Huang A. Validation of diagnostic codes in medical services claims data. Can J Clin Pharmacol 2001;8:39. [72] Poissant L, Taylor L, Huang A, Tamblyn R. Assessing the accuracy
of an inter-institutional automated patient-specific health problem list. BMC Med Inform Decis Mak 2010;10:10.
[73] Eguale T, Tamblyn R, Winslade N, Buckeridge D. Detection of adverse drug events and other treatment outcomes using an elec-tronic prescribing system. Drug Saf 2008;31:1005e16.
[74] Eguale T, Winslade N, Hanley JA, Buckeridge DL, Tamblyn R. Enhancing pharmacosurveillance with systematic collection of treatment indication in electronic prescribing: a validation study in Canada. Drug Saf 2010;33:559e67.