University College London Department o f Chemical Engineering
Design and Development of Microreactors
Kay Kin Yeong
November 2003
ProQuest Number: 10014442
All rights reserved
INFORMATION TO ALL USERS
The quality of this reproduction is dependent upon the quality of the copy submitted.
In the unlikely event that the author did not send a complete manuscript and there are missing pages, these will be noted. Also, if material had to be removed,
a note will indicate the deletion.
uest.
ProQuest 10014442
Published by ProQuest LLC(2016). Copyright of the Dissertation is held by the Author.
All rights reserved.
This work is protected against unauthorized copying under Title 17, United States Code. Microform Edition © ProQuest LLC.
ProQuest LLC
789 East Eisenhower Parkway P.O. Box 1346
Summary
The study o f microreactors involves the miniaturisation o f entire reactor systems on to structures ranging from several millimetres to several centimetres in length and height. Their large surface area to volume ratio results in efficient heat and mass transfer. As such, they allow better control o f processes and quick quenching, which can lead to improved selectivity and conversion. Safety is improved as their flame trap dimensions prevent flame propagation. Also, previously unfeasible reaction routes may be opened up. Because o f the way they are put together, there will be shorter lag time between R&D and industrial application. This is because scale-up is unnecessary. Instead, numbering-up o f reactors can be used to increase production capacities.
The first step in fabricating a microreactor is to appreciate the varied methods available. The most important and applicable methods are: photolithography, wet bulk machining, dry etching, chemical vapour deposition (CVD), LIGA, laser machining, ultraprecision machining, soft lithography and glass microfabrication. Combinations o f these techniques will allow the fabrication o f most reactors. In addition, since microfluidic systems typically take the form o f thin fabricated sheets carrying different unit operations which can be stacked to form a complete reaction system, bonding techniques are also very important. Examples include anodic bonding, fusion bonding, eutectic bonding and adhesive bonding.
photolithography, wet and dry etching, and anodic bonding. Since methanol is a liquid at room temperature, the reactor had to incorporate a pre-heating section to vaporise methanol prior to it entering the reaction section. Three reactor designs (channel width 600 pm and depth 300 pm) were made with differing reaction channel lengths (15, 104 and 207 mm). This was done to widen the range o f residence times. Catalyst deposition methods used included evaporation, manual placement o f silver wires/foils, electrodeposition and an in-situ chemical reaction, all o f which proved inadequate due to combinations o f poor adhesion, activity and stability. The sealing o f the reactor and the development o f suitable interfacing with external equipment proved to be major challenges too, mostly due to the high temperature operation o f the reactor. The final product was a silicon microreactor fabricated using Deep Reactive Ion Etching or KOH etching, with silver catalyst deposited through sputtering and sealed by a Pyrex plate through anodic bonding. High conversion was achieved using a mixture o f 8.0 - 8.6 % methanol and balance oxygen, without any helium to quench the reaction.
conversion, Farrauto, et al (1997)) was estimated to produce 204 kmol aniline/m^ reactor daily (assuming no downtime). In comparison, the p-FFR using the incipient wetness catalyst (0.1 mol nitrobenzene/1 ethanol, 0.5 ml/min., 1 bar H2 pressure, 60 °C, 5.4 g Pd/ml, 82 % conversion) would have a daily production rate o f 394 kmol aniline/m^ reactor. W hile a larger amount o f catalyst was used, the process conditions were significantly milder and the catalyst was unoptimised, proving that the p-FFR could enhance gas-liquid reactions that were mass transfer limited in practice.
The liquid film thickness obtained in the p-FFR at a range o f flowrates (0.5-2.0 ml/min) was studied using confocal microscopy. It was found that the Nusselt equation greatly underpredicted film thicknesses. The temperature profile p-FFR was measured using an IR-camera under non-reacting conditions by passing hot water through its heat exchanger (30-60 °C). The temperature distribution was reasonably uniform. However, the uniformity decreased slightly as the temperature increased (3 % at 30 °C, 5 % at 60 °C), with the central area o f the plate cooler than the sides, and the top and bottom being the warmest.
model, could have affected the experimental results.
The p-FFR was also used to perform the asymmetric transfer hydrogenation o f acetophenone to (S)-phenylethanol catalysed by a homogeneous rhodium complex that was activated by sodium isopropoxide, with isopropanol as the hydrogen source. The aim was to use the p-FFR as an evaporator-reactor to remove acetone in order to drive the equilibrium forward. It was shown that the p-FFR was m uch more efficient at evaporating acetone than a batch reactor (31 % at a theoretical residence time o f 9.3 s vs. 50 % in 60 min for a batch reactor with nitrogen bubbling through). However, when the reaction was performed, the p-FFR was found to have no impact on the conversion. This was most likely because the reactants had been pre-mixed in a flask (with nitrogen bubbling through), had reacted within it and the acetone produced had been evaporated within the flask itself. This is an example o f a reaction system where a batch reactor was perfectly capable o f driving the reaction to its limits, thus making a microreactor unnecessary.
A cknowledgem ents
I would like to thank the UCL Graduate School and the Overseas Research Students Awards Scheme for financial support, without which this project would not have proceeded.
My deepest gratitude to Dr. Asterios Gavriilidis for his constant guidance and advice throughout the length o f this project. I would also like to thank Dr. Enhong Gao for all the advice he has given me and the many discussions we had whenever problems turned up. Many thanks also to Dr. Panagiota Angeli, Professor Ian Boyd, Professor and Dr. Motherwell, Dr. Zheng Cui, Professor Alan Boyde and Dr. Monica Zanfir for the advice they offered.
The greater part o f this project was made possible by the Institut fur M ikrotechnik Mainz and its staff, m ost notably Dr. Volker Hessel and Dr. R alf Zapf. I would also like to offer my appreciation to all the technical staff at various institutions for their aid: Julian Perfect, Ghulam Warsi, Kevin Reeves and Derek Jenkins.
Table o f Contents
1. Introduction 1
2. Literature Survey 5
2.1 Characteristics o f Microfluidic Systems 5
2.1.1 Surface Tension 5
2.1.2 Fluid Flow 6
2.1.2.1 Single-phase Flow 6
2.1.2.2 Two-phase Flow 9
2.1.2.3 Fluid delivery 11
2.1.3 Thermal Characteristics 12
2.1.4 Structural Characteristics 13
2.2 Fabrication Methods 15
2.2.1 Photolithography and Etching Techniques 15
2.2.2 Chemical Vapour Deposition (CVD) 18
2.2.3 LIGA 20
2.2.4 Laser M achining 21
2.2.5 Ultraprecision Machining 22
2.2.6 Electrodischarge Machining (EDM) 23
2.2.7 Soft Lithography 23
2.2.8 Glass Microfabrication 24
2.2.9 M icrostereolithography 25
2.2.10 Mass fabrication techniques 25
2.2.11 Bonding Techniques 26
2.3 Catalyst Incorporation Techniques 29
2.4 Microdevices 32
2.4.1 Heat Transfer Devices 32
2.4.2 Mixing Devices 33
2.4.3 Chemical Analysis Devices 38
2.5 Integration o f Microdevices 40
2.5.1 V ertical integration 40
2.5.2 Horizontal integration 40
2.5.3 Integration o f heating and catalytic reaction 41 2.5.4 Integration o f mixing and catalytic reaction 42 2.5.5 Integration o f mixing, heating, catalytic reaction and sensing 43 2.5.6 Integration o f heating, sensing and separation 44
2.6 Applications o f Microengineered Reactors 45
2.6.1 Chemical Analysis 45
2.6.2 High Throughput Screening and Experimentation 48 2.6.3 Access to New Chemistry and Operating Conditions 50 2.6.3.1 Systems with efficient heat exchange 51 2.6.3.1 Systems with good residence time control 52 2.6.3.1 Systems with efficient mass transfer and heat exchange 55
2.6.4 Process Development 57
2.6.5 Distributed and Mobile Processing 59
2.6.6 Process Intensification 63
2.6.7 Extraterrestrial Processing 66
2.6.8 Scale-out 67
2.8 Conclusion 73
3. T-Microreactor 75
3.1 Design Basis and Rationale 75
3.1.1 Reaction 76
3.1.2 Materials 77
3.2 Design Considerations 78
3.2.1 Flowrate Calculations 78
3.2.2 Pre-heat Channels 80
3.2.3 Reactor Configuration 83
3.3 Reactor Fabrication 83
3.3.1 Mask 84
3.3.2 Choice o f Etching Route 84
3.3.3 Wet Etching (Small Depths) 86
3.3.3.1 First Attempt 86
3.3.3.2 Second Attempt 89
3.3.3.3 Third Attempt 91
3.3.3.4 Optimisation o f Etching Parameters 93
3.3.4 Wet Etching (Large Depths) 96
3.3.5 Finalised Etching Procedure 97
3.3.5.1 Wet Etching using KOH 98
3.3.5.2 Dry Etching using DRIE 100
3.4 Anodic Bonding 102
3.4.1 Initial Attempt 103
3.4.2 Further Exploratory Work 105
3.4.3 Development W ork 106
3.4.4 Simple Anodic Bonder 108
3.5 Silicon Fusion Bonding 109
3.6 Catalyst Deposition 110
3.6.1 Evaporation 111
3.6.2 Manual Placement 112
3.6.3 Electrodeposition 115
3.6.4 Silver Deposition using an In-situ Chemical Reaction 117
3.7 Experimental Set-up 124
3.7.1 Method o f Heating 125
3.7.2 Input/output Interface 127
3.7.3 Testing o f the Set-up 128
3.8 Reaction Experiments 133
3.8.1 Silver Foil and W ire Reactor 133
3.8.2 Silver Mirror Reactor (1) 134
3.8.3 Silver M irror Reactor (H) 135
3.8.4 Summary o f Further Experimental Work Carried Out 137
3.9 Conclusion 138
4. Falling Film Reactor: Nitrobenzene Hydrogenation 140
4.1 Reactor Configuration 140
4.1.2 Description o f the Reactor 141
4.1.3 Liquid Film Thickness 143
4.2 Suitability o f Hydrogenations for the p,-FFR 144
4.2.1 Catalysts 145
4.2.2 Solvent 148
4.2.3 Operating Conditions 149
4.2.4 Safety 150
4.2.5 Reaction Selection Criteria 151
4.2.6 Hydrogenation o f Nitrobenzene 152
4.3 Catalyst Preparation 154
4.3.1 Sputtering o f Palladium (SP) 155
4.3.2 UV-decomposition o f Palladium Aeetate (UV) 155
4.3.3 Wet Impregnation (IP) 155
4.3.4 Incipient Wetness (IW) 156
4.4 Experimental Apparatus and Procedure 156
4.4.1 Heating 158
4.4.2 Liquid Flow Testing 158
4.4.3 Estimation o f Reactant Coneentration 160
4.4.4 Analysis Method 161
4.4.5 Experimental Procedure 161
4.5 Experiments (I) - Sputtered Palladium Catalyst 162
4.5.1 Exploratory Experiments 162
4.5.2 Deaetivation Experiments 164
4.5.3 Deaetivation Issues 166
4.5.4 Identification o f Side Produets 169
4.5.5 Discussion o f Results 174
4.6 Experiments (II) - UV-decomposed Palladium Acetate Catalyst (UV) 175
4.6.1 Experimental Results 176
4.6.2 Discussion o f Results 177
4.7 Experiments (HI) - Sputtered Palladium Catalyst (II) (SP2) 179
4.7.1 New Column 179
4.7.2 Experimental Results 180
4.7.3 Discussion o f Results 181
4.8 Experiments (IV) - Impregnated Palladium Catalyst (IP l) 183
4.8.1 Experimental Results 183
4.8.2 Catalyst Reactivation 185
4.8.3 Parametric Study 189
4.8.4 Discussion o f Results 192
4.9 Experiments (V) - Incipient Wetness Catalyst (I) (IW l) 193
4.9.1 Experimental Results 194
4.9.2 Discussion o f Results 197
4.10 Experiments (VI) - Impregnated Palladium Catalyst (II) (IP2) 202
4.10.1 Experimental Results 202
4.10.2 Discussion o f Results 205
4.11 Experiments (VII) - Incipient Wetness Catalyst (II) (IW2) 206
4.11.1 Experimental Results 206
4.11.2 Discussion o f Results 210
4.12 Summary o f Experimental Results and Conelusions 210
4.12.2 Selectivity Towards Aniline 212
4.12.3 Carbon Balance Closure 214
4.12.4 Causes for Deactivation 216
4.12.5 Parametric Studies 217
4.12.6 Comparison with a Batch Reactor 220
4.13 Conclusions 221
5. Microstructured Falling Film Reactor: Hydrodynamic and
Temperature Profile Investigation 222
5.1 Liquid Film Thickness Measurements using Confocal M icroscopy 222 5.1.1 Basic Working Principle o f Confocal M icroscopy 222
5.1.2 Preliminary Experiments 224
5.1.3 Liquid Film Thickness Measurements 229
5.2 Temperature Profile Investigation using Infra-red (IR) Spectroscopy 232
5.3 Conclusions 235
6. Microstructured Falling Film Reactor: Modelling o f
Nitrobenzene Hydrogenation 237
6.1 The Model 237
6.2 Liquid Film Thickness 242
6.3 Langmuir-Hinshelwood Model (I) 243
6.4 Langmuir-Hinshelwood Model (II) 250
6.5 Langmuir-Hinshelwood Model (III) 253
6.6 Discussion and Conclusions 254
7. Microstructured Falling Film Reactor: Asymmetric Hydrogenation 260
7.1 Asymmetric Transfer Hydrogenation 260
7.2 Experimental Set-up 262
7.3 Acetone Evaporation 262
7.4 Catalyst Preparation 264
7.5 Experimental Procedure 264
7.5.1 Procedure I (P I) 265
7.5.2 Procedure II (P2) 267
7.8 Conclusions 271
8. Microreactor Design Algorithm 272
8.1 Reactor Design 272
8.2 Reactor Fabrication 275
8.3 Reactor Characterisation 277
8.4 Reactor Testing 277
8.5 Improving Throughput 278
8.6 Conclusions 279
9. Conclusions and Future Work 280
Appendices
Appendix 3-1: Appendix 3-2: Appendix 3-3: Appendix 3-4: Appendix 3-5: Appendix 3-6: Appendix 3-7: Appendix 4-1 : Appendix 4-2: Appendix 4-3: Appendix 4-4: Appendix 4-5 : Appendix 4-6: Appendix 4-7: Appendix 4-8: Appendix 4-9: Appendix 4-10: Appendix 4-11: Appendix 6-1: Appendix 6-2: Appendix 6-3: Appendix 6-4: Appendix 7-1: Appendix 7-2:
Estimation o f First Order Reaction Kinetics for Methanol Oxidation Calculations for the Pre-Heat Channels
Mask Design for the Basic T-Microreactor M ask Design for the T-Microreactor
Empirical Etch Rate Chart for KOH Etching Schematic o f the Reactor Rig
Schematic o f the Second Reactor Rig Estimation o f Reactant Concentration
Analysis Recipe for the Rtx-5 Capillary Column Calibration Data for the Rtx-5 Capillary Column
GC traces and MS spectrograms o f side products for the SPl catalyst Analysis Recipe for the Rtx-5 Capillary Column (Comparison Analysis o f Side Products)
Raman Spectroscopy Analysis o f the UV-decomposed Palladium Acetate Catalyst
Analysis Recipe for the PTA-5 Capillary Column Calibration Method for the PTA-5 Capillary Column
Method o f Correcting Nitrobenzene Conversion for Deactivation Calculation o f the Weisz-Prater Criterion
Calculations for Surface Coverage by Carbon/Organic Deposits Estimation o f the Diffusivity o f Gases in Low Viscosity Liquids Estimation o f the Diffusivity o f Liquids in Liquids
gPROMS Program
Optimisation o f Knb and Kh2 for Model (I)
List of Figures
Figure 2.1 Photolithography and the etching process 16
Figure 2.2 Example o f a micromixer utilising the multilamination concept 36 Figure 2.3 Example o f a interdigital micromixer utilising the multilamination
concept 36
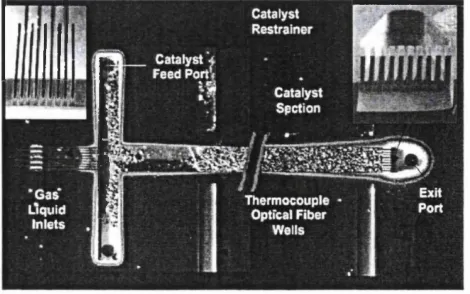
Figure 2.4 Laminated micro-combustor/reactor for hydrogen production 62 Figure 2.5 Gas-liquid micro-packed bed with catalyst restrainer 64
Figure 3.1 Schematic o f the T-reactor 75
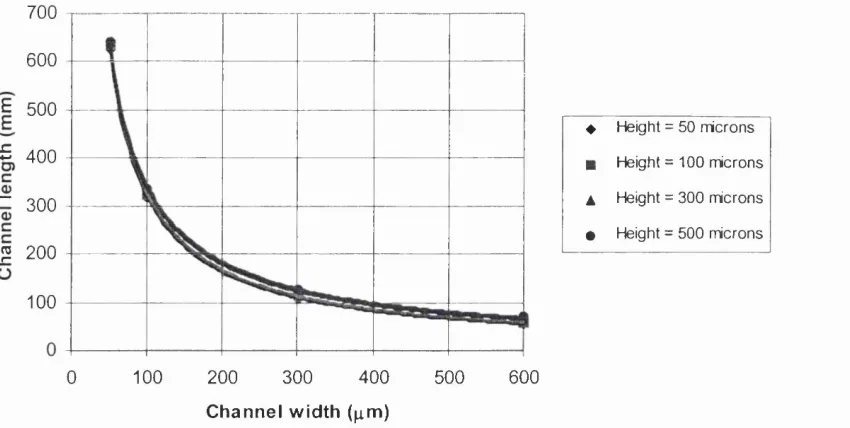
Figure 3.2 Relationship between channel length, width and height (methanol
flowrate 24.4 mg/min) 82
Figure 3.3 Relationship between pressure drop, width and height (methanol
flowrate 24.4 mg/min) 82
Figure 3.4 Schematic o f the reactor 83
Figure 3.5 Channel dimensions o f the basic test reactor 86
Figure 3.6 Baffle designs in the microchannels 87
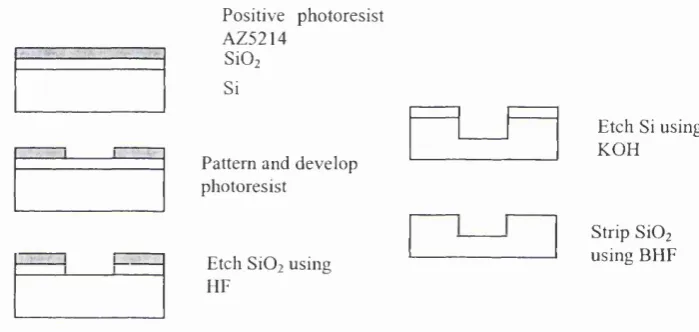
Figure 3.7 Summary o f the fabrication procedure using HF 88 Figure 3.8 Summary o f the fabrication procedure using dry etching 89 Figure 3.9 Sketch o f the resulting baffles in Case 3 (not to scale) 91 Figure 3.10 Estimation o f the etch rate o f 20 wt % KOH at 74 °C 92
Figure 3.11 Graph o f etch depth against temperature 95
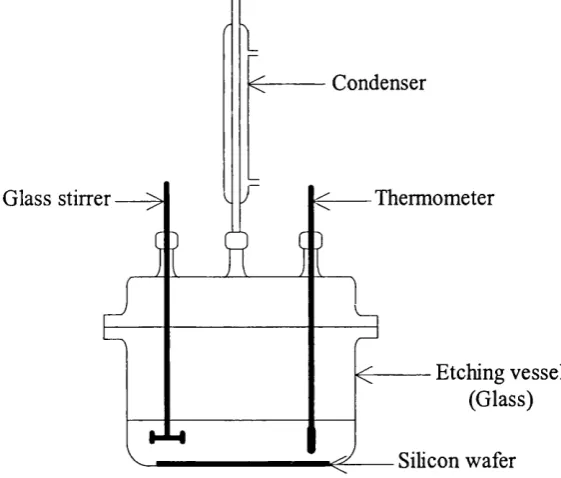
Figure 3.12 Etching vessel used at UCL 99
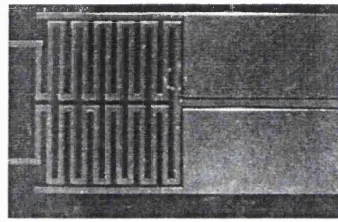
Figure 3.13 T-microreactor fabricated via anisotropic wet etching 100
Figure 3.14 Close-up view o f DRIE reactor 102
Figure 3.15 T-microreactor sealed using anodic bonding 108
Figure 3.16 Schematic o f the experimental set-up 124
Figure 3.17 Heating block 126
Figure 3.18 Temperature profile o f heating block 126
Figure 3.19 Schematic o f the reactor block assembly 127
Figure 3.20 Assembled reactor and housing 132
Figure 4.1 Falling film plate 141
Figure 4.2 Components and schematic o f the microstructured falling film
reactor 142
Figure 4.3 Assembled falling film reactor 143
Figure 4.4 Theoretical liquid film thickness and residence time at various
flowrates 144
Figure 4.5 Reaction scheme for nitrobenzene hydrogenation to aniline times 153
Figure 4.6 Schematic o f the experimental set-up 157
Figure 4.7 Nitrobenzene conversion as a function o f flowrate at various temperatures for the sputtered palladium catalyst
(1 mol NB/1, 4 bar) 162
Figure 4.8 Falling film reactor plate after oxidisation 163 Figure 4.9 Nitrobenzene conversion as a function o f time for the sputtered
palladium catalyst (0.4 mol NB/1, 60 °C, 4 bar, 0.2 ml/min) 165 Figure 4.10 Aniline selectivity as a function o f time for the sputtered
Figure 4.12 Chromatogram fornitrosobenzene 171
Figure 4.13 Chromatogram for N-ethylaniline 171
Figure 4.14 Chromatogram for 4-aminophenol 171
Figure 4.15 Chromatogram for 1,3-dinitrobenzene 171
Figure 4.16 Chromatogram for azobenzene 171
Figure 4.17 Chromatogram for hydrazobenzene 172
Figure 4.18 Chromatogram for the mixture o f compounds 172
Figure 4.19 Chromatogram for the reaction product 172
Figure 4.20 Chromatogram for the reaction product after 3 days 172 Figure 4.21 Nitrobenzene conversion and aniline selectivity as a function o f
time for the UV-decomposed palladium acetate catalyst
(0.04 mol NB/1, 60 °C, 4 bar, 0.2 ml/min) 176
Figure 4.22 SEM image o f UV-deposited palladium plate (magnification: 5Ox) 178 Figure 4.23 SEM image o f UV-deposited palladium plate (magnification: SOOx) 178 Figure 4.24 Chromatogram for the reaction product using the PTA-5 column 179 Figure 4.25 Nitrobenzene conversion as a function o f time for the sputtered
palladium catalyst SP2 (0.04 mol NB/1, 60 °C, 4 bar, 0.35 ml/min) 180 Figure 4.26 Nitrobenzene conversion as a function o f time for the sputtered
palladium catalyst SP2, after regeneration (0.04 mol NB/1, 60 °C,
4 bar, 0.35 ml/min) 180
Figure 4.27 Optical microscope image o f unused sputtered palladium plate SP2
(magnification 160x) 181
Figure 4.28 Image o f sputtered palladium plate after reaction
(confocal microscope, 200x) 181
Figure 4.29 Optical microscope image o f flaking sputtered palladium plate SP2 181 Figure 4.30 Nitrobenzene conversion and aniline selectivity as a function o f
time for the impregnated palladium catalyst IPl
(0.04 mol NB/1, 60 °C, 4 bar, 0.35 ml/min) 183
Figure 4.31 Nitrobenzene conversion as a function o f flowrate at various pressures for the impregnated palladium catalyst IPl
(0.04 mol NB/1, 60 °C) 184
Figure 4.32 Nitrobenzene conversion as a ftmction o f flowrate at various pressures for the impregnated palladium catalyst IPl
(0.04 mol NB/1, 70 °C) 184
Figure 4.33 Nitrobenzene conversion as a function o f time for the impregnated palladium catalyst after different reactivation procedures (0.04 mol NB/1, 60 °C, 1 bar, 0.35 ml/min):
IP l A - dichloromethane wash and oxidation (note: 4 bar pressure used for first 3.5 h), IP IB - dichloromethane wash, EPIC -
dichloromethane wash, IP 1D - oxidation 186
Figure 4.34 Nitrobenzene conversion as a function o f time for the impregnated palladium catalyst after baking
(IPIE, 0.05 mol NB/1, 60 °C, 1 bar, 0.5 ml/min) 188 Figure 4.35 Nitrobenzene conversion as a function o f time for the
impregnated palladium catalyst after baking
(IPIF, 0.1 mol NB/1, 60 °C, 1 bar, 0.5 ml/min) 188 Figure 4.36 Nitrobenzene conversion as a function o f time for the
impregnated palladium catalyst, base case results during
Figure 4.37 Nitrobenzene conversion as a function o f flowrate at various pressures for the impregnated palladium catalyst
(IPIH, 0.1 mol NB/1, 60 °C) 190
Figure 4.38 Nitrobenzene conversion as a function o f pressure at various flowrates for the impregnated palladium catalyst
(IPIH, 0.1 mol NB/1, 60 °C) 191
Figure 4.39 Aniline selectivity as a function o f time for the impregnated palladium catalyst, base case results during parametric studies
(IPIH, 0.1 mol NB/1, 60 °C, 1 bar, 0.5 ml/min) 191 Figure 4.40 Aniline selectivity as a function o f flowrate at various pressures
(IPIH ) for the impregnated palladium catalyst, base case results during parametric studies (IPIH , 0.1 mol NB/1, 60 °C, 1 bar,
0.5 ml/min) 192
Figure 4.41 Nitrobenzene conversion and aniline selectivity as a function o f time for the incipient wetness catalyst IW l
(0.1 mol NB/1, 60 °C, 1 bar, 0.5 ml/min) 194
Figure 4.42 Nitrobenzene conversion as a function o f flowrate at various pressures for the incipient wetness catalyst IW l
(0.1 mol NB/1, 60 °C) 195
Figure 4.43 Nitrobenzene conversion as a function o f flowrate at various pressures for the incipient wetness catalyst IW l
(0.1 mol NB/1, 70 °C) 195
Figure 4.44 Aniline selectivity as a function o f flowrate at various pressures
for the incipient wetness catalyst IW l (0.1 mol NB/1, 60 °C) 196 Figure 4.45 Aniline selectivity as a function o f pressure at various flowrates
for the incipient wetness catalyst IW l (0.1 mol NB/1, 60 °C) 196 Figure 4.46 Aniline selectivity as a function o f flowrate at various pressures
for the incipient wetness catalyst IW l (0.1 mol NB/1, 70 °C) 196 Figure 4.47 Aniline selectivity as a function o f pressure at various flowrates
for the incipient wetness catalyst IW l (0.1 mol NB/1, 70 °C) 196 Figure 4.48 EDX analysis o f IW l plate after reactivation to remove
carbonaceous particles, (a) map view, (b) alumina content,
(c) palladium content, (d) iron content. M agnification 180x 201 Figure 4.49 EDX analysis o f IW l plate after reactivation to remove
carbonaceous particles, (a) map view, (b) alumina content,
(c) palladium content, (d) iron content. M agnification 270x 202 Figure 4.48 Nitrobenzene conversion and aniline selectivity as a function
o f time for the impregnated palladium catalyst IP2
(0.1 mol NB/1, 60 °C, 1 bar, 0.5 ml/min) 203
Figure 4.49 Nitrobenzene conversion as a ftmction o f time for the impregnated palladium catalyst IP2, after reduction
(EP2C, 0.1 mol NB/1, 60 °C, 1 bar, 0.5 ml/min) 204 Figure 4.50 Nitrobenzene conversion as a function o f time for the
impregnated palladium catalyst IP2, after reduction (IP2D,
0.1 mol NB/1, 60 °C, 1 bar, 0.5 ml/min) (note: parametric studies
performed after 6.5 h) 205
Figure 4.51 Nitrobenzene conversion as a function o f flowrate at various pressures for the impregnated palladium catalyst IP2, after
Figure 4.52 Comparison o f nitrobenzene conversion as a function o f time for the incipient wetness catalysts IW 1 and IW2
(0.1 mol NB/1, 60 °C, 1 bar, 0.5 ml/min) 207 Figure 4.53 Comparison o f aniline selectivity as a function o f time for the
incipient wetness catalysts IW l and IW2
(0.1 mol NB/1, 60 °C, 1 bar, 0.5 ml/min) 207
Figure 4.54 Nitrobenzene conversion as a function o f flowrate at various pressures for the incipient wetness catalyst IW2
(0.1 mol NB/1, 60 °C) 208
Figure 4.55 Aniline selectivity as a function o f flowrate at various pressures
for the incipient wetness catalyst IW2 (0.1 mol NB/1, 60 °C) 208 Figure 4.56 Aniline selectivity as a function o f pressures at various flowrate
for the incipient wetness catalyst IW2 (0.1 mol NB/1, 60 °C) 209 Figure 4.57 Nitrobenzene conversion and aniline selectivity as a function o f
time for the incipient wetness catalyst IW2
(1 mol NB/1, 60 °C, 1 bar, 0.5 ml/min) 209
Figure 4.58 Comparison o f catalyst life 212
Figure 4.59 Comparison o f catalyst selectivity 213
Figure 4.60 Selectivity o f the UV catalyst 213
Figure 4.61 Nitrobenzene conversion as a function o f liquid film thickness at various pressures for the incipient wetness catalyst IW l
(0.1 mol NB/1, 60 °C) 218
Figure 4.62 Nitrobenzene conversion as a function o f residence time at various pressures for the incipient wetness catalyst IW l
(0.1 mol NB/1, 60 °C) 219
Figure 4.63 Nitrobenzene conversion as a function o f Reynolds number at various pressures for the incipient wetness catalyst IW l
(0.1 mol NB/1, 60 °C) 219
Figure 4.64 Nitrobenzene conversion as a function o f Reynolds number and hydrogen pressure for the incipient wetness catalyst IW l
(0.1 mol NB/1, 60 °C) 220
Figure 5.1 Principle o f the confocal microscope 223
Figure 5.2 Confocal microscopy images o f the UV-decomposed palladium acetate catalyst plate, a) Visual view from above b) View using
analysis software (channel depth 100 pm, width 300 pm) 224 Figure 5.3 Confocal microscopy images o f the tilted catalyst plate (bottom o f
image is tilted up), a) Visual view from above b) View using
analysis software 225
Figure 5.4 Confocal microscopy images o f the catalyst plate with a thin film
o f water 225
Figure 5.5 Software processed confocal microscopy images o f the catalyst plate a) with a thin film o f water b) after drying out. Colour code (highest to lowest): white, brown, yellow, green, dark blue,
light blue 226
Figure 5.6 Confocal microscope image o f water on stainless steel plate (magnification 40x). Yellow line on right figure depicts height
data o f the liquid film in the middle channel (bottom to top) 227 Figure 5.7 Confocal microscope image o f dry stainless steel plate
Figure 5.8 Resulting image from the subtraction o f dry plate from wet plate.
Colour code (highest to lowest): brown, yellow, green. 228 Figure 5.9 Resulting image from the subtraction o f dry plate from wet plate,
wireframe figure on right. Colour code (highest to lowest): brown,
yellow, green 228
Figure 5.10 Microscope stage with a horizontal focusing mechanism (to and away from the confocal beam) controlled using a screw
micrometer (for depth measurements), and a secondary horizontal axis o f motion perpendicular to the confocal beam 230 Figure 5.11 Average liquid film thickness profile across a channel at various
flowrates 231
Figure 5.12 Temperature profile o f the falling film plate at 30 °C 233 Figure 5.13 Temperature profile o f the falling film plate at 40 °C 233 Figure 5.14 Temperature profile o f the falling film plate at 50 °C 233 Figure 5.15 Temperature profile o f the falling film plate at 60 °C 234
Figure 6.1 Geometry o f the model 237
Figure 6.2 Extrapolation o f liquid film thicknesses at different flowrates 243 Figure 6.3 Base case comparison o f model with experimental results
(Langmuir-Hinselwood (I), laminar flow, k = 0.0021, Knb = T72,
Kh2 = 0.3) 244
Figure 6.4 Base case comparison o f model with experimental results (Langmuir-Hinselwood (I), plug flow, k = 0.013, Kn b = 1.72,
Kh2 = 0.3) 244
Figure 6.5 Effect o f varying Kh2 (Langmuir-Hinselwood (I), laminar flow,
Kn b = 1.72, 1 bar) 245
Figure 6.6 Effect o f varying Kh2 (Langmuir-Hinselwood (I), laminar flow,
Knb = 1.72, 4 bar) 245
Figure 6.7 Effect o f varying Kh2 (Langmuir-Hinselwood (I), laminar flow,
Kn b = 1.72, 6 bar) 246
Figure 6.8 Final comparison o f model with experimental results
(Langmuir-Hinselwood (I), laminar flow, k = 0.0042, Knb = 0.01, Kh2 = 1) 248 Figure 6.9 Final comparison o f model with experimental results
(Langmuir-Hinselwood (I), plug flow, k = 0.02, Knb = 0.01, Kh2 = 1) 248 Figure 6.10 Comparison o f laminar and plug flow using first order reaction
kinetics (r = kCA) 249
Figure 6.11 Comparison o f laminar and plug flow using zero order reaction
kinetics (r = k) 249
Figure 6.12 Comparison o f laminar and plug flow wall hydrogen concentration using first and zero order kinetics (2 ml/min flowrate) 250 Figure 6.13 Effect o f varying Kh2 at 1 bar (Langmuir-Hinselwood (H), laminar
flow, Knb = 0.01) 251
Figure 6.14 Effect o f varying Kh2 at 4 bar (Langmuir-Hinselwood (II), laminar
flow, Knb = 0.01) 251
Figure 6.15 Effect o f varying Kh2 at 6 bar (Langmuir-Hinselwood (II), laminar
flow, Knb = 0.01) 252
Figure 6.16 Final comparison o f model with experimental results
(Langmuir-Hinselwood (n), laminar flow, k = 0.036, Knb = 0.01, Kh2 = 0.3) 252 Figure 6.17 Final comparison o f model with experimental results
Figure 6.18 Final comparison o f model with experimental results (Langmuir- Hinselwood (in), laminar flow, k = 0.00034, Knb = 0.01,
Kh2 = 1 5 ) 254
Figure 6.19 Final comparison o f model with experimental results (Langmuir- Hinselwood (HI), laminar flow, k = 0.0012, Knb = 0.01,
Kh2 = 1 5 ) 254
Figure 6.20 Comparison o f all models with experimental results (1 bar) 255 Figure 6.21 Comparison o f all models with experimental results (4 bar) 255 Figure 6.22 Comparison o f all models with experimental results (6 bar) 255 Figure 6.23 Comparison o f model (I) with experimental results, matched to
the experimental value at 0.5 ml/min and 6 bar (laminar flow,
k = 0.00305, Kn b = 0.01, Kh2 = 1) 256
Figure 6.24 Comparison o f model (H) with experimental results, matched to the experimental value at 0.5 ml/min and 6 bar (laminar flow,
k = 0.02, Kn b = 0.01, Kh2 = 0.3) 256
Figure 6.25 Comparison o f model (lU) with experimental results, matched to the experimental value at 0.5 mFmin and 6 bar (laminar flow,
k = 0.00024, Kn b = 0.01, Kh2 = 15) 257
Figure 7.1 Schematic o f the experimental set-up 262
Figure 7.2 Acetone evaporation as a function o f nitrogen flowrate at various
liquid flowrates 263
Figure 7.3 Acetone evaporation as a function o f liquid flowrate at various
nitrogen flowrates 263
Figure 7.4 Conversion and selectivity as a function o f total reaction time (PI A, flask temperature 0 °C, reactor temperature 30 °C, liquid
flowrate 0.5 mPmin, nitrogen flowrate 50 ml/min) 265 Figure 7.5 Conversion and selectivity as a function o f total reaction time for
the second experiment (FIB, flask temperature 0 °C, reactor temperature 30 °C, liquid flowrate 0.5 ml/min, nitrogen
flowrate 50 mFmin) 266
Figure 7.6 Conversion and selectivity as a function o f total reaction time for the third experiment (PIC , flask temperature 0 °C, reactor temperature 30 °C, liquid flowrate 0.5 mPmin, nitrogen
flowrate 150 ml/min) 267
Figure 7.7 Conversion and selectivity as a function o f total reaction time (P2A, flask temperature 0 °C, reactor temperature 30 °C, liquid
flowrate 0.5 ml/min, nitrogen flowrate 150 ml/min) 268
List of Tables
Table 1.1 Table 2.1 Table 3.1 Table 3.2 Table 3.3 Table 3.4 Table 3.5 Table 3.6 Table 3.7 Table 3.8 Table 3.9 Table 4.1 Table 4.2 Table 4.3 Table 4.4 Table 4.5 Table 4.6 Table 4.7 Table 4.8 Table 4.9 Table 4.10 Table 4.11 Table 4.12 Table 4.13 Table 5.1 Table 5.2 Table 6.1 Table 6.2 Table 6.3 Table 7.1 Table 7.2
Surface area to volume ratio
Comparison o f isotropic and anisotropic etchants
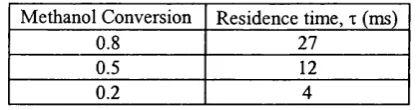
Calculation data for the estimation o f reaction kinetics for methanol oxidation
Residence times to achieve a range conversions for methanol oxidation
Results o f the second attempt at microfabrication Effect o f KOH concentration on etching
Effect o f temperature on etching Effects o f agitation speed on etching
Effect o f etch depth on smoothness o f channel surface Electroplating experiments
Results o f silver mirror experiment
Selected types o f hydrogenation reactions and the preferred catalysts
Comparison o f reactor sizes for processing 11360 1/day o f DNB Enthalpies o f hydrogenation for selected organic functional group Effect o f catalyst, solvent and operating conditions on the
hydrogenation product o f nitrobenzene
Minimum flowrates before dryout at various temperatures at 4 bar Falling film calculation parameters
Operating conditions for deactivation experiments Detected compounds in the GCMS
W eisz-Prater calculations for the reaction system
Comparison o f diffusion time for hydrogen across the liquid film and the residence time in the reactor
Experimental conditions for the various catalysts
Discrepancy between carbon moles entering and leaving the reactor for the various catalysts
Time required for the formation o f a monolayer
Comparison o f measured and calculated liquid film thickness at various flowrates
Maximum, minimum and average plate temperature at various water bath temperatures
Parameters used in the reactor model
Effect o f the number o f points used on nitrobenzene conversion and modelling time (Langmuir-Hinselwood (I), laminar flow, k = 0.0021, Knb = 1.72, Kh2 = 0.3, 1 bar, 0.5 ml/min)
Calculated liquid film thicknesses
Conversion and selectivity in reproducibility experiments (P2D, flask temperature 0 °C, reactor temperature 30 °C, liquid
flowrate 0.5 ml/min, nitrogen flowrate 150)
Conversion and selectivity in deactivation experiments (P2N, flask temperature 30 °C, reactor temperature 30 °C, liquid flowrate 0.5 ml/min, nitrogen flowrate 150 ml/min)
Nomenclature
a A Cq
c CaC a ( 0 )
Cas Cf Cp D DeA Da Dh F fc G g h h H h hvap k K k Kh2 Knb k\v L 1 m M M n
NBact
NBexp
Nu p channel widthcross-sectional area for flow peak area o f compound I channel height
channel width concentration
dimensionless concentration y-intercept on a straight line concentration o f reactant a initial concentration o f reactant a
concentration o f A at the surface o f the catalyst friction factor in a pipe
specific heat capacity o f reactant molecular diffusivity
effective diffusivity o f A Damkohler number Hydraulic diameter feed flowrate
convective boiling factor
mass flowrate o f inlet liquid per unit area o f flow gravitational acceleration
distance between plates, liquid film thickness heat transfer coefficient
Henry’s Law constant thickness o f catalyst layer latent heat o f vaporisation thermal conductivity o f reactant
absolute response factor o f compound i first order reaction rate constant
adsorption coefficient for hydrogen adsorption coefficient for nitrobenzene channel wall thermal conductivity total length
thickness o f catalyst layer channel length
characteristic length over which diffusion takes place gradient o f a straight line
mass flowrate o f reactant relative molecular mass number o f channels
corrected nitrobenzene conversion experimental conversion Nusselt number pressure perimeter m m^ m m mol/m' mol/m^ mol/m^ mol/m^
J/k g K m^/s m^/s
m mVmin
kg/m^ s
m^/s
m
wW k
atm m^/mol m
J/kg W /m K s'^
m^/mol mVmol
W /m K
Pc critical pressure Pe Peclet number Pr Prandtl number, Q rate o f beat transfer Q total feed flowrate q beat flux
r channel radius
R dimensionless distance R ideal gas eonstant R reaction rate
Rstd standard reaction rate rA rate o f reaction Re Reynolds number
rw wall beat transfer resistance S selectivity
T absolute temperature t contact time
T time onstream Tc critical temperature Tr relative temperature tw cbannel wall thickness
U average velocity between plates overall beat transfer coefficient u linear velocity
Uz liquid flow velocity in z direction V volumetric flowrate
Va specific volume o f A
Vb molar volume o f B at boiling point Vc critical volume
VmiB molar volume o f B at melting point W weight o f active catalyst
Wv weight o f catalyst per reactor volume X dimensionless distance
conversion
X distance from the lower wall fraction o f vapour
Xtt Lockbart-Martinelli two pbase-flow parameter z distance along the direction o f flow
distance from the inlet Zra experimental parameter
bar
W cm^/min W/m^ m
mol/g cat min mol/g cat min mol/kg cat s m ^K /W K s b K m m/s W/m^K m/s m/s m^/s cm^/mol cm^ cm^ cm^ g g/cm“ m m m
G reek symbols
p parameter accounting for hydrogen bonding o f the solvent 5 liquid film thickness
AP pressure drop
AT change in temperature o f reactant 8i dimensionless diffusion
Es void fraction Es void fraction 0 Thiele modulus
(|)B association factor for B
Yg friction surface tension parameter
Yig gas-liquid surface tension N/m
r\ dimensionless distance
X dimensionless distance la concentration decay constant
jj, liquid viscosity Pa s, cP
0 contact angle
0 dimensionless concentration
p density kg/m^
p s density o f catalyst kg cat/m^ cat
a stoichiometric coefficient
surface tension N/m
T Residence time s
tortuosity
Td Diffusion time s
Ç dimensionless distance
Subscripts
AN subscript denoting aniline g subscript denoting gas H2 subscript denoting hydrogen
i subscript denoting nitrobenzene, hydrogen and aniline L subscript denoting liquid
1. Introduction
Environment and economics; these are the major concerns in Chemical Engineering today. Processes need to make increasingly more product and profit using less and less resources and cash expenditure to be economically viable. At the same time, environmental laws get more stringent each year. Generally, being environmentally friendly requires processes to operate at less extreme conditions. However, this often leads to a decrease in reaction rate. While this is likely to reduce the amount o f by products, fuel and heat, a corresponding decrease in production is likely to occur. As such, these two factors are usually in opposition.
Enter the microreactor - reactors in the size range o f several centimetres in length and thickness. Using techniques originally developed in the microchip manufacturing industry and refinements in general workshop equipment, they are now readily realisable. Once commercialised, these reactors will become affordable, mirroring the integrated circuit industry where the economies o f mass production allow low cost manufacturing.
Another reason is lack o f expertise. Producing these systems requires knowledge o f micro fabrication, which is used in manufacturing small, electronic components. Chemical engineers in general tend to concentrate on bulk chemical manufacture and bulk structural characteristics o f materials. More importantly, there is the thought that bigger, centralised production centres minimise waste, pollution and costs. In addition, the thought o f the difficulties involved in developing a knowledge-base in an entirely different field o f expertise may have imposed a barrier that was difficult to surmount.
However, in the last decade, the gap between the two realms has been bridged. Microfabrication technology has now become accessible enough to be taken advantage of. The development o f microfluidic devices can now be performed in microfabrication foundries/research centres. Alternatively, some microfabrication technology is cheap enough to be set-up in research laboratories. In addition, conventional bulk machining methods (i.e. the traditional workshop toolkit) have been refined to the stage where they can be used on the sub-millimetre level. Together, these factors have resulted in a burst o f research determined to put microchemical systems into general use.
undesirable amounts o f by-products.
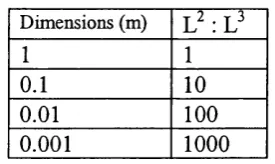
With channels one or more orders smaller in magnitude, the ratio o f surface area (L^) to volume (L^) increases dramatically, leading to more efficient heat and mass transfer. As such control is better and quicker, which leads to less by products. Using microreactors could see an increase in production, profits and a decrease in pollution.
Dimensions (m) L ^ :L ^
1 1
0 .1 10
0 .0 1 1 0 0
0 .0 0 1 1 0 0 0
Table 1.1: Surface area to volume ratio
Other improvements microreactors can bring include:
a) improved safety due to the smaller amount o f reaction material used and the quicker response time o f control measures. In addition, the dimensions o f the systems prevent the propagation o f flames thus causing them to act as natural flame traps.
b) the ability to exploit previously unfeasible reaction routes due to safety restrictions and/or operational limitations.
c) shorter lag time between R&D and actual production. Production volumes can be increased by increasing the number o f systems working in parallel.
proving to be the largest stumbling block affecting microchemical systems. As such, much work is being done to further understanding in these areas.
2. Literature Survey
In order to design and fabricate microreactors, research was carried out on the topic o f microfabrication to determine the most suitable methods. With microreactors being such a new field, there was no on-hand expertise. Therefore, a comprehensive survey o f literature relating to microfluidic systems (covering characteristics, fabrication, applications and modelling) was carried out.
2.1 Characteristics of Microfluidic Systems
Microsystems behave differently from macrosystems because surface area-dependent effects are dominant. A brief review o f the most important differences follows.
2.1.1 Surface Tension
At sub-millimetre scales, surface tension is important and can render the flow characteristics independent o f the channel configuration with respect to gravity. Brauner and Moalem-Maron (1992) suggested that surface tension would be dominant when the tube diameter D satisfied the following correlation:
{ It iY (7
{P:-pl)D'g
> 1where a = surface tension
Pi = density (subscripts g and 1 denoting gas and liquid respectively) g = gravitational acceleration
and
where r = channel radius
Yig = gas-liquid surface tension Yg = friction surface tension parameter 0 = contact angle
When the bubble is within the tube, the pressure drops at both interfaces cancel out. However, when there is a change in channel radius, the net resulting force creates a blocking pressure. It was found that the pressure required to discharge a bubble from a 1 pm capillary tube filled with water was about 1.4 bar (Matsumoto, et al, 1990, Gravesen, et al, 1993). As such, surfaces with good wetting properties should be used to promote flow. W hen pumping is required, channels should not be made too small. On the other hand, capillary forces will fill even small channels (Soderkvist, 1997).
2.1.2 Fluid Flow
The growing body o f work in this area shows that the application o f conventional approaches to fluidics can be rather much a case o f hit-or-miss. While general predictions tend to hold true, a more specific understanding o f the fluid mechanics at the microscale is required.
2.1.2.1 Single phase Flow
factor in tubes is 64/Re while in non-circular channels the value o f the friction factor will depend on the geometric characteristics. Often the friction coefficient (f*Re), which is independent o f the Reynolds number for a given channel geometry, is used for comparisons
laminar gas flow in very smooth circular tubes (diameter 3-81 p,m) found that (f^Re) was constant but below 64.
Apart from the friction factors, the Re where transition from laminar to turbulent flow occurs was also different in microchannels. Peng, et al (1994) reported that the transition Re decreased with decreasing channel hydraulic diameter because instabilities could spread faster in small channels than in large scale systems. Contrary to this, Stanley et al (1997) found that when the channel size was reduced, the transition from laminar to turbulent flow appeared at higher Re for gas flows while for water flows turbulence did not appear even for Re up to 10000. W u and Little (1983) observed reduced transitional Re for the rougher glass channels they used, which decreased as the channel roughness increased.
Another phenomenon that can become significant in microchannel flow is the appearance o f an electrical double layer (EDL) which is established between a liquid containing ions and a charged solid surface. When a polar liquid flows in a channel with charged walls, then due to the EDL a streaming potential and a flow opposite to the main flow direction is established (Adamson & Gast, 1997). In small channels, this results in higher apparent viscosity and friction factor (electroviscous effect). Even small amounts o f ions can result in the formation o f an EDL. In fact when the ionic concentration is low, EDL thickness becomes large (for pure water and oils it can be as large as several microns) and has a greater effect on the flow (Mala, et al,
1997). The presence o f an EDL, however, would only justify the appearance o f higher friction factors than those expected from traditional theory.
2.1.2.2 Two-phase Flow
0.05-0.29 mm by Hessel, et al (2000). Xu, et al (1999) presented results in channels with depths as small as 0.3 mm, and found differences between the smallest channels and the ones with diameters above 0.6 mm: no bubble flow appeared in the smallest channels, while during slug flow isolated drops were seen to adhere to the tube wall surface.
Bums and Ramshaw (1999) presented flow patterns during the flow o f two immiscible liquids in microchannels. They found that the two phases flow, in most cases, in separate layers but contrary to what would be expected, the lighter oil phase flowed beneath the denser aqueous phase, under the influence o f surface tension forces. Using different distributors to mix the two liquids, they observed slug flow patterns with slug lengths depending on the geometry o f the distributor (Bums and Ramshaw, 2000).
decreased with channel hydraulic diameter but did not become zero at 1/Eo > 0.297 (where Eo is the Eotvos number) as was found for circular channels.
2.1.2.3 Fluid delivery
A m ajor problem with the pumping o f liquids is that the channel sizes tend to preclude the use o f fouling, viscous and/or particulate fluids as they may cause blockages, operational difficulties and damage in microsystems with moving parts, such as pumps and valves. Liquid flow can be driven by conventional or micropumps. But, the former can be difficult to interface with microstructures while the latter have poor back-pressure and result in leakage (Freemantle, 1999). This has led to alternative methods, such as electro-osmotic flow (EOF). An electrical double layer is formed by ions in the fluid and surface charges immobilised on the channel walls. Applying an electric field causes the solution to move towards an electrode (Freemantle, 1999). This only works in small channels (< 500 pm), though studies have demonstrated that EOF can be used in larger channels filled with silica frits (Haswell, 1999, Christenson, 1999).
A new wetting phenomenon was reported at the Max Planck Institute o f Colloids and Interfaces. Stripes were patterned on hydrophobic substrates to form liquid channels. Channel volume increased with liquid volume until a critical volume where a single bulge formed. This channel remains stable as long as its volume is small. Bulges preferentially form at the comers and if formed close-by can merge into a bridge, which can be used to mix liquids or even to react compounds. A whole network o f such channels could be formed. (Freemantle, 1999, Gau, 1999).
2.1.3 Thermal Characteristics
Microsystems have high heat fluxes (100 W/cm^) and convective heat transfer coefficients (up to 54000 W/m^ °C in liquid-liquid systems, 350000 W/m^ °C for boiling conditions and 1000 W/m^ °C in gases) (Brandner, et al, 1999, Wegeng, et al,
1996, Chopey, et al, 1997).
Microreactors solve most o f these problems. With their heat transfer characteristics, heat removal/input is quick, allowing exothermic reactions to be carried out without risk o f thermal runaway and safer operation at high temperatures. Heat transfer in endothermie reactors becomes more efficient. Isothermal operation is also possible while temperature-sensitive reactions will benefit greatly. Previously unworkable reaction routes with very large heat generation and/or spontaneous ignition may also be exploited. This is due to rapid heat removal and/or the flame trap dimensions o f the channels (Paratte, et al, 1997). Rapid heat removal also gives rise to rapid quench rates. Reactions can be halted very quickly at the end o f the desired reaction period, which can improve selectivity, purity and production.
However, the increased surface area to volume ratio m ay also result in increased loss o f heat to the surroundings. Also, at this size, the recovery o f useful heat may prove inefficient. Also important are temperature gradients. While usually equalised very quickly in microstructures, they are very sensitive to them. Sudden or even prolonged heating at elevated temperatures may result in buckling (or crumpling) o f structures (Srinivasan, et al, 1997).
2.1.4 Structural Characteristics
Microreactors have the potential to enhance catalytic reactions. W ith thinner boundary layers and therefore more effective molecular diffusion, mass transfer limited catalytic reactions should be enhanced. Porous silicon or aluminium structures can be made by anodisation in which pore size and depth are controlled by current density and time (Drott, et al, 1997, Laurell, 1997). This allows greater loading o f catalyst, thus improving yields. Structures with micropores running throughout the entire structure, such as concrete and zeolites, can also be utilised as micro-component separation units. This is because the size o f the pores can be controlled to a certain extent. As such, they can be used to separate molecules by size.
Many microsystems are made on thin substrates, allowing sheets containing different operations to be stacked into an integrated reaction system. The eventual aim would be to fabricate production units which could fit on a table, in a car, handheld dispenser or even into a biomedical system within the human body. This will allow distributed manufacturing and point-of-use production o f harmful chemicals or chemicals required in small amounts. Also, by manufacturing self-contained stacks, the capacity o f a plant can be increased by “plugging in” as many stacks as required. Failed stacks can also be replaced easily. This will bring economic and maintenance advantages.
reactors has not been realised yet as they require a line o f thought which may be different from that o f conventional macro-scale reactor design.
2.2 Fabrication Methods
The advent o f microreaction technology was initially underpinned by silicon microfabrication methods originally developed by the microelectronics industry. However, as new or improved precision engineering methods and tools became available, they were utilised as well. These are the enabling technologies that form the cornerstones o f microreaction technology. They allow the manufacture o f micro engineered structures from metals, ceramics, silicon, glass and plastics.
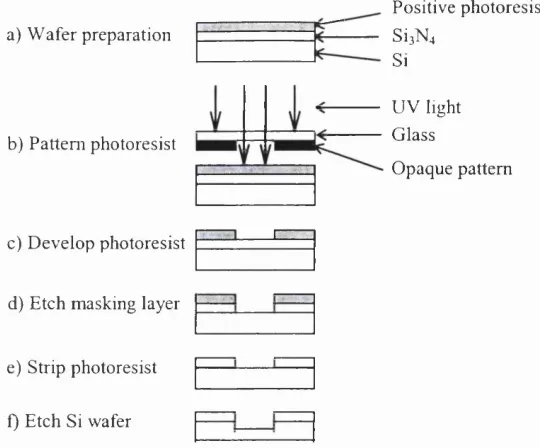
2.2.1 Photolithography and Etching Techniques
a) W afer preparation
b) Pattem photoresist
c) D ev elo p photoresist
d) Etch m asking layer
e) Strip photoresist
f) Etch Si wafer
P ositive photoresist
S Î 3 N 4
Si
U V light G lass
O paque pattem
] [
Figure 2.1: P hotolithography and the etching process
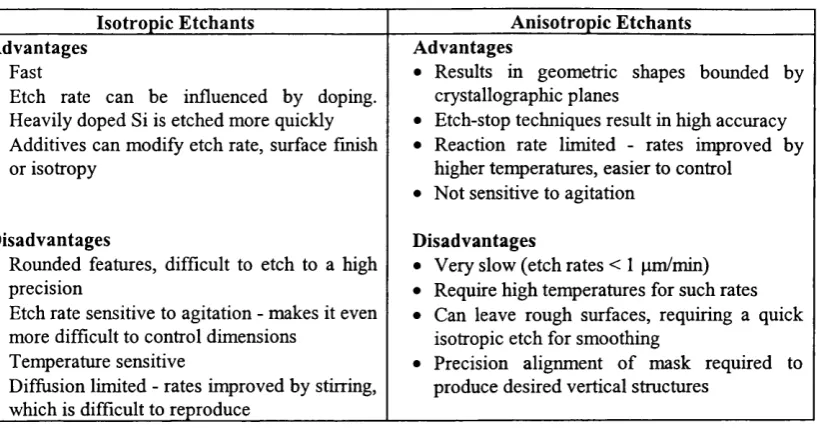
Isotropic Etchants Anisotropic Etchants Advantages
• Fast
• Etch rate can be influenced by doping. Heavily doped Si is etched more quickly • Additives can modify etch rate, surface finish
or isotropy
Disadvantages
• Rounded features, difficult to etch to a high precision
• Etch rate sensitive to agitation - makes it even more difficult to control dimensions
• Temperature sensitive
• Diffusion limited - rates improved by stirring, which is difficult to reproduce______________
Advantages
• Results in geometric shapes bounded by crystallographic planes
• Etch-stop techniques result in high accuracy • Reaction rate limited - rates improved by
higher tenqieratures, easier to control • Not sensitive to agitation
Disadvantages
• Very slow (etch rates < 1 pm/min) • Require high temperatures for such rates • Can leave rough surfaces, requiring a quick
isotropic etch for smoothing
• Precision alignment o f mask required to produce desired vertical structures
Table 2.1: Comparison o f isotropic and anisotropic etchants
Dry etching comprises o f plasma- or discharged-based techniques. They carry out accurate etching at very small dimensions and have good vertical and lateral etching control irrespective o f crystallographic orientation or substrate. This causes less undereutting and broadening o f photoresist features. Pattem transfer is good and the resulting surfaces are cleaner. The various methods used are (Rangelow, et al, 1997, Jansen, et al, 1996):
i) chemical plasma etching - involves little ion bombardment and is mostly chemical etching. Most often used for resist stripping and where high selectivity is required. ii) reactive ion etching - characterised by low plasma potentials (10-50 V) leading to
small sputter contamination. However, there are difficulties in controlling the process (temperature, flux o f species, etc.) giving rise to a lack in consistency. iii) ion beam etching - plasma is sputtered on to the substrate surface at low pressure
Fluorine-based gases are usually used in isotropic etching while chlorine-based, bromine-based and mixed molecule gases are used for anisotropic etching. Oxygen- based plasmas are used for polymer etching (Jansen, 1996). Recently, a Deep Reactive Ion Etching (DRIE) process was developed which utilised a fluorine-based system in conjunction with passivation to achieve structures with large aspect ratios (Thomell and Johansson, 1998). These processes are all very sensitive to various parameters. For example, temperature has a very strong effect and is one o f the major causes o f inconsistency. Small amounts o f contaminants can drastically affect the final product by reacting with the target or by changing the plasma chemistry. As such, while versatile and useful, some difficulties are involved.
Combinations o f dry and wet etching techniques can allow fabrication o f difficult-to- make structures, such as circular silicon nitride tubes buried in silicon (Gardeniers, et al, 1999).
2.2.2 Chemical Vapour Deposition (CVD)
i) Atmospheric Pressure CVD (APCVD) - This process is most often used to produce epitaxial films. It is mass transfer controlled. The reactor walls have to be cooled to prevent impurity problems resulting from deposition on the walls. ii) Low Pressure CVD (LPCVD) - The most important process, it allows large
numbers o f wafers to be coated simultaneously w ith uniform films. Due to the low pressures involved, growth rate is limited by the rate o f surface reactions, which are temperature-sensitive. High temperatures necessitate frequent cleaning o f the reactor walls to avoid contamination.
iii) Very Low Pressure CVD (VLPCVD) - These processes are used to produce epitaxial films at relatively low temperatures.
iv) Metallorganic CVD (MOCVD) - Hydrides or organo-metallics are used in these processes, which are the most important in the production o f epitaxial layers. This is due to the fact that the thickness o f the deposited film can be controlled to within one atomic layer.
v) Plasma-Enhanced CVD (PECVD) - Energy is transferred to reacting gases using a plasma, subjecting the substrate to lower temperatures than in APCVD and LPCVD. Dry etching equipment can be used for this process as well. The quality o f deposited films is lower than that o f the higher temperature LPCVD process, but as more variables are available for manipulation, the film properties desired for certain applications can be more readily made.
2.2.3 LIGA
LIGA is a German acronym for lithography, electrodeposition and moulding. In this method, X-rays are used to perform photolithography on thick resist. After development, the gaps between the remaining resist are filled by electroplating. The resist is then removed to leave a metal mould insert for injection or reaction moulding (Thomell and Johansson, 1998, Madou, 1997). The use o f highly coherent X-rays results in submicron resolution and large aspect ratios (-1000).
The substrate has to be conductive or coated in a conducting layer for electroplating. It must also be sufficiently adhesive to the resist. Steel, titanium, nickel and copper have been used. Poly(methylmethacrylate) (PMMA) was the traditional resist o f choice due to its excellent contrast and stability. However, due to its low sensitivity, a new negative resist based on a novolak resin was developed. A large range o f metals, alloys and dispersion composites have been used for electroplating, such as nickel, gold, copper, nickel-cobalt, and nickel-diamond nanoparticles (Ehrfeld, et al, 1999c).
While allowing the fabrication o f high aspect ratio structures, the X-rays required are produced using prohibitively expensive synchrotrons. This inaccessibility has resulted in the development o f LIGA-like processes using UV -photolithography and thick layers o f resist (Thomell and Johansson, 1998). While the resolution and aspect ratios are reduced, these micro stmctures can be fabricated using standard equipment. The widely used SU-8 epoxy based resist can reach a thickness o f 1200 pm (Lorenz, et al,
1997, Loechel, 2000).
2.2.4 Laser Machining
Laser machining can be used for both additive and substractive machining. Used in short pulses, it vaporises the material. At longer pulses or continuous beam, it melts, melding discrete surfaces (Madou, 1997). Even hard materials such as diamond and tungsten can be cut (Bremus, et al, 1999). Aspect ratios (for holes) o f up to 1:50 can be achieved and cutting can be performed even at difficult angles. Lasers are, in fact, the most cost-effective tool for drilling holes 0.01-1.5 mm in diameter.
electrodes and electrical contacts (Pethig, et al, 1998), structure polymers (Bremus, et al, 1999) or even to pattem silicon on oxide or nitride masks instead o f using photoresist in conventional etching (Müllenbom, et al, 1996).
The most common lasers are carbon dioxide lasers and neodymium yttrium aluminium garnet lasers (Nd:YAG). CO2 lasers produce beams in the infra-red region (10.6 pm) while Nd:YAG beams are in the near infra-red region (1.06 pm). The more powerful excimer lasers use rare gas halides and cover the ultraviolet range (157-353 nm). NdiYAG and excimer lasers can be used to drill holes 30-50 pm in diameter. The smallest feature machinable by excimer lasers is about 0.8 pm in thin metal foils.
The main advantage o f laser machining is flexibility. One machine cuts, welds, deposits and melds. It also allows site-specific operation, i.e. specific materials can be deposited at specific locations. Only the site targeted by the beam will heat up due to the short pulses. As such, the surrounding area will be unaffected, leading to little heat stress.
2.2.5 Ultraprecision Machining
PMMA (Friedrich, et al, 1996). Even die forging can be done, though only when applied to superplastic materials (Thomell and Johansson, 1998).
2.2.6 Electrodischarge Machining (EDM)
This method uses a controlled electric discharge between an electrode and a conductive substrate to erode the substrate. The electrode and substrate are immersed in a dielectric medium, with a gap (-25 pm) between them. Upon applying a voltage (-8 0 V), intense sparking (up to 500,000 s’’) occurs across the gap generating a localised temperature o f 12,000 °C to vaporise the substrate (Madou, 1997; Richter, et al, 1997, Dario, et al, 1995). Metal removal rates range from 0.001 to 0.1 cm^/hr depending on conductivity and melting temperature. Increasing spark frequency reduces surface roughness and tolerances o f up to 5 pm can be achieved. Shaped- electrodes fabricated using LIGA allow more complicated geometries to be produced (Ehrfeld, et al, 1999c). EDM has also been used in conjunction with photolithography to produce stmctures without the use o f the conventional glass mask (Reynaerts, et al,
2000).
2.2.7 Soft Lithography
with poly(dimethylsiloxane) (PDMS). Other elastomers which have been used include polyurethanes, polyimides and crosslinked Novo lac resin (Xia and Whitesides 1998, Duffy et al, 1998, Jackman et al, 1998). Oxidising the surface o f PDMS with plasma converts -0Si(CH3)20- groups to OnSi(OH)4_n. Bringing together two such surfaces creates a covalent siloxane bond and results in irreversible bonding. Other surfaces which can be bonded in this way include glass, silicon, silicon oxide, silicon nitride, quartz, polyethylene, polystyrene and glassy carbon (Duffy et al, 1998). Alternatively, harder plastics such as polymethylmethacrylate (PMMA) have been used with imprinting methods. A piece o f PMMA is clamped to the template (one example used a length o f wire) and heated to its softening temperature. Upon cooling and separation, the desired pattem is left behind (Martynova, et al, 1997). Since developed SU-8 is an inert substance, it can be a suitable reactor material. Jackman, et al (2000) formed multi-layered structures with different patterns on each layer using multiple spin-coatings o f SU-8 and exposures.
2.2.8 Glass Microfabrication
1998). Photoetchable glass, e.g. Foturan, is also available. The glass is exposed to UV-light through a mask, forming silver in exposed areas. Heat treatment (500-600 °C) results in crystallisation around the silver. Wet etching is then performed using a 10% HF solution. The crystalline regions etch 20 times faster than the unexposed regions. The smallest structure which can be made using Foturan is about 25 pm in size (Freitag, et al, 2000).
2.2.9 Microstereolithography
This is an additive method for manufacture o f plastic components, based on solidification o f a liquid under illumination. The basic principle involves the focusing o f a beam o f UV-light onto the surface o f a light sensitive liquid, which polymerises upon exposure. A three-dimensional model o f the object is first drawn and then sliced into horizontal two-dimensional pieces (Madou, 1997, Mougin, et al, 1998, Knitter, et al, 2000). These layers are then developed in the liquid using either the photomask method or the scanning method. The photomask method involves transferring each layer on to a mask and then exposing the liquid to each mask in sequence. The more commonly used scanning method uses a computer-controlled laser, which scans each layer according to a CAD programme. The size o f the minimum solidification unit (voxel) is 5 X 5 X 3 pm (Thomell and Johansson, 1998; Dario, et al, 1995). The main
advantage o f this method is that it allows quick production o f complex three- dimensional stmctures, and hence is deemed a rapid prototyping method.
2.2.10 M ass fabrication techniques
depth are required. However, the precision that is achievable with these methods make them suitable for making masters for use in more conventional mass-replication techniques. For example, as mentioned previously injection moulding can be used in the final stage o f the LIGA process. Apart from LIGA, it can also employ masters made through ultraprecision machining, EDM and laser machining, amongst others (Ehrfeld, et al, 2000, Niggemann, et al, 1999, Hessel, et al, 1997). While most moulding is done using plastics, processes using ceramics have also been developed (Knitter, et al, 1999, 2000). Another method is embossing, which has been performed on ceramics, aluminium and stainless steel (Ehrfeld, et al, 2000, Knitter, et al, 1998, Hessel, et al, 1997). By keeping the embossing tool at high temperature, hot embossing o f polymers can be realised (Becker, et al, 2000)
2.2.11 Bonding Techniques
While the process is, it does have some shortcomings. Wafers have to be cleaned and polished before the procedure. And, most importantly, the temperatures used are quite high, making it unsuitable for many materials as mismatching thermal expansion coefficients will result in mechanical stress. The process is, therefore, restricted to certain combinations o f materials. Silicon and Coming 7740 Pyrex glass are most frequently used (Madou, 1997, Schomburg, et al, 1995). Two silicon layers can be bonded by sputtering a layer o f glass 3 pm thick between them. GaAs can also be bonded to Coming 0211 (Madou, 1997). However, poor bonding due to poorly adhering oxides necessitates pre-baking the glass first.