A neural network method for prediction of
β
-turn types in proteins using evolutionary
information
Harpreet Kaur and G. P. S. Raghava
∗Institute of Microbial Technology, Sector-39A, Chandigarh, India
Received on March 9, 2004; revised and accepted on April 29, 2004 Advance Access publication May 14, 2004
ABSTRACT
Motivation: The prediction ofβ-turns is an important element of protein secondary structure prediction. Recently, a highly accurate neural network based method Betatpred2 has been
developed for predicting β-turns in proteins using
position-specific scoring matrices (PSSM) generated by PSI-BLAST and secondary structure information predicted by PSIPRED. However, the major limitation of Betatpred2 is that it predicts
onlyβ-turn and non-β-turn residues and does not provide any
information of different β-turn types. Thus, there is a need
to predictβ-turn types using an approach based on multiple
sequence alignment, which will be useful in overall tertiary structure prediction.
Results: In the present work, a method has been developed
for the prediction of β-turn types I, II, IV and VIII. For each
turn type, two consecutive feed-forward back-propagation net-works with a single hidden layer have been used where the first sequence-to-structure network has been trained on single sequences as well as on PSI-BLAST PSSM. The out-put from the first network along with PSIPRED predicted secondary structure has been used as input for the second-level structure-to-structure network. The networks have been trained and tested on a non-homologous dataset of 426 pro-teins chains by 7-fold cross-validation. It has been observed that the prediction performance for each turn type is improved significantly by using multiple sequence alignment. The per-formance has been further improved by using a second level structure-to-structure network and PSIPRED predicted sec-ondary structure information. It has been observed that Type I
and IIβ-turns have better prediction performance than Type IV
and VIIIβ-turns. The final network yields an overall accuracy
of 74.5, 93.5, 67.9 and 96.5% with MCC values of 0.29, 0.29,
0.23 and 0.02 for Type I, II, IV and VIIIβ-turns, respectively,
and is better than random prediction.
Availability: A web server for prediction of β-turn types I, II, IV and VIII based on above approach is available
∗To whom correspondence should be addressed.
at http://www.imtech.res.in/raghava/betaturns/ and http://
bioinformatics.uams.edu/mirror/betaturns/ (mirror site).
Contact: [email protected]
INTRODUCTION
Protein secondary structure prediction is an intermediate step in overall tertiary structure prediction. The secondary struc-ture of a protein consists of helices,β-strands and coil. The coil region in a protein includes tight turns, bulges and ran-dom coil structures (Chou, 2000). Tight turns are believed to be important structural elements involved in molecular recog-nition processes between proteins, in interactions between peptide substrates and receptors, and in protein folding (Rose et al., 1985; Takano et al., 2000). Among tight turns, β -turn is predominant one that plays a vital role in protein folding, stability and recognition and is an important compon-ent ofβ-hairpin structure. On an average,β-turns constitute about 25% of the residues in globular proteins (Kabsch and Sander, 1983). They can be classified into nine different types depending on theφ,ψangles of the two central residues.
The consideration of prediction of tight turns can enhance the usefulness of secondary structure prediction methods. Interestingly, in past, methods have been developed for predic-tion of tight turns based on statistical approaches, Sequence-coupled model, neural networks and support vector machine (Chou, 1997a; Kaur and Raghava, 2002a, 2003a,b,c; Chou and Blinn, 1997; Shepherd et al., 1999). Among these, a number of methods are available for prediction of β-turns (Kaur and Raghava, 2002a, 2003a; Chou and Blinn, 1997; Shepherd et al., 1999; Chou, 1997b; Zhang and Chou, 1997; Cai et al., 2002; Lin et al., 2002). To provide an adequate ranking, an extensive evaluation of all the existingβ-turn pre-diction methods has also been carried out on a uniform dataset of 426 non-homologous protein chains (Kaur and Raghava, 2002b). Recently, we have described a method, Betatpred2 (http://www.imtech.res.in/raghava/betatpred2/) for β-turn prediction, which uses the multiple sequence alignment for prediction (Kaur and Raghava, 2003a). The method has the highest prediction accuracy among all the existing methods.
by guest on April 23, 2011
bioinformatics.oxfordjournals.org
However, the major limitation of Betatpred2 method is that it predicts whether a residue is in β-turn or not and does not differentiate between different β-turn types. Based on
β-turn/non-turn knowledge, we cannot assign theφ,values to residues if we try to build up a complete three-dimensional structure for a given primary sequence. This means that we need to predict differentβ-turn types so that it will be useful in assigning theφ, angles to a residue corresponding to the predictedβ-turn type. Thus, it is important to develop a method, which can predict differentβ-turn types with high accuracy.
The method, ‘Betaturns’ proposed in this paper is aimed at prediction of different types ofβ-turns. The method is based on artificial neural network (ANN) trained on position-specific scoring matrices (PSSMs) obtained from PSI-BLAST. The ANN has been trained separately for each β-turn type on a non-homologous dataset of 426 protein chains. We have focused mainly on prediction ofβ-turn types I, II, IV and VIII. The remaining turn types I, II, VIa1, VIa2 and VIb are very few and are not enough for a reliable prediction. For instance, the number of turn types I, II, VIa1, VIa2 and VIb present in the dataset are only 304, 165, 44, 17 and 70 respect-ively out of total 7153 β-turns. Thus, these turn types have been combined into one set, called NS (non-specific) turn type. For each β-turn type, two networks have been used consecutively—the first ‘sequence-to-structure’ network trained on PSSM and the second ‘structure-to-structure’ net-work trained on output obtained from first netnet-work and PSIPRED predicted secondary structure states. The method Betaturns based on this approach is available as web server at http://www.imtech.res.in/raghava/betaturns/
MATERIALS AND METHODS
The dataset
In the present study, the dataset is comprising of 426 non-homologous protein chains as described by Guruprasad and Rajkumar (2000). In this dataset, no two protein chains have
>25% sequence identity. The structure of these proteins is determined by X-ray crystallography at≤2.0 Å resolution. Each chain contains at minimum oneβ-turn.
Assignment of
β
-turns
The PROMOTIF (Hutchinson and Thronton, 1996) program has been used to assignβ-turn types in proteins. It uses the
β-turn types classification scheme proposed by Hutchinson and Thornton (1994) which categorizes β-turns into nine types: I, II, I, II, IV, VIa1, VIa2, VIb and VIII based on
φandangles of two central residues (Table 1).
7-fold cross validation
A prediction method is often developed by cross-validation or jack-knife method (Rost and Sander, 1993). The present method involves PSI-BLAST to generate position specific
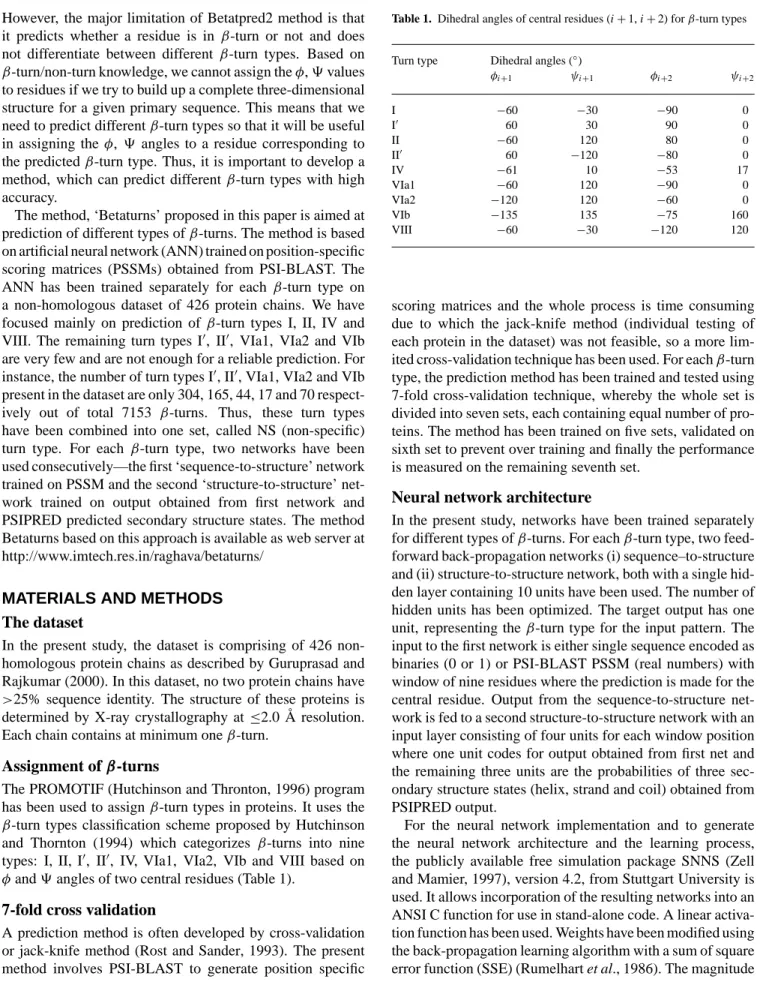
Table 1. Dihedral angles of central residues (i+1,i+2) forβ-turn types
Turn type Dihedral angles (◦)
φi+1 ψi+1 φi+2 ψi+2 I −60 −30 −90 0 I 60 30 90 0 II −60 120 80 0 II 60 −120 −80 0 IV −61 10 −53 17 VIa1 −60 120 −90 0 VIa2 −120 120 −60 0 VIb −135 135 −75 160 VIII −60 −30 −120 120
scoring matrices and the whole process is time consuming due to which the jack-knife method (individual testing of each protein in the dataset) was not feasible, so a more lim-ited cross-validation technique has been used. For eachβ-turn type, the prediction method has been trained and tested using 7-fold cross-validation technique, whereby the whole set is divided into seven sets, each containing equal number of pro-teins. The method has been trained on five sets, validated on sixth set to prevent over training and finally the performance is measured on the remaining seventh set.
Neural network architecture
In the present study, networks have been trained separately for different types ofβ-turns. For eachβ-turn type, two feed-forward back-propagation networks (i) sequence–to-structure and (ii) structure-to-structure network, both with a single hid-den layer containing 10 units have been used. The number of hidden units has been optimized. The target output has one unit, representing theβ-turn type for the input pattern. The input to the first network is either single sequence encoded as binaries (0 or 1) or PSI-BLAST PSSM (real numbers) with window of nine residues where the prediction is made for the central residue. Output from the sequence-to-structure net-work is fed to a second structure-to-structure netnet-work with an input layer consisting of four units for each window position where one unit codes for output obtained from first net and the remaining three units are the probabilities of three sec-ondary structure states (helix, strand and coil) obtained from PSIPRED output.
For the neural network implementation and to generate the neural network architecture and the learning process, the publicly available free simulation package SNNS (Zell and Mamier, 1997), version 4.2, from Stuttgart University is used. It allows incorporation of the resulting networks into an ANSI C function for use in stand-alone code. A linear activa-tion funcactiva-tion has been used. Weights have been modified using the back-propagation learning algorithm with a sum of square error function (SSE) (Rumelhart et al., 1986). The magnitude
by guest on April 23, 2011
bioinformatics.oxfordjournals.org
of the error sum in the training and validation set is monitored in each cycle of the training. The ultimate number of cycles is determined where the network converges.
Multiple sequence alignment and secondary
structure
PSIPRED (Jones, 1999) uses PSI-BLAST (Altschul et al., 1997) to detect distant homolog of a query sequence and generate position-specific scoring matrix as part of the pre-diction process, and here we have used these intermediate PSI-BLAST generated position specific scoring matrices as a direct input to the first level network. The matrix has 21×M
elements, whereMis the length of the target sequence, and each element presents the frequency of occurrence of each of the amino acids at one position in the alignment.
PSIPRED method has been used for predicting secondary structure, which gives the reliability indices for all the three secondary structure states (helix, strand and coil) for each residue.
Performance measures
Both threshold dependent and independent measures have been used to assess the performance of the method.
Threshold dependent measures
Five different parameters have been used to measure the per-formance of prediction method. These five parameters can be derived from the four scalar quantities: TPi (true positives: number of correctly classifiedβ-turn typei), TNi(true negat-ives: number of correctly classified non-β-turns), FPi (false positives: number of non-β-turns incorrectly classified as
β-turn typei) and FNi(false negatives: number ofβ-turn type
iincorrectly classified as non-β-turns or some other turn type), wherei =I, II, IV, VIII and NS. Following five parameters have been calculated at different threshold or cutoff values.
(1) Prediction Accuracy(Acci)= [(TPi +TNi)/t]×100, wheret=TPi+TNi+FPi+FNiis the total number of examples includingβ-turn types and non-β-turns. (2) Sensitivity (Sin) = [TPi/(TPi +FNi)] ×100 is the
percentage of observedβ-turn types that are predicted correctly.
(3) Specificity(Sip) = [TNi/(TNi+FPi)] ×100 is the percentage of observed non-β-turns that are predicted correctly.
(4) Probability of correct prediction (PiC): The probabil-ity of correct prediction is the percentage of predicted
β-turn types that are predicted correctly.
PCi = TPi TPi+FPi ×100
(5) Matthews correlation coefficient (MCCi): The com-monly used parameter, prediction accuracy may be misleading due to disparity in the number ofβ-turns
types and non-β-turns; hence, it is possible to achieve high accuracy by predicting all non-β-turn residues as non-β-turns. Thus, there is a need to use more robust measures to evaluate a method. One of the best performance measures that accounts for unbalancing (both over- and under-prediction) is the Matthews cor-relation coefficient (Matthews, 1975). The corcor-relation coefficient is defined as
MCCi=
(TPi)(TNi)−(FPi)(FNi) √
(TPi+FPi)(TPi+FNi)(TNi+FPi)(TNi+FPi) The MCC is a number between−1 and 1. If there is no relationship between the predicted values and the actual values, the correlation coefficient is 0 or very low (the predicted values are no better than random numbers). As the strength of the relationship between the predicted values and actual values increases so does the correla-tion coefficient. A perfect fit gives a coefficient of 1.0. Thus, the higher the correlation coefficient the better is the prediction performance.
Performance with respect to random prediction
Another useful approach is to compare the accuracy of pre-dictions with respect to prepre-dictions generated by random. Here, we have calculated the total number of residues that are expected to be predicted correctly by randomly generated predictions. The requisite formula is
Ritotal= (TPi+FPi)(TPi+FNi)+(TNi+FPi)(TNi+FNi) t
To measure how well a method is performing compared with random (Ritotal), the normalized percentage better than random (Si) has been calculated for eachβ-turn type.
Si =
(TPi+TNi)−Rtotali
t−Ritotal ×100
Perfect predictions score Si =100%, predictions that are no better than random score Si =0% (Shepherd et al., 1999).
Threshold independent measures
The performance measures described so far are threshold dependent. One problem with the threshold dependent meas-ures is that they measure the performance at a given threshold. They fail to use all the information provided by a method. For instance, the false positive rate varies with the threshold value. Thus, the receiver operating characteristic (ROC), a trade off between sensitivity and specificity and which is a threshold independent measure has been used to assess the performance. For a prediction method, ROC plot is obtained by plotting all sensitivity values (true positive rate) on they-axis against their equivalent (1−specificity) values (false positive rate) for all available thresholds on the x-axis. The curve always goes through two points (0,0 and 1,1). 0,0 is where the classifier finds no positives. In this case, it always gets the negative cases
by guest on April 23, 2011
bioinformatics.oxfordjournals.org
right but it gets all positive cases wrong. The second point is 1,1 where everything is classified as positive. So the classi-fier gets all positive cases right but it gets all negative cases wrong. A classifier that randomly guesses has ROC which lies somewhere along the diagonal line connecting 0,0 and 1,1. An important index of ROC curve is its area. A random classifier has an area of 0.5, while an ideal one has an area of 1 (Deleo, 1993).
A measure of statistical significance
When comparing different prediction approaches, we need to know whether the differences in performance measures (prediction accuracies or MCC values) among them are statist-ically significant or not. Statistics theory gives us a method to compute the ‘significance interval’ for the difference between two population proportions (Daniel, 1987).
In this case, the ‘proportion’ is the percentage of cases in test dataset, which have been predicted correctly. If we assume that the prediction accuracies of two algorithms arep1and
p2 for two test datasets of r1 andr2 number of examples, respectively, and the test data are randomly selected, then we can say that we are 100% confident that the two accuracies are really different if
|p1−p2|> I, where I =z 1+a 2 ·p1(1−p1)/r1+p2(1−p2)/r2,
zis the inverse cumulative normal distribution. The larger the difference between two prediction accuracies, the more signi-ficant it is. The above equation (Zhang et al., 1992) has been used to determine whether the difference in the accuracies or other measures is statistically significant or not.
Segment overlap measure (SOV)
The method predicts the β-turn type at residue level. The single-residue predictions do not completely reflect the qual-ity of a prediction. One should take into account the average length of predictedβ-turn type. The SOV is a measure for eval-uation of prediction method by secondary structure segment rather than individual residues. To address the overlapping between the observed and predicted β-turn type residues, SOV (Zemla et al., 1999) has been calculated for eachβ-turn type as: SOVi = 1 N S minov(S1;S2)+δ
maxov(S1;S2) ×len(S1),
whereS1 andS2 are the observed and predictedβ-turn typei; len(S1) is the number of residues in the segmentS1 ofβ-turn typei; minov(S1;S2)is the length of actual overlap ofS1 andS2 or the extent for which both segments have residues inβ-turn typei; maxov(S1;S2)is the length of the total
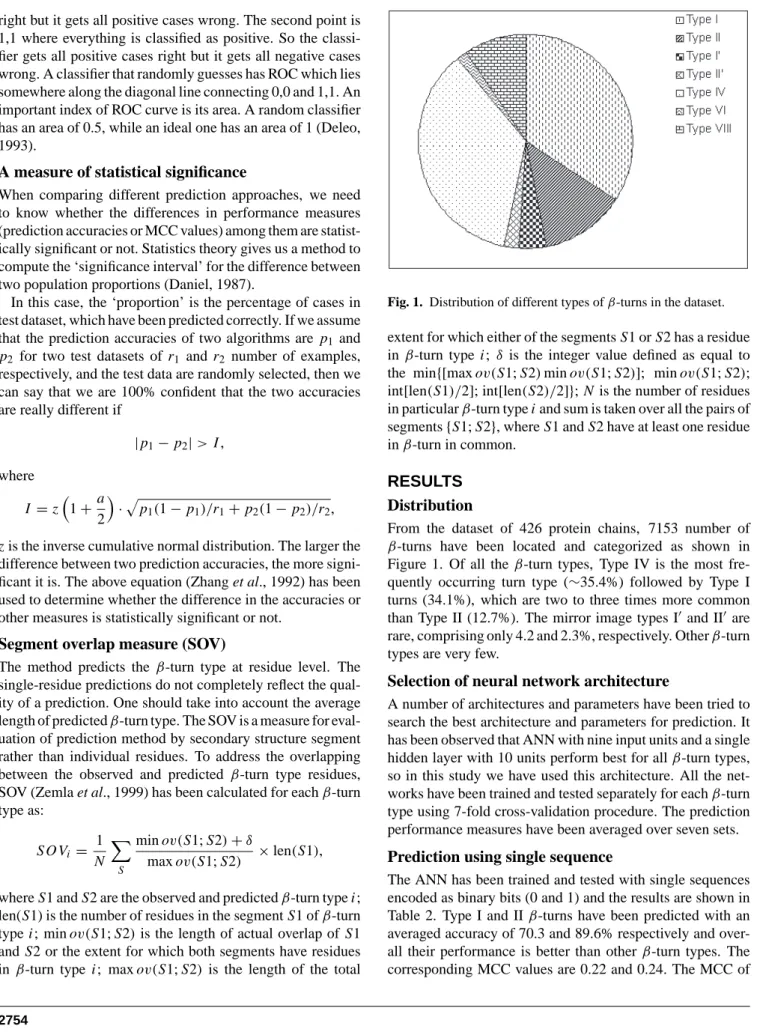
Fig. 1. Distribution of different types ofβ-turns in the dataset.
extent for which either of the segmentsS1 orS2 has a residue inβ-turn type i; δ is the integer value defined as equal to the min{[maxov(S1;S2)minov(S1;S2)]; minov(S1;S2); int[len(S1)/2]; int[len(S2)/2]};N is the number of residues in particularβ-turn typeiand sum is taken over all the pairs of segments{S1;S2}, whereS1 andS2 have at least one residue inβ-turn in common.
RESULTS
Distribution
From the dataset of 426 protein chains, 7153 number of
β-turns have been located and categorized as shown in Figure 1. Of all theβ-turn types, Type IV is the most fre-quently occurring turn type (∼35.4%) followed by Type I turns (34.1%), which are two to three times more common than Type II (12.7%). The mirror image types I and II are rare, comprising only 4.2 and 2.3%, respectively. Otherβ-turn types are very few.
Selection of neural network architecture
A number of architectures and parameters have been tried to search the best architecture and parameters for prediction. It has been observed that ANN with nine input units and a single hidden layer with 10 units perform best for allβ-turn types, so in this study we have used this architecture. All the net-works have been trained and tested separately for eachβ-turn type using 7-fold cross-validation procedure. The prediction performance measures have been averaged over seven sets.
Prediction using single sequence
The ANN has been trained and tested with single sequences encoded as binary bits (0 and 1) and the results are shown in Table 2. Type I and IIβ-turns have been predicted with an averaged accuracy of 70.3 and 89.6% respectively and over-all their performance is better than otherβ-turn types. The corresponding MCC values are 0.22 and 0.24. The MCC of
by guest on April 23, 2011
bioinformatics.oxfordjournals.org
Table 2. The results ofβ-turn types predictions by using single sequence with and without secondary structure information
Results of present study BTPRED resultsa(Shepherd et al., 1999)
β-turn types β-turn types
I II IV VIII NS I II IV VIII Accuracy 70.3 89.6 64.3 96.4 97.8 91.2 95.5 95.7 96.8 (72.7)b (92.0) (65.4) (96.8) (98.2) Sensitivity 64.7 46.6 60.8 2.1 4.8 46.6 58.4 18.0 2.2 (65.3) (48.5) (62.4) (1.3) (4.4) Specificity 70.8 91.3 64.7 99.1 99.2 (73.6) (94.1) (65.7) (99.5) (99.7)
Probability of correct prediction 18.7 17.8 15.6 7.0 8.3 13.9 12.2 3.3 9.3
(20.1) (21.0) (16.2) (8.9) (9.7)
MCC 0.22 0.24 0.16 0.02 0.05 0.219 0.253 0.062 0.033
(0.24) (0.25) (0.17) (0.02) (0.09)
Better-than-random 16.9 21.3 11.1 1.8 4.9 18.1 18.9 4.5 2.6
(19.1) (23.2) (12.4) (1.4) (6.1)
aPrediction results of BTPRED with predicted secondary structure.
bValues in parentheses are prediction results obtained using PSIPRED predicted secondary structure.
Type IIβ-turn is higher than Type Iβ-turn, however, the sens-itivity of former is 20% lower than that of latter. The prediction of both Types I and IIβ-turns has been found to be 17 and 21% better than random prediction. The prediction performance of Type IVβ-turn is less than Type I and IIβ-turns, however, is better than VIII and NSβ-turns. Approximately 61% of Type IVβ-turn has been predicted correctly with MCC of 0.16. The prediction of Type IVβ-turn has been found to be 11% better than random. Among allβ-turn types, Type VIII and NSβ-turns show the least performance. Type VIIIβ-turn has MCC of 0.02 and is only 2% better than random. Its sensitivity and probability of correct prediction is<10%. The prediction of non-specificβ-turns is 5% better than random with MCC of 0.05.
Prediction using single sequence and secondary
structure
The outputs obtained from the first network along with the PSIPRED predicted secondary structure information has been used as input for structure-to-structure network. The res-ults averaged over seven sets are presented in parentheses in Table 2. Improvement with secondary structure informa-tion can be seen for allβ-turn types. There is a gain of 1–2% in accuracy and sensitivity of all β-turn types. For Type I and IIβ-turns, MCC is raised from 0.22 to 0.24 and 0.24 to 0.25 respectively. Their prediction is found to be 20 and 23% better than random. There is a marginal improvement for Type VIIIβ-turn after using secondary structure information. We have obtained final MCC values of 0.24, 0.26, 0.17, 0.03 and 0.08 forβ-turn types I, II, IV, VIII and NS respectively. Moreover, the results are also better than BTPRED (Table 2). The MCC values and better-than-random scores are higher than that obtained with BTPRED except for Type II and VIII
β-turns for which both BTPRED and present work shows comparable performance.
Prediction using multiple alignment
To further enhance the prediction performance, the multiple sequence alignment (MSA) in the form of PSI-BLAST PSSM has been used as input to ANN. The results are shown in Table 3. The prediction accuracy of allβ-turn types increases by 2–3% except for Type VIII and NS β-turns. The max-imum improvement in sensitivity has been obtained for NS
β-turn type followed by Type IIβ-turn. For Type I and II
β-turns, nearly 65 and 50% of turns have been predicted cor-rectly. There is no change in sensitivity of Type IV and VIII
β-turns even after using MSA. The final probability of cor-rect prediction of Type I and IIβ-turns is 20.8 and 21.8% which are respectively 2 and 4% higher than that obtained with sequence alone. Moreover, the improvement has found to be statistically significant at 95% confidence level. The final MCC values achieved are 0.25, 0.26, 0.18, 0.02 and 0.13 for
β-turn types I, II, IV, VIII and NS respectively and are 1–8% higher than with single sequence. The performance of allβ -turn types has been found to be better than random prediction with Type I and IIβ-turns better-than-random score being 20 and 27% respectively.
Prediction using multiple alignment and secondary
structure
An output obtained from first network (trained on PSI-BLAST PSSM) and secondary structure predicted by PSIPRED is applied to the second network. The results are shown in Table 3. Using secondary structure along with MSA has res-ulted in a significant increase of 9 and 11% in sensitivities of Type I and IVβ-turns with MCC 0.29 and 0.23 respectively.
by guest on April 23, 2011
bioinformatics.oxfordjournals.org
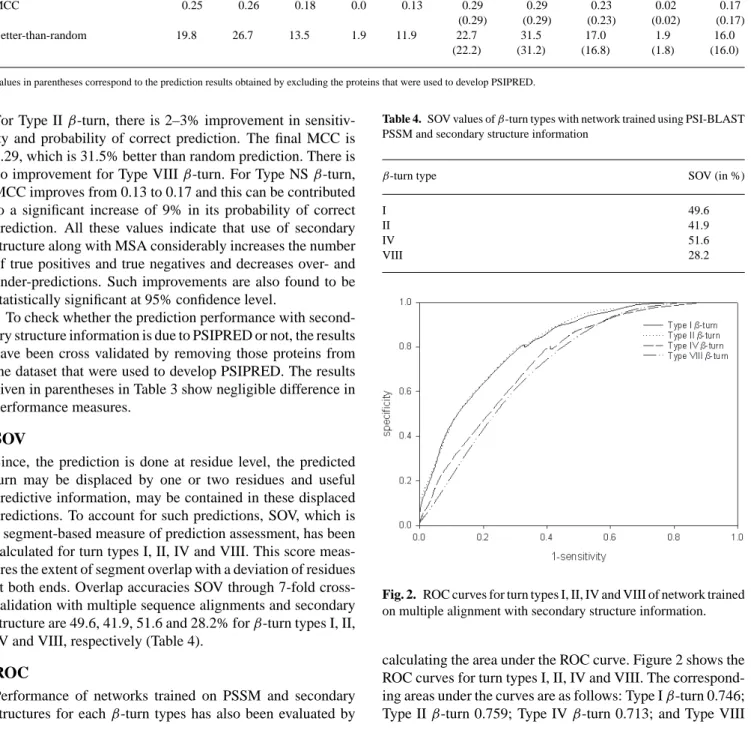
Table 3. Prediction results of network using PSI-BLAST PSSM with and without secondary structure information
Multiple alignment
(Sequence-to-structure network)
Multiple alignment and secondary structure (Structure-to-structure network)
β-turn types β-turn types
I II IV VIII NS I II IV VIII NS Accuracy 72.8 91.9 67.7 96.2 97.8 74.5 93.5 67.9 96.5 98.1 (74.1) (92.6) (67.2) (96.4) (98.0) Sensitivity 65.0 50.2 60.6 2.4 13.2 74.1 52.8 72.0 2.8 13.3 (73.8) (51.9) (71.8) (2.6) (13.3) Specificity 73.7 93.4 68.5 98.9 99.1 75.5 94.8 66.0 98.7 99.4 (74.6) (94.2) (66.0) (98.4) (99.4)
Probability of correct prediction 20.8 21.8 16.9 7.2 15.0 22.1 25.5 18.6 7.2 23.7
(21.7) (25.0) (18.3) (7.0) (23.5)
MCC 0.25 0.26 0.18 0.0 0.13 0.29 0.29 0.23 0.02 0.17
(0.29) (0.29) (0.23) (0.02) (0.17)
Better-than-random 19.8 26.7 13.5 1.9 11.9 22.7 31.5 17.0 1.9 16.0
(22.2) (31.2) (16.8) (1.8) (16.0)
Values in parentheses correspond to the prediction results obtained by excluding the proteins that were used to develop PSIPRED.
For Type IIβ-turn, there is 2–3% improvement in sensitiv-ity and probabilsensitiv-ity of correct prediction. The final MCC is 0.29, which is 31.5% better than random prediction. There is no improvement for Type VIIIβ-turn. For Type NSβ-turn, MCC improves from 0.13 to 0.17 and this can be contributed to a significant increase of 9% in its probability of correct prediction. All these values indicate that use of secondary structure along with MSA considerably increases the number of true positives and true negatives and decreases over- and under-predictions. Such improvements are also found to be statistically significant at 95% confidence level.
To check whether the prediction performance with second-ary structure information is due to PSIPRED or not, the results have been cross validated by removing those proteins from the dataset that were used to develop PSIPRED. The results given in parentheses in Table 3 show negligible difference in performance measures.
SOV
Since, the prediction is done at residue level, the predicted turn may be displaced by one or two residues and useful predictive information, may be contained in these displaced predictions. To account for such predictions, SOV, which is a segment-based measure of prediction assessment, has been calculated for turn types I, II, IV and VIII. This score meas-ures the extent of segment overlap with a deviation of residues at both ends. Overlap accuracies SOV through 7-fold cross-validation with multiple sequence alignments and secondary structure are 49.6, 41.9, 51.6 and 28.2% forβ-turn types I, II, IV and VIII, respectively (Table 4).
ROC
Performance of networks trained on PSSM and secondary structures for eachβ-turn types has also been evaluated by
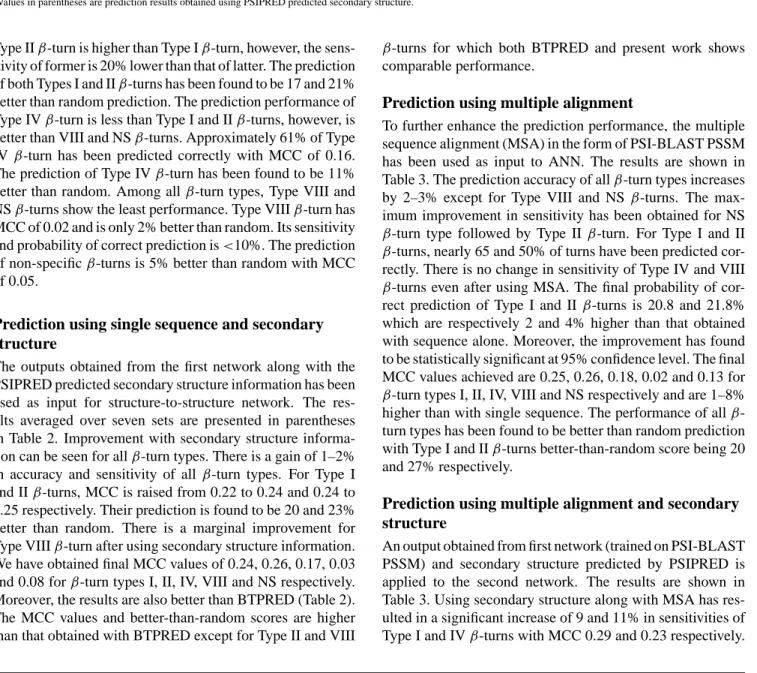
Table 4. SOV values ofβ-turn types with network trained using PSI-BLAST PSSM and secondary structure information
β-turn type SOV (in %)
I 49.6
II 41.9
IV 51.6
VIII 28.2
Fig. 2. ROC curves for turn types I, II, IV and VIII of network trained
on multiple alignment with secondary structure information.
calculating the area under the ROC curve. Figure 2 shows the ROC curves for turn types I, II, IV and VIII. The correspond-ing areas under the curves are as follows: Type Iβ-turn 0.746; Type IIβ-turn 0.759; Type IVβ-turn 0.713; and Type VIII
by guest on April 23, 2011
bioinformatics.oxfordjournals.org
Fig. 3. Sampleβ-turn type predictions. Row 1 is the amino acid sequence; row 2 is the secondary structure states predicted by PSIPRED (H, helix; E, strand; and C, coil) and Row 3 is the pre-dictedβ-turn residues (t,β-turn residues; n, non-β-turn residues). The predictedβ-turn residues are further classified as Types I, II, IV, VIII and non-specific marked by roman numerals I, II, IV VIII and NS, respectively.
β-turn 0.662. These values reflect the better prediction of type I and IIβ-turns in comparison to type IV and VIIIβ-turns.
Comparison with BTPRED
A comparison of present method with BTPRED shows that the results obtained in this work are better than that of BTPRED. In BTPRED study, Shepherd et al. has reported MCC 0.22 and better-than-random score 18% for Type Iβ-turn, which are 7 and 5% less than that achieved in this study. Similarly, the prediction of Type IIβ-turn is 31.5% better than random prediction and is 19% higher than that of BTPRED. Even for Type IVβ-turn, the results obtained in present study are better than BTPRED. However, the performance of Type VIIIβ-turn is inferior to BTPRED.
Web server Betaturns
A web server ‘Betaturns’ (http://www.imtech.res.in/raghava/ betaturns/) has been developed for the prediction of β-turn types I, II, IV, VIII and NS based on neural network and multiple sequence alignment approach. The SNNS generated network for each turn type is converted into C program and is used as an interface.
The output consists of target sequence, PSIPRED predicted secondary structure and predictedβ-turn types such as I, II, IV, VIII and NS. Turn residues are predicted as four residues block with turn types indicated by roman numerals I, II, IV, VIII for turn types I, II, IV and VIII respectively or ‘NS’ for non-specific beta-turn category which does not belong to any of the four turn types. A sample of the prediction output is shown in Figure 3.
DISCUSSION
It is known that using information from sequence alignment significantly improves protein secondary structure predic-tion rather than single sequence. Typically, more diver-gent profiles yield better prediction (Przybylski and Rost, 2002). A neural network based method Betatpred2 (Kaur and Raghava, 2003a) for predictingβ-turns from the amino acid
sequence based on multiple sequence alignment has recently been developed. The better performance of Betatpred2 over BTPRED (Shepherd et al., 1999) has resulted from neural network training on PSI-BLAST generated position specific scoring matrices. For Betatpred2, MCC value increases from 0.31 with single sequence to 0.37 with multiple sequence alignment. Further, by incorporating secondary structure information, the final MCC achieved is 0.43 and is the best achieved so far. However, the method Betatpred2 predicts onlyβ-turn or non-turn residues and does not provide any information ofβ-turn types. In the present work, the approach of multiple sequence alignment and secondary structure has been extended for prediction of different types ofβ-turns and a method betaturns based on such approach has been developed for predictingβ-turn types I, II, IV and VIII.
Two different inputs coding to the network have been used. One is based on single sequence with amino acids as binary bits and the other is multiple sequence alignment in the form of PSI-BLAST generated PSSM. In both the cases, a second ‘structure-to-structure’ network has been trained on second-ary structure obtained from PSIPRED. It has been found that for allβ-turn types, the performance of network with MSA is superior to that of sequence alone. With MSA, Type I and II
β-turns have MCC 0.25 and 0.26, which is 19.8 and 26.7% better than random prediction. The probability of correct pre-diction is low for allβ-turn types. This is due to the fact that in the dataset the number of examples having a particularβ-turn type is far less than the number of negative examples, which results in a large number of false positive predictions and thus a lower probability of correct prediction. Using secondary structure along with MSA improves the performance of allβ -turn types with final MCC of 0.29, 0.29, 0.23, 0.02 and 0.17 for I, II, IV, VIII and NSβ-turns. There is 2–4% improvement in probability of correct prediction except for Type NS, which shows a significant increase of 9%. The performance is 22.7, 31.5, 17, 1.9 and 16% better than random prediction. These results clearly shows the ability of the method to predict Type I and IIβ-turns (MCC∼0.29) and Type VIII (MCC∼0.02) and NS (MCC∼0.17). The results are according to our expect-ations; the more numerous and well-defined β-turn Types I and II are predicted more accurately than the less numerous VIII and NSβ-turns. The performance for Type IVβ-turn is intermediate that of Types I, II and VIII, NSβ-turns. Overall, the performance is better than BTPRED.
To conclude, theβ-turn type prediction method described in this paper yields predictions that are significantly more accurate than previous methods and this improvement can be contributed to the use of multiple sequence alignment and secondary structure information in neural network training.
ACKNOWLEDGEMENTS
The authors are thankful to Council of Scientific and Industrial Research (CSIR) and Department of Biotechnology (DBT),
by guest on April 23, 2011
bioinformatics.oxfordjournals.org
Government of India for financial assistance. We are also thankful to the developers of SNNS and PSIPRED. This report has IMTECH communication No. 012/2003.
REFERENCES
Altschul,S.F., Madden,T.L., Alejandro,A.S., Zhang,J., Zhang,Z., Miller,W. and Lipman,D.J. (1997) Gapped BLAST and PSI-BLAST: a new generation of protein databases and search programs. Nucleic Acids Res., 25, 3389–3402.
Cai,Y.D., Liu,X.J., Xu,X.B. and Chou,K.C. (2002) Support vector machines for the classification and prediction of beta-turn types.
J. Pept. Sci., 8, 297–301.
Chou,K.C. and Blinn,J.R. (1997) Classification and prediction of
β-turn types. J. Protein Chem., 16, 575–595.
Chou,K.C. (1997a) Prediction and classification of α-turn types.
Biopolymers, 42, 837–853.
Chou,K.C. (1997b) Prediction ofβ-turns. J. Pept. Res., 49, 120–144. Chou,K.C. (2000) Prediction of tight turns and their types in proteins.
Anal. Biochem., 286, 1–16.
Daniel,W.W. (1987) Biostatistics: A Foundation for Analysis in the
Health Science. John Wiley & Sons, New York.
Deleo,J.M. (1993) Receiver operating characteristic laboratory (ROCLAB): Software for developing decision strategies that account for uncertainty. In: Proceedings of the Second
Interna-tional Symposium on Uncertainty Modelling and Analysis. IEEE,
Computer Society Press, College Park, MD, pp. 318–325. Guruprasad,K. and Rajkumar,S. (2000)β- andγ-turns in proteins
revisited: a new set of amino acid dependent positional preferences and potential. J. Biosci., 25, 143–156.
Hutchinson,E.G. and Thornton,J.M. (1994) A revised set of poten-tials forβ-turn formation in proteins. Protein Sci., 3, 2207–2216. Hutchinson,E.G. and Thornton,J.M. (1996) PROMOTIF—a pro-gram to identify and analyze structural motifs in proteins. Protein
Sci., 5, 212–220.
Jones,D.T. (1999) Protein secondary structure prediction based on position-specific scoring matrices. J. Mol. Biol., 292, 195–202. Kabsch,W. and Sander,C. (1983) Dictionary of protein secondary
structure: pattern recognition of hydrogen-bonded and geomet-rical features. Biopolymers, 22, 2577–2637.
Kaur,H. and Raghava,G.P.S. (2002a) BetaTPred: prediction of
β-turns in a protein using statistical algorithms. Bioinformatics,
18, 498–499.
Kaur,H. and Raghava,G.P.S. (2002b) An evaluation ofβ-turn pre-diction methods. Bioinformatics, 18, 1508–1514.
Kaur,H. and Raghava,G.P.S. (2003a) Prediction ofβ-turns in proteins from multiple alignment using neural network. Protein Sci., 12, 627–634.
Kaur,H. and Raghava,G.P.S. (2003b) A neural-network-based method for prediction of gamma-turns in proteins from multiple sequence alignment. Protein Sci., 12, 923–929.
Kaur,H. and Raghava,G.P.S. (2003c) Prediction ofα-turns in proteins using PSI-BLAST profiles and secondary structure information.
Proteins, 55, 83–90.
Lin,T.H., Wang,G.M. and Wang,Y.T. (2002) Prediction of beta-turns in proteins using the first-order Markov models. J. Chem. Inf.
Comput. Sci., 42, 123–133.
Matthews,B.W. (1975) Comparison of the predicted and observed secondary structure of T4 phage lysozyme. Biochim. Biophys.
Acta, 405, 442–451.
Przybylski,D. and Rost,B. (2002) Alignments grow, secondary structure prediction improves. Proteins, 46, 197–205.
Rose,G.D., Gierasch,L.M. and Smith,J.A. (1985) Turns in peptides and proteins. Adv. Protein Chem., 37, 100–109.
Rost,B. and Sander,C. (1993) Prediction of protein secondary structure at better than 70% accuracy. J. Mol. Biol., 232, 584–599.
Rumelhart,D.E., Hinton,G.E. and Williams,R.J. (1986) Learning representations by back-propagation errors. Nature, 323, 533. Shepherd,A-J., Gorse,D. and Thornton,J.M. (1999) Prediction of the
location and type ofβ-turn types in proteins using neural networks.
Protein Sci., 8, 1045–1055.
Takano,K., Yamagata,Y. and Yutani,K. (2000) Role of amino acid residues at turns in the conformational stability and folding of human lysozyme. Biochemistry, 39, 8655–8665.
Zell,A. and Mamier,G. (1997) Stuttgart Neural Network Simulator. Version 4.2. University of Stuttgart, Stuttgart, Germany. Zemla,A., Venclovas,C., Fidelis,K. and Rost,B. (1999) A modified
definition of Sov, a segment based measure for protein secondary structure prediction assessment. Proteins, 34, 220–223.
Zhang,C.T. and Chou,K.C. (1997) Prediction ofβ-turns in pro-teins by 1-4 & 2-3 Correlation Model. Biopolymers, 41, 673–702.
Zhang,X., Mesirov,J.P. and Waltz,D.L. (1992) Hybrid system for protein secondary structure prediction. J. Mol. Biol., 225, 1049–1063.
by guest on April 23, 2011
bioinformatics.oxfordjournals.org