Bucknell Digital Commons
Bucknell Digital Commons
Faculty Journal Articles Faculty Scholarship
2019
The top 500 mathematics pins: Analysis of elementary
The top 500 mathematics pins: Analysis of elementary
mathematics activities on Pinterest
mathematics activities on Pinterest
A G. Sawyer
James Madison University Lara Dick
Bucknell University, [email protected] E J. Shapiro
T A. Wismer
Follow this and additional works at: https://digitalcommons.bucknell.edu/fac_journ Part of the Science and Mathematics Education Commons
Recommended Citation Recommended Citation
Sawyer, A G.; Dick, Lara; Shapiro, E J.; and Wismer, T A.. "The top 500 mathematics pins: Analysis of elementary mathematics activities on Pinterest." Journal of Technology and Teacher Education (2019) : 235-263.
This Article is brought to you for free and open access by the Faculty Scholarship at Bucknell Digital Commons. It has been accepted for inclusion in Faculty Journal Articles by an authorized administrator of Bucknell Digital Commons. For more information, please contact [email protected].
The Top 500 Mathematics Pins: An Analysis of
Elementary Mathematics Activities on Pinterest
AMANDA G. SAWYER
James Madison University, USA
LARA K. DICK, EMILY J. SHAPIRO, AND TABITHA WISMER
Bucknell University,USA
[email protected] [email protected] [email protected]
A 2017 study found that 87% of elementary teachers report-ed consulting Pinterest when planning mathematical lessons (Hertel & Wessman-Enzinger, 2017). When searching for resources on Pinterest, preservice teachers identified look-ing at the number of pins to determine their quality (Sawyer & Meyers, 2018). This leaves teacher educators wondering, what is the quality of materials that preservice and inservice teachers are finding on Pinterest? We conducted a document analysis on the top 500 elementary mathematics pins found on Pinterest to determine what kinds of elementary math-ematics materials are available, what mathmath-ematics topics are represented, the level of cognitive demand of the elementary mathematics activities, and how the image found on the ac-tivities relates to the level of cognitive demand. We found that less than two percent of activities are the highest level of cog-nitive demand and decorative images are correlated with low-er level elementary mathematics activities. With this informa-tion, teacher educators could help prepare teachers to decide which resources they should use and what they should look for to increase the level of cognitive demand of elementary mathematics activities they implement in their classroom.
Social media has changed the way teachers find and implement ac-tivities in their classrooms; teachers often search online for acac-tivities rather than finding activities in traditional textbooks (Carpenter, Cassaday & Mon-ti, 2018; Sawyer & Meyers, 2018). Researchers found that one of the most common social media websites that teachers use to search for classroom activities is Pinterest (Hertel & Wessman-Enzinger, 2017; Hunter & Hall, 2018; Sawyer & Meyers, 2018). Yet little is known about the quality of edu-cational activities on Pinterest or other such sites. This paper seeks to begin to address this question about quality by specifically looking at elementary mathematics activities found on Pinterest.
Pinterest (http://pinterest.com), which launched in March 2010, is a free pinboard-style sharing website amassing more than 11 million active users (Hansen, Nowlan, & Winter, 2012). The website identifies itself as a visual discovery engine which allows for inspiration from members’ social bookmarks (Pinterest, 2019). Although it is a search engine, Pinterest also serves as a social media platform (Kerali, 2018). We define social media as internet-based applications that offer individuals or groups the ability to cre-ate profiles designed to offer member supported communication (Obar & Wildma, 2015). Pinterest is a form of social media because it provides an online means of communicating through shared information created from its visual search engine. The website is different from other social media plat-forms such as Facebook because it focuses on identifying other websites or “pinboards” of interest to its users versus displaying information about the members.
Pinterest offers pinboards focusing on makeup, home decor, hair tu-torials, DIY, recipes, workouts, lesson planning, and much more (Pinter-est, 2019). Users select a topic of interest and view the “pins” (i.e. the vi-sual representations of the linked websites relating to the selected topic that were pinned by other members on Pinterest). Pinterest is especially popular with teachers. In 2017, 87% of elementary mathematics teachers reported consulting Pinterest when planning lessons (Hertel & Wessman-Enzinger, 2017). For example, if a teacher searches for lesson ideas for teaching ad-dition, the search engine will show hundreds of pins previously posted by other users; the teacher would see worksheets, activities or tasks, and blogs that focus on addition. When searching for resources on Pinterest, preser-vice teachers identified looking at the number of times a teaching resource
was pinned as a means of determining the quality of the resource (Sawyer & Meyers, 2018). This leaves teacher educators wondering, what is the quality of materials that preservice and inservice teachers are finding on Pinterest?
PURPOSE
As mathematics teacher educators and future elementary school teach-ers, we focus this paper specifically on elementary mathematics. We deter-mined the quality of elementary mathematics tasks found on Pinterest us-ing Smith and Stein’s (1998) Task Analysis Guide framework which defines levels of cognitive demand for mathematics tasks. In an attempt to deter-mine the quality of the most frequently pinned educational tasks, we sought to investigate the top 500 elementary mathematics pins on Pinterest to an-swer the following questions:
1. What kinds of elementary mathematics materials are found on Pinterest?
2. What elementary mathematics topics are represented in the pins? 3. If the pins include mathematics tasks, what is their associated level
of cognitive demand?
4. How does the presence and type of an image(s) found on math-ematics task relate to the level of cognitive demand?
CONCEPTUAL FRAMEWORK
We classify the quality of the elementary mathematics tasks found on Pinterest in terms of their cognitive demand as explicated by Smith and Stein (1998), whose well-respected tool is known as the Task Analy-sis Guide (TAG). TAG describes four levels of cognitive demand for math-ematics tasks: memorization, procedures without connections to concepts or meaning, procedures with connections to concepts and meaning, and doing mathematics (Smith & Stein, 1998). Smith and Stein explain that memoriza-tion and procedures without connecmemoriza-tions relate to a lower-level of cognitive demand, while procedures with connections and doing mathematics relate to a higher-level of cognitive demand.
The lowest level of cognitive demand, memorization, occurs when stu-dents learn material in isolation from other mathematics concepts, typically focusing on speed or rote knowledge. Procedures without connections (the second lowest level of cognitive demand) involves performing arithmetic
processes which requires a higher level of thinking than memorization. De-spite this, Smith and Stein explain that such tasks need little cognitive ef-fort, especially when a memorized algorithm can simply be applied or no explanation is necessary. For procedures without connections, students learn concepts in isolation and often have a difficult time relating them to an un-derlying conceptual meaning. This, in turn, often results in a correct-answer oriented mindset (Smith & Stein, 1998).
The third highest level of cognitive demand, procedures with connec-tions, involves working with problems in multiple ways. For example, vi-sual diagrams or manipulatives can be used to connect underlying concepts and symbolic representations (Smith & Stein, 1998). Procedures with con-nections require more cognitive effort because the focus is on making math-ematical connections rather than on obtaining correct answers in isolation. The final and highest level of cognitive demand is what Smith and Stein re-fer to as doing mathematics. Doing mathematics requires non-algorithmic thinking and therefore, tasks at this level are multifaceted, making connec-tions between mathematics content, and placing responsibility on the stu-dent to explore and understand the mathematics. When working at this high-est level, students sometimes experience anxiety due to the non-algorithmic approaches tasks that this level often require (Smith & Stein, 1998).
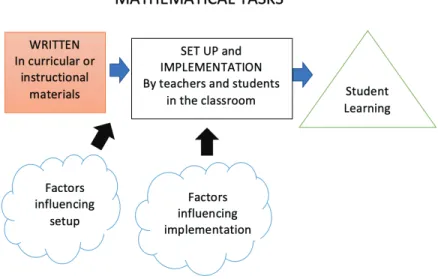
In addition to explaining levels of cognitive demand, Smith and Stein (1998b) present a framework that incorporates their work with the TAG, The Mathematics Task Framework. They discuss how the identified level of a mathematics task as printed instructional material can be altered both by how the teacher sets up the task and how the task is implemented by the students. They explain that “the nature of tasks often changes as they pass from one phase to another” (p. 270, 1998b). They found that it is impor-tant for teachers to be aware of both the identified level of cognitive demand of mathematics tasks but also how to focus on classroom implementation since how teachers set-up and implement tasks has the possibility to either increase or decrease the level of cognitive demand. For this paper, we con-sider a modified version of the Mathematics Task Framework as conceptual-ized by Wilhelm in 2014 (Figure 1).
Figure 1. Wilhelm’s (2014) Modification of Smith & Stein’s (1998b) Math-ematics Task Framework.
For this particular study, we focus on the first phase of the framework considering elementary mathematics tasks appearing as instructional mate-rials online. Tasks designs are important to classroom instruction because of their influence on other classroom components. In Principles to Actions, the authors explain that teachers must “regularly select and implement tasks that promote reasoning and problem solving” so students “have the oppor-tunity to engage in high-level thinking” (NCTM, 2014, p. 17). However, choosing a task that is considered to be at a high-level of demand does not guarantee it will either be setup or implemented at the same level. Research-ers found that implementing tasks at a high level is difficult for teachResearch-ers; teachers’ actions, such as choices regarding scaffolding a task (Henningsen & Stein, 1997) or the expectations of discourse (Hiebert & Wearne, 2003) can alter the level of demand. During implementation, it is most common for the level of demand to decrease (National Council of Teachers of Math-ematics, 2007). Thus how a task is implemented has a direct impact on the final component of the framework, student learning, which has been shown can increase when students are exposed to high-demand tasks (e.g. Zohar & Dori, 2003).
Wilhelm states, “The cognitive demand of the selected task sets the stage for the cognitive demand over the course of the lesson” (2014, p. 640).
Thus, while it is imperative to keep all aspects of the framework under con-sideration when studying differing levels of cognitive demand of mathemat-ics tasks, for this study, we are solely focused on the first component. We are interested in learning more about the quality of mathematics resourc-es available online on Pinterresourc-est. The level of demand of tasks available to teachers on Pinterest will affect the task implementation and most impor-tantly student learning.
LITERATURE REVIEW
For this literature review, we first synthesize the body of academic work done by mathematics education researchers who have considered the cog-nitive demand of elementary mathematics tasks in the classroom. We then discuss studies using Smith and Stein’s Task Analysis Guide as a means of determining tasks’ level of cognitive demand. After discussing work using TAG, we share research about teachers’ use of educational materials found online.
High-Cognitive Demand Tasks
Choosing and implementing high level mathematics tasks in the class-room provides students with the opportunity to learn mathematics (e.g. Boaler, 2002; Hiebert & Wearne, 1993; Zohar & Dori, 2003). When stu-dents engage in high-quality mathematics tasks, stustu-dents tend to engage in classroom discourse which “mediate(s) the relationship between teach-ing and learnteach-ing” (Hiebert & Wearn, 1993, p. 420). The effects of workteach-ing with high level mathematics tasks was found to benefit all students, not just students considered high achievers (Zohar & Dori, 2003). Due to the im-portance of exposing students to tasks at high levels of cognitive demand, teachers must have access to such tasks.
To classify tasks when analyzing curricula at both the secondary (e.g. Brändström, 2005; Jones & Tarr, 2007) and elementary level (e.g. NCTM, 2017; Stein, Smith, Henningsen, & Silver, 2000), Smith & Stein’s (1998) TAG, has often been used. For example, Jones and Tarr (2007) considered the subject of probability in terms of the cognitive demand present in vari-ous mathematics textbooks. They concluded that a majority of tasks in the alternate Standards Era textbooks had high levels of cognitive demand, while 85% of problems in the non-Standards Era textbooks were of a
low-er level of cognitive demand. Furthlow-ermore, Brändström (2005) evaluated a seventh-grade textbook and determined that all tasks regardless of intended level of demand functioned at a low cognitive demand when implemented, even when the book stated that a task was differentiated for learners. Fur-ther, NCTM published an article looking into the levels of cognitive demand of elementary mathematics tasks and found that cognitive demand can vary within mathematics topics (NCTM, 2007).
Even when tasks identified as eliciting high levels of cognitive demand are available, it is difficult for teachers to choose and implement mathemat-ics tasks at the highest levels of cognitive demand. Wilhelm (2014) found that teachers’ mathematical knowledge for teaching (MKT) was related to their choice of tasks; teachers with lower levels of MKT tended to choose lower level mathematics tasks to implement in their classrooms. Thus, teachers need professional development focused on task selection.
Smith and Stein’s TAG has been used with both preservice and inser-vice teachers as a means of professional development to classify math-ematics tasks according to their level of cognitive demand. Boston (2013) worked with secondary education mathematics teachers on choosing and implementing cognitively demanding math tasks before and after a pro-fessional development workshop. Boston concluded that after taking the workshop, teachers were able to correctly classify the cognitive demand of mathematics tasks (Boston, 2013). Stein et al. (2000) found the best way to avoid the problem of textbooks not offering enough tasks with high levels of cognitive demand was to have teachers learn to sort tasks by their level of cognitive demand. When teachers learned how to identify the level of cogni-tive demand of tasks, they were more likely to choose higher level tasks to implement in their classrooms. All of this reviewed professional work with teachers was focused on traditional curricula; we are not aware of any stud-ies looking specifically at open-source, online educational materials. Popularity of Online Educational Materials
In 2017, researchers began evaluating online educational resources and found that many elementary school teachers used Pinterest and Google for mathematics lesson plan ideas (Hertel & Wessman-Enzinger, 2017). Over half a million educational posts are pinned on Pinterest everyday, and edu-cation-related pins are the second most searched for item on Pinterest (Her-tel & Wessman-Enzinger, 2017). These pins often lead to a paid resource site such as Teachers Pay Teachers (TpT), where many of the lessons cost
three to eight dollars (Joyce, 2015). Researchers found that teachers tend to base the merit of a lesson plan on its user rating, even though high ratings can oftentimes be explained by teachers’ self-promotions of their posts via social media sites such as Instagram (Sawyer & Meyers, 2018). A 2018 ar-ticle claimed that some teachers’ promotions of their products amasses over 100,000 followers and often results in over $200,000 of profit each year (Reinstein, 2018).
Shifting towards Online Resources
Prior to our current age of personal sharing on the internet, licensing and copyright laws made it difficult to reuse or repurpose online educa-tional resources (Wiley, 2008). Now, many resources are available through new licensing strategies such as Creative Commons which allow for wider access. (Jenkins, Ford, & Green, 2013; Kelly, 2014). Thus, many teachers now search online to find tasks for their classrooms (Hunter & Hall, 2018), and they are often self-motivated to find and use such resources (Hylén, 2006). To find tasks online, teachers often use other teachers as a starting point, trusting that the sites they recommend will be trustworthy (Clements & Pawlowski, 2012). However, despite the fact that teachers use online re-sources and researchers such as Jones & Tarr (2007) called for “analyzing broader range of materials” (p. 21) beyond traditional textbooks and cur-ricula, there has not been much work looking into what resources teachers choose online. This study helps to close the gap in the research to better understand the quality of the resources teachers choose from Pinterest.
METHODOLOGY
We conducted a three-step document analysis process (Bowen, 2009) to assess Pinterest’s top 500 elementary mathematics tasks. To determine significant relationships between various characteristics, correlational data were analyzed using the Pearson chi-square test for independence and Spearman’s rho correlation (Pallant, 2013).
Data collection
In one of our previous investigations, we found that teachers often se-lect Pinterest posts based on their number of pins (Sawyer & Meyers, 2018).
Since the initial investigation was completed, Pinterest removed the algo-rithm calculating the number of people who pinned a resource to one of their own created boards within the site. Pinterest noted that counting the number of pins would consequently result in the oldest pins having the larg-est value, thus they changed their algorithms to look at the top viewed pins by their members (Kynes, 2018). Because top viewed often means the posts promoted by teachers (Reinstein, 2018), we decided to see if the top 500 pins for elementary mathematics tasks included high-quality elementary mathematics materials with high levels of cognitive demand.
On June 6th, 2018, we downloaded the top 500 pins provided on Pinter-est under the search term: “elementary math activities.” Once downloaded, we quickly realized that some of the results were copies of manipulatives, classroom posters, or lists of common core standards rather than mathemat-ics activities or tasks. Consequently, we could not identify the level of cog-nitive demand of all 500 pins. Also, because many tasks included multiple types of questions or multiple worksheets, we chose to consider each post as potentially comprised of multiple mathematics tasks. To clarify, we ad-opted Doyle’s (1983) definition of academic tasks as “answers students are required to produce and the routes that can be used to obtain these answers” (Doyle, 1983,p. 161). Of the 500 files downloaded from Pinterest, our data-set consisted of 355 resources that qualified as elementary mathematics ac-tivities containing at least one mathematics task.
Data Analysis
We conducted a three-step document analysis process using QSR NVi-vo 10.2 to answer our research questions (Bowen, 2009). The first phase of data analysis was to code each pin for identifying attributes including the intended topic. During this phase of analysis, one researcher worked inde-pendently to code attributes; any questions were brought to the full research team for negotiation. The purpose for coding the mathematics topic was to capture the foci of the various elementary mathematics tasks, first coding topics that emerged and then collapsing them into the Common Core State Standards of Mathematics Strands (Table 1) (NGACBP, 2010). For exam-ples of coding, see Appendix A.
Table 1
Topics as They Were Organized by Common Core Bands
Common Core Strands Topics
Counting and Cardinality One to one correspondence, comparing numbers, counting and ordering, subitizing Operations and Algebraic Thinking Addition, subtraction, multiplication,
division, patterns, even or odd, prime and composite, fact families, number bonds Numbers and Operations in Base
ten
Base 10, place value, decomposing num-bers, ten frame, rounding, hundreds chart, number sense
Numbers and Operations-Fractions
Fractions, decimals
Measurement and Data Graphing, tally markers, time, money, unit conversions, area and perimeter, angles, measurement, estimation, number line Geometry Shapes, symmetry, coordinate plane,
sort-ing, lines, position words Statistics and Probability, Rational
and Proportional Relationships, the Number System
Central tendency, probability, combina-tions, percent, integers
The second phase of data analysis included coding each pin to deter-mine if it contained mathematics tasks and then coding for the tasks’ associ-ated levels of cognitive demand: memorization, procedures without connec-tions, procedures with connecconnec-tions, and doing mathematics (Smith & Stein, 1998). Because pins could contain multiple mathematics tasks, each pin received a minimum, mode, and maximum level of cognitive demand code (see Appendix B for examples of codes). For this paper, the mode level of cognitive demand is presented and analyzed.
The third phase of data analysis included coding the types of pictures provided with or on the elementary mathematics tasks due to emergent re-searcher noticing of different image types and subsequent research indicat-ing that some teachers select classroom tasks due to visual appeal (Carpen-ter, Cassaday, & Monti, 2018). We wanted to determine if the level of cog-nitive demand required for elementary mathematics tasks with decorative pictures differed from those with functional pictures. As seen in Appendix C, we used Brändström’s (2005) categorization scheme of functional, when
the picture aided in solving the problem, decorative, when there was a pic-ture but it was not needed to solve the problem, and no picture if there was no image present (Brändström, 2005). A task could receive both a functional and a decorative code if both types of images were included.
For both phases two and three, three researchers worked together to reach inter-rater reliability. We conducted one cycle of coding together us-ing a random number generator to select 10 tasks from Pinterest. We then conducted four more rounds separately before reaching reliability. Fleiss Kappa (Fleiss, Cohen, & Everitt, 1969) was used to measure reliability; on the fourth and final round, an acceptable kappa for each level of demand was reached (ranging from .781 to .895). Throughout the coding process, we created a codebook to assist with reliability (DeCuir-Gunby, Marshall & McCulloch, 2011). After the three researchers met reliability, we asked the fourth group researcher who was unfamiliar with the coding process to apply the codebook to 10 randomly selected pins in order to evaluate the accuracy of the codebook. After one round, we reached reliability, again us-ing Fleiss Kappa, which indicated the codebook was reliable. After reachus-ing reliability, two coders independently coded the remaining pins.
Once coding was completed, we conducted the Pearson chi-square sta-tistical tests to determine the relationship between the level of cognitive de-mand, the topic, and the picture type of the elementary mathematics tasks (Bollen, 1989). Since we had a large sample size, we selected alpha as 0.05, thus setting the criteria that the p-value must be less than 0.05 for us to re-ject the null hypothesis that there is no relationship between the two vari-ables. We used Spearman’s rho rank order correlation to determine the as-sociation between the level of cognitive demand and picture type. Since we preselected our alpha as 0.05, when the p-value was less than alpha there was evidence of a correlation. Specifically, the ranking was scored one for only decorative images, two for decorative and functional images, and three for only functional images. A significant positive correlation would indicate that pins with higher levels of cognitive demand had functional images.
FINDINGS
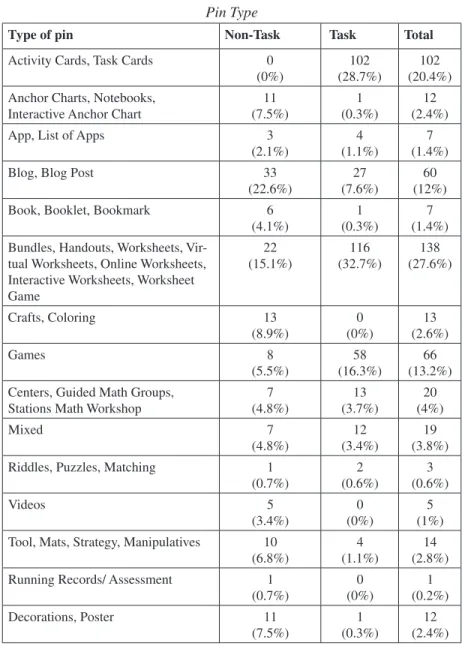
Of the 500 pins we analyzed, we found that 145 (29%) pins did not contain elementary mathematics tasks while 355 (71%) were elementary mathematics tasks. Thus, we categorized the 500 pins into 20 different cat-egories (Table 2). The top non-tasks were grouped into: Blogs (23%), Work-sheets (15%), Crafts (9%), and Decorations (8%). The top elementary
math-ematical tasks were: Worksheets (33%), Activity Cards (29%), and Games (16%).
Table 2
Pin Type
Type of pin Non-Task Task Total
Activity Cards, Task Cards 0 (0%)
102 (28.7%)
102 (20.4%) Anchor Charts, Notebooks,
Interactive Anchor Chart
11 (7.5%) 1 (0.3%) 12 (2.4%)
App, List of Apps 3
(2.1%)
4 (1.1%)
7 (1.4%)
Blog, Blog Post 33
(22.6%)
27 (7.6%)
60 (12%) Book, Booklet, Bookmark 6
(4.1%)
1 (0.3%)
7 (1.4%) Bundles, Handouts, Worksheets,
Vir-tual Worksheets, Online Worksheets, Interactive Worksheets, Worksheet Game 22 (15.1%) 116 (32.7%) 138 (27.6%) Crafts, Coloring 13 (8.9%) 0 (0%) 13 (2.6%) Games 8 (5.5%) 58 (16.3%) 66 (13.2%) Centers, Guided Math Groups,
Stations Math Workshop
7 (4.8%) 13 (3.7%) 20 (4%) Mixed 7 (4.8%) 12 (3.4%) 19 (3.8%) Riddles, Puzzles, Matching 1
(0.7%) 2 (0.6%) 3 (0.6%) Videos 5 (3.4%) 0 (0%) 5 (1%) Tool, Mats, Strategy, Manipulatives 10
(6.8%)
4 (1.1%)
14 (2.8%) Running Records/ Assessment 1
(0.7%) 0 (0%) 1 (0.2%) Decorations, Poster 11 (7.5%) 1 (0.3%) 12 (2.4%)
Type of pin Non-Task Task Total Project 3 (2.1%) 7 (2%) 10 (2%) Curriculum, Unit 1 (7%) 3 (0.8%) 4 (0.8%) Song 2 (1.4%) 0 (0%) 2 (0.4%) Number Talks 0 (0%) 3 (0.8%) 3 (0.6%) N/A 1 (0.7%) 1 (0.3%) 2 (0.4%) Total 145 (100%) 355 (100%) 500 (100%)
Table 3 contains the results of the coding of the 500 pins for their as-sociated Common Core State Standards for Mathematics’ content strands (NGACBP, 2010). We found that most of the pins (39%) concerned Num-ber and Operations in Base Ten with both tasks (42%) and non-tasks (34%) having the largest concentration of pins. The second most common strand for both tasks (25%) and non-tasks (19%) was Operations and Algebraic Thinking (23%). This similarity between tasks and non-tasks ended for the third most popular strands. The third highest concentration of non-tasks was No Mathematics (16%) which included mathematics posters or print out manipulatives that could not be connected to a specific content strand. On the other hand, the third concentration of pins with tasks was the Measure-ment and Data (13%) strand; these included tasks for measuring objects us-ing non-standard manipulatives.
Table 3
Common Core Strands Associated with Tasks and Non-Tasks
Common Core Strands Non-Task Task Total No Mathematics – 0 24 (16.4%) 0 (0%) 24 (4.85%) Counting and
Cardinal-ity – 1 2 (1.4%) 13 (3.7%) 15 (3%) Operations and
Alge-braic Thinking – 2 27 (18.5%) 89 (25.1%) 116 (23.2%)
Common Core Strands Non-Task Task Total Numbers and Operations
in Base Ten – 3 49 (33.6%) 148 (41.7%) 197 (39.4%) Numbers and
Opera-tions-Fractions – 4 14 (9.6%) 29 (8.2%) 43 (8.6%) Measurement and Data
– 5 13 (8.6%) 45 (12.7%) 58 (11.6%) Geometry - 6 13 (9.6%) 30 (8.5%) 43 (8.6%) Statistics and
Probabil-ity, Rational and Proportional Relation-ships, the number system – 7 0 (0%) 1 (0.3%) 1 (0.2%) Mixed – 8 3 (2.1%) 0 (2.8%) 3 (0.6%) Total 145 (100%) 355 (100%) 500 (100%)
Level of Cognitive Demand
After analyzing the 355 pins that included elementary mathematics tasks for their mode level of cognitive demand, we found that 53% of them consisted of lower-level mathematical tasks, those coded as memorization or procedures without connections (Figure 2).
Figure 2. Level of Cognitive Demand on Pinterest.
The smallest category we identified, Doing Mathematics, consisted of 2% of all the pins in our sample. We found that the largest percentage of the top-rated elementary mathematics tasks on Pinterest were procedures with connections, followed by procedures without connections (Table 4).
Table 4
Level of Cognitive Demand on Pinterest
Frequency Percentage Lower-level
Demands
Memorization
Procedures without connections
69 120 19.4% 33.8% Higher-level Demands
Procedures with connections Doing Mathematics 160 6 45.1% 1.7% Total 355 100%
Level of Cognitive Demand and Mathematical Topic
We also investigated the statistical difference between the level of cognitive demand and the mathematics topic. As seen in Table 5, there is a
vast difference between the strands and the cognitive demand. Notice that while 27% of the geometry tasks consisted of memorization, only 3% of the fraction tasks were considered as memorization tasks. Each category num-ber one through seven in Table 5 corresponds to the Common Core Strands mentioned in Table 3.
Table 5
Level of Cognitive Demand and Mathematical Topic
Mode Memorization Procedures without connections Procedures with connections Doing Mathematics Total Category 1 Count 1 4 8 0 13 % within category 7.7% 30.8% 61.5% 0.0% 100.0% 2 Count 16 31 41 1 89 % within category 18% 34.8% 46.1% 1.1% 100.0% 3 Count 37 43 66 2 148 % within category 25% 29.1% 44.6% 1.4% 100.0% 4 Count 1 5 21 2 29 % within category 3.4% 17.2% 72.4% 6.9% 100.0% 5 Count 6 27 11 1 45 % within category 13.3% 60% 24.4% 2.2% 100.0% 6 Count 8 10 12 0 30 % within category 26.7% 33.3% 40% 0.0% 100.0% 7 Count 0 0 1 0 1 % within category 0.0% 0.0% 100.0% 0.0% 100.0% Total Count 69 120 160 6 355 % within category 19.4% 33.8% 45.1% 1.7% 100.0%
To conduct the statistical analysis of the results, we combined the tasks coded as memorization and procedures without connections into a larger
category of tasks with lower levels of cognitive demand. Similarly, we com-bined the procedures with connections and doing mathematics into a larger category of tasks with higher levels of demand. We did not consider the sta-tistics and probability strand because we did not have enough tasks for it to be considered significant. With our preselected alpha value of .05, we de-termined that p = 0.001 when we conducted our Pearson chi- squared test, which is less than our alpha. Therefore, there is a statistically significant dif-ference between the mathematics topic and the level of cognitive demand. Most of the items in the geometry strand had a lower level of cognitive de-mand (73%). Alternatively, most of the items in the Numbered Operations with Fractions strand contained elementary mathematics tasks with higher levels of cognitive demand (79%). Thus, when teachers are selecting tasks in these domains, there is a statistically significant difference in the level of cognitive demand found in top elementary mathematics tasks pins posted on Pinterest.
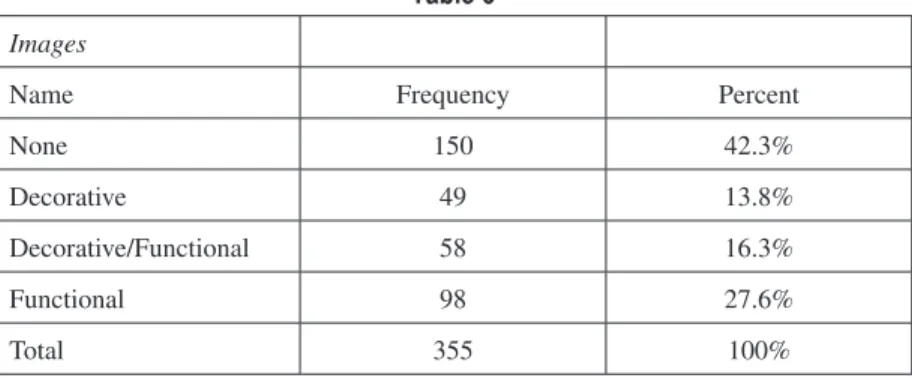
Level of Cognitive Demand and Pictures
Concerning the visual aspects of the top elementary mathematics tasks posted on Pinterest, 42% of the pins included no pictures, instead they only contained words and numbers (Table 6). Twenty eight percent of pins in-cluded functional pictures that served as aids in solving the mathematics tasks, while 14% only included decorative images which were not necessary for solving the mathematics tasks. We considered these values to determine if there was a relationship between a task’s image type and its level of cog-nitive demand.
Table 6
Images
Name Frequency Percent
None 150 42.3%
Decorative 49 13.8%
Decorative/Functional 58 16.3%
Functional 98 27.6%
When looking at the observed level of cognitive demand in an elemen-tary mathematics task verses the image types, we noticed that they have different frequencies (Table 7). Tasks with decorative pictures had a 67% chance of being at a lower level of cognitive demand, while tasks with func-tional pictures had a 47% chance. To determine if there was a correlation between decorative images and lower levels of cognitive demand, we chose to remove the pins with no image and focus only on decorative, both deco-rative and functional, and functional tasks.
Table 7
Level of Cognitive Demand and Pinterest Image Mode
Memorization Without With Doing
Math Total
Image No image Count 28 48 72 2 150
% within Image 18.7% 32% 48.0% 1.3% 100.0% Decorative Count 14 19 15 1 49 % within Image 28.6% 38.8% 30.6% 2% 100.0% Decorative/ Functional Count 6 28 24 0 58 % within Image 10.3% 48.3% 41.4% 0.0% 100.0% Functional Count 21 25 49 3 98 % within Image 21.4% 25.5% 50.0% 3.1% 100.0% Total Count 69 120 160 6 355 % within Image 19.4% 38.8% 45.1% 1.7% 100.0%
We conducted the Spearman’s rho test to determine if there was a cor-relation and statistical difference between the level of cognitive demand and its image type. There was a significant positive correlation with ρ = 0.161 and p = 0.015 between level of cognitive demand and the picture type, meaning higher levels of cognitive demand correlated with functional im-ages. If the picture provided on an elementary mathematics task was purely decorative, the task was more likely to have a lower level of cognitive de-mand.
DISCUSSION
We structure the discussion around answering each of our research questions. When teachers search for “elementary math activities” on Pin-terest, our results indicate that teachers will find 71% of the top pins to be mathematical tasks that could be implemented in their classroom. With only 29% of the pins not containing mathematics tasks, we believe teachers would be able to find elementary math activities relatively easily using this visual search engine especially if the teachers are looking for handouts and worksheets since they could easily scroll past the non-tasks. While teachers should be able to find various worksheets, Pinterest does not offer a large variety of mathematical content areas. Less than 1% of the mathematics tasks represented in the pins were on data, statistics and probability content and many other content areas were covered by 12% or less of the mathemat-ics tasks. Yet, Pinterest seems to be a good tool for finding elementary math-ematics tasks focused on numbers and operations in base ten, and algebraic thinking.
Concerning level of cognitive demand, for the pins that contained el-ementary mathematics tasks, it was most common for the tasks to be at the procedures with connections (the second-highest) level. This is good news for teachers who use Pinterest to search for resources on Pinterest because the chance of finding a pin with higher levels of cognitive demand was only slightly under 50%. However, the data also indicated that when teachers choose a mathematics task, it will most likely not be at the highest level of cognitive demand of doing mathematics. We found that the top Pinterest posts do not often include elementary mathematics tasks with the highest level of cognitive demand, with just 2% coded as doing mathematics.
In a different paper (Wismer, Dick, Shapiro, & Sawyer, under review) we report on findings from a similar study completed with elementary math-ematics resources posted on Teachers Pay Teachers; the findings were sur-prisingly similar, with only 1% of the resources studied including tasks con-sidered doing mathematics. This dearth of resources at the highest level of cognitive demand is particularly concerning given Smith and Stein’s (1998) assertion that we should have mathematics tasks at various levels of cogni-tive demand within the classroom. Pinterest does not provide all four levels equally. As part of the Task Selection Framework (Smith & Stein, 1998b), the first step is identifying a task’s level of cognitive demand; thus math-ematics teacher educators need to ensure that teachers know how to identify levels of cognitive demand. And beyond identification, teachers also need to be taught how to adapt the resources they find to be at a higher level of
cog-nitive demand (Davis, Beyer, Forbes, & Stevens, 2011). Adapting resources can be intimidating for teachers due to a perceived lack of knowledge, thus some teachers avoid adapting resources altogether (Ding & Carlson, 2013) which again points to a need for teacher professional development. In addi-tion, we believe teacher educators can help teachers develop the skills nec-essary to become effective, well informed producers of curricular materials (Lapp, Fisher, Frey, & Gonzalez, 2014).
Another important finding was the statistically significant difference between mathematics topics and levels of cognitive demand on Pinterest. NCTM (2007) found similar differences between mathematical topics and their cognitive demand for traditional printed curriculum. We find this not to be surprising given that one focus in elementary school is to learn math-ematics vocabulary (NGACBP, 2010). For example, a result of this focus could be that teachers tend to use memorization tasks to teach topics such as new geometry terms (Lindquist & Clements, 2001). Even though these tasks could be taught through higher levels of cognitive demand, many teachers rely on lower level techniques (Brändström, 2005; Lindquist & Clements, 2001). From this perspective, whether teachers choose tasks at high or low levels of cognitive demand when teaching a topic may depend on their in-terpretations of the standards. Regardless, teachers need to be aware of the differences in levels of cognitive demand based on the different mathemat-ics topic strands.
Finally, this data analysis indicates a correlation between lower level mathematical tasks and decorative images for the top elementary mathemat-ics activities pins on Pinterest. A potential benefit of this finding is that it provides an easy way for teachers to identify whether a task is likely to rep-resent a high or low level of cognitive demand. If the pin’s image appears to be both visually appealing and unrelated to the mathematics task, there is a good chance that it does not support higher level thinking. Unfortunately, many teachers select tasks based on their visual appeal (Sawyer & Meyers, 2018) which our data suggests is often correlated with lower levels of cogni-tive demand. Teachers should be made aware of this potential pitfall in their searches for elementary mathematics activities on Pinterest.
IMPLICATIONS
The data implies specific implications to the teacher education field on how to support teachers’ searching for elementary mathematics tasks online as well as a need for more information about the other websites that display
higher level of cognitive demand tasks. Finally, we posit new questions in-vestigating who is creating these resources thus influencing the mathematics education field online.
Support Responsible Use of Sites Such as Pinterest
Teachers often use websites like Pinterest because they either have a limited supply of resources, or because websites are easily accessible (Saw-yer & Me(Saw-yers, 2018). Alternatively, many mathematics teacher educators assume that tasks from websites like Pinterest are “bad” and not mathemati-cally rigorous (Sawyer, 2016). This assumption is not completely true; we found some elementary mathematics tasks on Pinterest that can be consid-ered mathematically rigorous. In light of this, we encourage a mindset that critically evaluates rather than criticizes mathematics tasks found on est. Therefore, when inservice or preservice teachers cite going to Pinter-est to find elementary mathematics tasks, encourage them to explain their reasons behind their selection and discuss with them ways to adapt the re-sources they choose to best benefit their students. As Dan Sawyer, a Virgina fifth grade teacher, explained:
It’s like sex education: We need to teach how to use it responsi-bly. Some people say abstinence only, which I think is what most preservice teachers are taught. They think we should only teach educators how to create their own curricular resources and that using other people’s resources is something to be avoided. They’ll even give you a fresh copy of Bloom’s taxonomy and talk about proper verb choice for 20 minutes. At the end of the day, though, you’re not any closer to a usable resource and you’re left feeling frustrated and out of options. On the other hand, I think most expe-rienced teachers take a more practical approach and realize teach-ing preservice teachers how to be responsible curators is way more effective. We know you’re going to use other people’s resources at some point as a practicing teacher, so we should educate you as to how to choose good resources and curricular items. I can’t think of a single teacher I’ve worked with who doesn’t use online resources from places like Pinterest or Teachers Pay Teachers, but I’ve never had one single professional development that talked about smart and sound ways to select resources.
Helping our teachers to be critical consumers of today’s resources includes teaching them to become their own peer reviewer of materials found online.
We call for teacher educators to teach teachers to determine the level of cog-nitive demand, as well as to identify functional pictures.
Teachers are going to use online materials from social media websites like Pinterest that they find most valuable (Hylen, 2006), so the best strategy we can suggest is for teacher educators to support them through their selec-tion, adaptation and classroom implementation. We posit that one way to do this is to formally work with teachers using the Task Selection Framework as a means of professional development similar to Boston (2013). First, teach teachers to use the TAG to identify tasks’ levels of cognitive demand, then work with teachers to adapt tasks for their classrooms, support teachers as they implement the tasks in their classroom and again work with teachers to study their students’ learning as a result of the classroom implementa-tion. In general we believe that to help our teachers succeed in today’s class-rooms, we need to provide teachers with a critical lens. Curricula is chang-ing in the world of teachchang-ing, and teacher educators need to be aware that the change is not necessarily bad but something we must address to help teach-ers become critical curators of educational resources in the future.
Support Awareness of Other Websites
In addition, we need teachers to understand that if they do not plan to adapt the resource then Pinterest might not be the best website for search-ing for elementary mathematics resources. The majority of the items are low-level cognitive demand, and the pins only support a limited number of mathematical content areas. Therefore, teachers need to know of other websites that offer resources that are higher-level cognitive demand and pro-vide these underrepresented subjects like geometry and statistics. Higher-level demand mathematical tasks are more likely to be found online from websites that include a vetting process, such as NCTM.org or Illuminations (Dick, Shapiro, & Sawyer, under review). Yet since these higher-level tasks exist on the webisphere, there is a need for these materials to be pinned on Pinterest and other social media platforms that do not include a vetting com-ponent. Teacher educators and national organizations can support teachers who use these resources by participating in this media. We can provide eas-ily accessible higher-level mathematics tasks for teachers in an area they al-ready search. Many organizations and schools alal-ready participate on Twitter and Facebook, and this research suggests that as teacher educators, perhaps we need to participate on Pinterest as well.
Creators Need to be Known
The data indicates that we do not have a full grasp of what teachers are viewing online. Even when we are searching for “elementary mathematics activities” a variety of materials are found through this visual search engine. This leads to the question of who is creating the materials on these online websites and how do the tags get assigned. We know teachers are using Pinterest (Hunter & Hall, 2018), but we do not have knowledge about the creators of these materials. Textbook companies are no longer gatekeepers of resources which opens up teachers to vast and numerous materials found online. However opening this gate also increases the possibility of invalid and inaccurate materials to be circulated (Sawyer, 2016). Since the educa-tion field does not know who is creating the materials, we do not know who is influencing the field in either positive or negative manners. Future re-search would be needed to understand this new growing body of curriculum creators and sharers.
FUTURE RESEARCH AND LIMITATIONS
This work was completed for the top 500 elementary mathematics tasks found on Pinterest. We are aware that Pinterest provides significantly more mathematical resources on its website, so our study is limited to the number of pins we analyzed. We also know teachers utilize social media sites such as Pinterest when lesson planning for other subjects (Hunter & Hall, 2018), thus we believe similar studies could be conducted in other content areas. Future research could also be conducted on a larger sample from the web-site or other teacher education webweb-sites to determine if they have similar levels of cognitive demand for their mathematical tasks. Sawyer and Meyers (2018) found elementary teachers especially interested in using Pinterest, but we are curious if middle or secondary mathematical content would be as prevalent with low level of demand.
CONCLUSION
In conclusion, we want teacher educators to support responsible use of social media sites such as Pinterest in their classroom. We believe this can begin with the Task Selection Framework (Smith & Stein, 1998b; Wilhem, 2014) and working with teachers to identify the level of cognitive demand
of mathematics tasks. Inservice and preservice teachers need to be aware of what is and is not available on various websites. Since there are clear short-comings of Pinterest as a repository of elementary mathematics activities, this paper is also a call to other educators to pin higher level cognitive de-mand tasks to place on this platform to support teachers as well as to pin or create mathematical tasks in underrepresented content areas like geometry, statistics, and cardinality. If you have good resources, Pinterest is a place that is in desperate need of your knowledge.
References
Boaler, J. (2002). Exploring the nature of mathematical activity: Using theory, research and working hypotheses’ to broaden conceptions of mathematics knowing. Educational Studies in Mathematics, 51(1-2), 3-21.
Bollen, K. A. (1989). A new incremental fit index for general structural equation models. Sociological Methods & Research, 17(3), 303-316.
Boston, M. D. (2013). Connecting changes in secondary mathematics teachers’ knowledge to their experiences in a professional development workshop.
Journal of Mathematics Teacher Education, 16(1), 7-31.
Bowen, G. A. (2009). Document analysis as a qualitative research method. Qual-itative research journal, 9(2), 27-40.
Brändström, A. (2005). Differentiated tasks in mathematics textbooks: An analy-sis of the levels of difficulty (Doctoral dissertation, Luleå tekniska univer-sitet).
Carpenter, J., Cassaday, A., & Monti, S. (2018, March). Exploring How and Why Educators Use Pinterest. In Society for Information Technology & Teacher Education International Conference (pp. 2222-2229). Association for the Advancement of Computing in Education (AACE).
Clements, K. I., & Pawlowski, J. M. (2012). User‐oriented quality for OER: Un-derstanding teachers’ views on re‐use, quality, and trust. Journal of Com-puter Assisted Learning, 28(1), 4-14.
Davis, E. A., Beyer, C., Forbes, C. T., & Stevens, S. (2011). Understanding ped-agogical design capacity through teachers’ narratives. Teaching and Teacher Education, 27(4), 797-810.
DeCuir-Gunby, J. T., Marshall, P. L., & McCulloch, A. W. (2011). Developing and using a codebook for the analysis of interview data: An example from a professional development research project. Field methods, 23(2), 136-155. Dick, L., Shapiro, E. & Sawyer, A. (under review). Critical consumption of
on-line resources. Mathematics Teacher: Learning and Teaching PK-12.
Ding, M., & Carlson, M. A. (2013). Elementary teachers’ learning to construct high-quality mathematics lesson plans: A use of the IES recommendations.
The Elementary School Journal, 113(3), 359-385.
Doyle, W. (1983). Academic work. Review of educational research, 53(2), 159-199.
Fleiss, J. L., Cohen, J., & Everitt, B. S. (1969). Large sample standard errors of kappa and weighted kappa. Psychological bulletin, 72(5), 323.
Hansen, K., Nowlan, G., & Winter, C. (2012). Pinterest as a tool: Applications in academic libraries and higher education. Partnership: The Canadian Jour-nal of Library and Information Practice and Research, 7(2).
Henningsen, M., & Stein, M. K. (1997). Mathematical tasks and student cogni-tion: Classroom-based factors that support and inhibit high-level mathemat-ical thinking and reasoning. Journal for research in mathematics education, 524-549.
Hiebert, J., & Wearne, D. (1993). Instructional tasks, classroom discourse, and students’ learning in second-grade arithmetic. American educational re-search journal, 30(2), 393-425.
Hertel, J. T., & Wessman-Enzinger, N. M. (2017). Examining Pinterest as a cur-riculum resource for negative integers: An initial investigation. Education Sciences, 7(2), 45.
Hunter, L. J., & Hall, C. M. (2018). A survey of K-12 teachers’ utilization of so-cial networks as a professional resource. Education and Information Tech-nologies, 23(2), 633–658. https://doi.org/10.1007/s10639-017-9627-9 Hylén, J. (2006). Open educational resources: Opportunities and challenges.
Proceedings of Open Education, 4963.
Jenkins, H., Ford, S., & Green, J. (2013). Spreadable media: Creating mean-ing and value in a networked culture. New York, NY: New York University Press.
Jones, D. L., & Tarr, J. E. (2007). An examination of the levels of cognitive demand required by probability tasks in middle grades mathematics text-books.Statistics Education Research Journal, 6(2).
Joyce, K. (2015, March). How Pinterest Is Revolutionizing Your Child’s Class-room. BRIGHT Magazine. Retrieved from https://brightthemag.com/how-Pinterest-is-revolutionizing-your-child-s-classroom-4ccd4d59bbb9.
Kelly, H. (2014). A path analysis of educator perceptions of open educational resources using the technology acceptance model. The International Review of Research in Open and Distributed Learning, 15(2), 26-42. https://doi. org/10.19173/irrodl.v15i2.1715
Kerali, S. (2018). Is Pinterest a social media site. Retrieved from:https://www. sylviakerali.com/is-pinterest-a-social-media-site/
Lapp, D., Fisher, D., Frey, N., & Gonzalez, A. (2014). Students can purposefully create information, not just consume it. Journal of Adolescent & Adult Lit-eracy, 58(3), 182-188.
Lindquist, M. M., & Clements, D. H. (2001). Geometry must be vital. Teaching Children Mathematics, 7(7), 409.
National Council of Teachers of Mathematics. (2014). Principles to action: En-suring mathematical success for all. Reston, VA: NCTM.
National Council of Teachers of Mathematics. (2007). Second Handbook of Re-search on Mathematics Teaching and Learning. (F. K. Lester, Ed.). Char-lotte, NC: Information Age Publishing.
National Governors Association Center for Best Practices. (2010). Common Core State Standards for mathematics. Washington, DC: Authors.
Obar, Jonathan A., Wildman, Steve (2015). “Social media definition and the governance challenge: An introduction to the special issue”. Telecommu-nications Policy. 39 (9): 745–750. doi:10.1016/j.telpol.2015.07.014. SSRN 2647377.
Pallant, J. (2013). SPSS survival manual. McGraw-Hill Education (UK). Pinterest. (2019). All about Pinterest. Retrieved from: https://help.pinterest.com/
en/guide/all-about-pinterest
Kynes, V., (2018) What happened to pin counts on Pinterest? Retrieved from: https://vanessakynes.com/pin-counts/
Reinstein, J. (2018). Teachers Are Moonlighting As Instagram Influencers To Make Ends Meet. BuzzFeed News. Retrieved from: https://www.buzzfeed- news.com/amphtml/juliareinstein/teachers-instagram-influencers-school-tpt-Pinterest?__twitter_impression=true
Sawyer, A. G. (2016). Distinguishing high quality mathematical tasks from Pin-terest. Virginia Mathematics Teacher, 42(2), 6-7.
Sawyer, A. G., & Myers, J. (2018). Seeking comfort: How and why preservice teachers use internet resources for lesson planning. Journal of Early Child-hood Teacher Education, 39(1), 16-31.
Stein, M. K., & Smith, M. S. (1998). Mathematical tasks as a framework for reflection: From research to practice. Mathematics teaching in the middle school, 3(4), 268-275.
Stein, M. K., & Smith, M. S. (1998b). Mathematical tasks as a framework for reflection : From research to practice. Mathematics Teaching in the Middle School, 3(4), 268–275.
Stein, M. K., Smith, M. S., Henningsen, M. A., & Silver, E. A. (2000). Imple-menting standards-based mathematics instruction: A casebook for profes-sional development. New York: Teachers College Press.
Wiley, D. A. (2008). The learning objects literature. In J.M. Spector, M.D. Mer-rill, J. Ellen, & M. J. Bishop (Eds.), Handbook of research for educational communications and technology: A project of the association for education-al communications and technology (pp. 345-353). New York: Routledge. Wilhelm, A. G. (2014). Mathematics teachers’ enactment of cognitively
demand-ing tasks: Investigatdemand-ing links to teachers’ knowledge and conceptions. Jour-nal for Research in Mathematics Education, 45(5), 636.
Wismer, T., Dick, L., Shapiro, E. & Sawyer, A. (under review) Considering the quality of elementary mathematics activities on Teachers Pay Teachers.
School Science and Mathematics.
Zohar, A., Dori, Y. J., & Dori, Y. J. (2003). Higher order thinking skills and low-achieving students : Are they mutually exclusive ? Journal of the Learning Sciences, 12(2), 145–181.
APPENDIX A Topic Coding
Math Topic Coding Descriptions and
Reasoning
Example Counting and
Cardinality
If a pin included activities in-cluding one to one correspon-dence, comparing numbers, counting and ordering,
subitiz-ing, numbers,
Card Counting Math Activ-ity for Kids. Retrieved from:
https://www.Pinterest.com/ pin/312437292894985347/ Operations and
Al-gebraic Thinking
If a pin included activities including addition, subtrac-tion, multiplicasubtrac-tion, division,
patterns, even or odd, prime and composite, fact families,
number, bonds
Adding and Subtracting 10 and 100. Retrieved from :https://www.Pinterest.com/
pin/312437292895020850/
Numbers and Operations in Base
Ten
If a pin included activities including on base 10, place value, decomposing numbers, ten frame, rounding, hundreds
chart, number sense
Place Value: 1st Grade Centers - The Brown Bag
Teacher. Retrieved from: https://www.Pinterest.com/ pin/312437292894985851/ Numbers and
Oper-ations-fractions
If a pin included activities including fractions, decimals
Fraction Match Up. Retrieved from: https://www.Pinterest.com/
pin/231583605809087036/ Measurement and
Data
If a pin included activities including graphing, tally markers, time, money, unit conversions, area and perim-eter, angles, measurement, estimation, number line
Graphing and Data Analysis in First grade. Retrieved from: https://www.Pinterest.com/pin/
AcHc3QQz3RCOGVc6M4EX4u- vzzZWKfkiZogE_j7NOuwOgP-shboSiAlf8/
Geometry If a pin included activities
including shapes, symmetry, coordinate plane, sorting,
lines, position words
Geoboard Activity Cards {FREE Geometry Challenge}. Retrieved
from: https://www.Pinterest. com/pin/AUMrOmDpeMM9rIc-mm1zolqCC9VtXZGWKEBlq_ g61YhfAMWhScbLmUx4/ Statistics and
Prob-ability, Rational and Proportional relationships, the number system
If a pin included activities including central tendency, probability, combinations,
percent, integers
Mean Median Mode Range FREE Quiz and Answer Key. Retrieved from: https://www.Pinterest.com/
APPENDIX B
Examples of Pinterest Level of Cognitive Demand Codes Level of
Cognitive Demand
Example from Pinterest
Memorization “Each player gets one flash card and then walks around the room quizzing their classmates. If the players both answer correctly, they swap cards and repeat the process. If either player gets the answer wrong, have the student holding that flashcard give the correct answer before trading.” 5 fun ways to practice math facts. Retrieved from: https://www.Pinterest. com/pin/312437292894985926/
Procedures without con-nections
“Students roll the dice and subtract the numbers. If his/her difference is on the board, he/she covers it with a counter. The first player to cover four numbers in a row is the winner.” Two Digit Subtraction Games. Retrieved from: https://www.Pin- terest.com/pin/ATDeyk0XUXjJQEqUv5M6auQj45eYKOyU-C16LcqwbJPqlYIQha2DxBYo/
Procedures with connec-tions
“The biggest addend comes first and forms the base of the tower. A smaller number is added on top. Children slide the first number and then count on. We used lots of explaining to our learning partner and discussing the process and why it works to ensure that everyone understands.
– Slide and count strategy
– Do children understand what they are doing?.” Active Adding. Retrieved from: https://www.Pinterest.com/pin/ AdmElcjvO-ijUthMDpuxXBSS0q3vs4GPWO1nJ6f9-6B7g-YArXMm7AaE/
Doing math-ematics
“When asking students to solve problems like this, encourage them to show their thinking by adding other “benchmark” numbers rather than simply guessing. Better yet, have them share their thinking so others can learn from different strate-gies.”
5 ways to explore place value. Retrieved from: https://www. Pinterest.com/pin/312437292894985027/
APPENDIX C Example of Pinterest Picture Codes
Picture Codes Examples from Pinterest Decorative
St. Patrick’s Day Math Activities. Retrieved from: https://www. Pinterest.com/pin/312437292894985086/
Functional
5 Fun Ways to Use Math Name Tags. Retrieved from: https:// www.Pinterest.com/pin/312437292894985560/