R E S E A R C H
Open Access
Generalized gene co-expression analysis
via subspace clustering using low-rank
representation
Tongxin Wang
1, Jie Zhang
2and Kun Huang
3,4*FromThe 12th International Conference on Computational Systems Biology (ISB 2018) Guiyang, China. 18-21 August 2018
Abstract
Background: Gene Co-expression Network Analysis (GCNA) helps identify gene modules with potential biological functions and has become a popular method in bioinformatics and biomedical research. However, most current GCNA algorithms use correlation to build gene co-expression networks and identify modules with highly correlated genes. There is a need to look beyond correlation and identify gene modules using other similarity measures for finding novel biologically meaningful modules.
Results: We propose a new generalized gene co-expression analysis algorithm via subspace clustering that can identify biologically meaningful gene co-expression modules with genes that are not all highly correlated. We use low-rank representation to construct gene co-expression networks and local maximal quasi-clique merger to identify gene co-expression modules. We applied our method on three large microarray datasets and a single-cell RNA sequencing dataset. We demonstrate that our method can identify gene modules with different biological functions than current GCNA methods and find gene modules with prognostic values.
Conclusions: The presented method takes advantage of subspace clustering to generate gene co-expression networks rather than using correlation as the similarity measure between genes. Our generalized GCNA method can provide new insights from gene expression datasets and serve as a complement to current GCNA algorithms. Keywords: Gene co-expression network analysis, Subspace clustering, Low-rank representation
Background
Gene Co-expression Network Analysis (GCNA) is a pop-ular method in bioinformatics and biomedical research to construct gene expression networks and detect co-expressed genes. It has been widely utilized in many applications, such as gene function prediction [1–3], dis-ease biomarker discovery [4,5], protein-protein interac-tion (PPI) inference [6] and genetic variants detection in cancers [7,8].
*Correspondence:[email protected]
3Department of Medicine, Indiana University School of Medicine, 46202
Indianapolis, IN, USA
4Regenstrief Institute, 46202 Indianapolis, IN, USA
Full list of author information is available at the end of the article
Many GCNA algorithms have been developed to iden-tify modules of co-expressed genes [3,9–13]. One of the widely used GCNA tools is the WGCNA package devel-oped by Horvath’s group [10], which finds modules of highly correlated genes in weighted gene co-expression networks. Local maximal Quasi-Clique Merger (lmQCM) [13] is another weighted GCNA algorithm that allows overlap between gene modules, which is consistent with the fact that the same gene may participate in multiple biological processes.
Mathematically, given the expression matrix G for K
genes andNsamples
© The Author(s). 2019Open AccessThis article is distributed under the terms of the Creative Commons Attribution 4.0 International License (http://creativecommons.org/licenses/by/4.0/), which permits unrestricted use, distribution, and reproduction in any medium, provided you give appropriate credit to the original author(s) and the source, provide a link to the Creative Commons license, and indicate if changes were made. The Creative Commons Public Domain Dedication waiver (http://creativecommons.org/publicdomain/zero/1.0/) applies to the data made available in this article, unless otherwise stated.
G= ⎡ ⎢ ⎢ ⎣ g1 g2 ... gK ⎤ ⎥ ⎥ ⎦∈ K×N
with giT ∈ N being the expression profile for genei
(i ∈ {1, 2, ...,K}), the geneco-expression network can be represented by a matrix W ∈ K×K, where entry Wi,j represents the co-expression similarity between expres-sion profiles of a pair of genes giand gj(i,j∈ {1, 2, ...,K}).
Commonly, this similarity is measured using correlation coefficients, with Pearson Correlation Coefficient (PCC) or Spearman Correlation Coefficient (SCC) being the most widely used ones [3, 9, 13]. When using PCC to measure co-expression similarity, we obtain gene mod-ules with linearly correlated gene expression profiles. In this case, expression profiles of geneiandj(i = j) from the same co-expression module differ by a scale and a shift, i.e.,
gi=αjgj+βj·11×N (1)
whereαjandβjare scalars. It can be easily shown that the rank of such expression matrix for a co-expression module Gcis 2. In other words, expression profiles for genes in a
co-expression module can be approximated as a subspace with dimensionality of two in aN-dimensional space. In addition, if we designate
¯
gi=gi− ¯gi·11×N
as the centralized version of gi, whereg¯i is the mean of entries in gi, theng¯is from the same co-expression module
can be approximated by a 1-dimensional subspace. However, apart from grouping genes that are linearly correlated into modules, simple relationships such as
gi=αjgj+αkgk+αmgm (2)
where gj, gk and gm are linearly independent and
αj,αk,αm = 0, cannot be captured using the tradi-tional PCC based co-expression formulation. In this case, expression profiles for genei,j,kandmcannot be approx-imated using a 2-dimensional subspace (in this example, they form a 3-dimensional subspace). However, it can be conceived that in biology, such coordinated gene activi-ties may play important roles in complex processes and pathways. Therefore, there is a need to generalize the co-expression formulation to accommodate relationships between genes beyond pairwise relationships.
Discovering gene modules with such coherent relation-ships implies detecting low-dimensional subspaces in a higher dimensional space. Subspace clustering [14] is a research field in signal processing and machine learning for such purpose. The goal of subspace clustering is sepa-rating data according to their underlying subspaces, which could have different dimensionalities that are larger than one. Subspace clustering has found numerous applications
in image processing and computer vision [15–18], as well as in bioinformatics [19–21].
One of the popular approaches for subspace clustering is Sparse Subspace Clustering (SSC) [22]. SSC is based on the affinity matrix defined by the sparsest representation produced byl1-minimization and subspace segmentation using spectral clustering. However, SSC may not be able to capture the global structure of the data accurately, which could affect the performance of the algorithm when data is highly corrupted. However, large biomedical datasets often contain large amount of noise and outliers. In addi-tion, spectral clustering assigns every data point to a certain cluster, which can potentially bias the clustering structure.
Therefore, in this paper, we propose to use Low-Rank Representation (LRR) approach to construct gene co-expression networks from high-throughput gene expres-sion data and use lmQCM to further group genes from the same subspace into gene modules. The lmQCM algorithm is developed by us as an extension of the QCM algorithm. It is a greedy algorithm for identifying highly connected modules in a large network with high efficiency. In addi-tion, it allows overlap between clusters, which fits well with the notion that genes can participate in different functions and pathways.
Comparing to traditional GCNA algorithms based on correlation, our method provides a generalized formula-tion and can be applied to identify gene modules with expression matrices of higher intrinsic dimensionalities. This will help to discover new biological relationships, functions and pathways. Our method can also serve as a complement to current GCNA algorithms. Moreover, since LRR finds the lowest rank representation of all data jointly [18] and the corruption of data will largely increase the rank, LRR is robust to noise and outliers, making it suitable for analyzing high-throughput gene expression data. The contribution of this paper is a generalized gene co-expression network mining approach that is based on subspace clustering and demonstration of the effective-ness of this approach using real biomedical data.
Methods
Subspace clustering of gene expression data using LRR and lmQCM
Consider a data matrix X∈ D×N(each column is a sam-ple) where each sample can be represented by a linear combination of columns in a dictionary A∈ D×M.
X=AZ (3)
Z ∈ M×N is a matrix with thei-th column being the representation of thei-th column in X. Introduced by Liu et al., LRR [18] uses low rankness of a matrix to capture the structure of the data and looks for a representation Z of data X by solving the following problem.
min
Z rank(Z)
s.t. X=AZ
(4) However, due to the discrete nature of the rank function, Problem (4) is difficult to solve. Instead, the following con-vex optimization problem is suggested as a surrogate for Problem (4) by matrix completion methods,
min
Z Z∗
s.t. X=AZ
(5) where·∗is the nuclear norm of a matrix.
In the case of gene expression data, we represent a dataset with K genes and N samples using a matrix G of size
K×N. In order to cluster genes into their respective sub-spaces, we need to compute an affinity matrix encoding the pairwise similarities between genes by using the gene expression matrix itself as the dictionary [18]. We use GT to substitute X in Problem (5) and Problem (5) becomes:
min
Z Z∗
s.t. GT =GTZ
(6) In reality, gene expression data often contains noise that could not be neglected. To take noise into account, we could modify the objective of Problem (6) into
min
Z,E Z∗+λE2,1 s.t. GT =GTZ+E
(7) where λ > 0 is used to balance the effect of low rank-ness and noise. Problem (7) could be solved by solving an Augmented Lagrange Multiplier (ALM) problem using inexact ALM algorithms. After solving Problem (7), we define the adjacency matrix W of a weighted, undirected graph between genes based on the “lowest-rank repre-sentation" Z∗. The weight between gene i andj, Wij, is computed by|Zij∗| + |Z∗ji|. As in [17], to deal with different norms of gene expression levels in G and ensure that the largest weights for all the genes are of the same scale, we also normalize the columns of Z∗as zi=zi/zi∞, where
ziis thei-th column of Z∗.
Once we obtain the weighted network of genes, we need to cluster genes into their respective subspaces and per-form further analysis on gene modules. Instead of using normalized cuts in [18] or spectral clustering in [17], we apply a recently developed weighted network mining algorithm called lmQCM [13]. Unlike normalized cuts or spectral clustering, which partitions genes into dis-joint sets and does not allow overlaps between clusters, lmQCM is a greedy approach that allows genes to be shared among multiple clusters or not included in any cluster. This is consistent with subspace clustering prob-lems where two subspace clusters can share some com-mon genes or some genes may not belong to any subspace
cluster [23]. Also, genes can participate in multiple bio-logical processes, which could be represented by different clusters. Another advantage of lmQCM is that it can find gene co-expression modules potentially associated with Copy Number Variations (CNVs) in cancer development [13]. The lmQCM algorithm has four parametersγ,α,t
andβ.γ determines if a new module can be initiated by setting the weight threshold for the first edge of the mod-ule, and has the largest influence on the results. We use the default setting ofα =1,t = 1,β = 0.4 in this paper and tuneγ empirically.
Our method combines the strength of LRR and lmQCM, which we outline in Algorithm 1.
Algorithm 1Subspace clustering of gene expression data Input:gene expression matrix G, parameterλ,γ
Output: gene co-expression modules C =
{C1, C2, ..., Cm}
1:Pre-process G to select highly expressed genes. 2:Solve Problem (7) by inexact ALM and obtain solu-tion Z∗.
3:Build adjacency matrix W of the gene co-expression network based on Z∗.
4:Apply lmQCM on W to identify gene co-expression modules C.
There are two parameters we need to choose in our method:λfor LRR andγ for lmQCM. In order to choose a set of parameters that is able to produce robust results, we randomly partition the dataset into 10 folds with the same size. Each time we use 9 folds to generate gene modules an d we can get 10 sets of gene modules. We useg10to denote the number of genes that appear in all 10 sets of gene modules and useg1to denote the number of genes that appear in at least one set of gene modules. The value ofg10/g1can indicate the stability of the results under a certain set of parameters. We do not consider the parameters that can only identify less than nMdlthr modules and choose the parameters that can produce the highestg10/g1value. Functional enrichment analysis
Gene set functional enrichment analysis is a method to find biological annotations that are significant in a set of genes. In this study, we use annotations of Gene Ontology Biological Process (GO BP) terms from Gene Ontology Consortium and annotations of chromosome bands of protein coding genes from HGNC database. Hypergeo-metric probability density function from MATLAB Statis-tics and Machine Learning Toolbox with false discovery rate correction from MATLAB Bioinformatics Toolbox is used to determine the statistical significance. To provide
meaningful results, we only perform functional enrich-ment analysis on gene modules with at least 10 genes and at most 500 genes.
For chromosome regions enriched by the identified gene modules, we are interested in if patients in other cohorts with the same disease have CNVs in these regions. We use OncoPrint visualization from the cBioPortal [24] website to investigate the Copy Number Alternations (CNAs) in selected genes. The Cancer Genome Atlas (TCGA) bladder cancer dataset (406 patients) was used to validate chromosome bands enrichment results of GSE31684. TCGA breast cancer dataset (996 patients) and METABRIC [25] breast cancer dataset (2051 patients) were used to validate chromosome bands enrichment results of GSE54002 and GSE102484.
Gene expression data
Three large gene expression datasets were obtained from the NCBI Gene Expression Omnibus (GEO) and all datasets were generated using the Affymetrix Human Genome U133 Plus 2.0 Array Genechip with more than 54,000 probesets. Details of these datasets are summarized in Table1.
To reduce the size of affinity matrix between genes, pre-processing of each dataset is performed to select highly expressed genes. Firstly, only probesets with known asso-ciated genes are selected. If multiple probesets correspond to the same gene, only the probeset with the highest mean expression value is retained. Next, genes with low mean expression levels (bottom 20%) and low variance (bottom 10%) are removed using functions from MATLAB Bioin-formatics Toolbox. Finally, we retain 10,000 genes with the highest mean expression levels for further analysis. Results
LRR finds gene modules with different structures
Centralized Concordance Index (CCI) [26] is a linear alge-braic based index for evaluating the concordance of gene co-expression modules from GCNA. A high CCI value suggests genes in a gene module are highly correlated, while a low CCI value suggests higher intrinsic dimension-ality of expression profiles in a module. For example, when PCC between each pair of genes in a module is 1, CCI of this module is 1.
To compare our method with current correlation based GCNA algorithms, besides LRR, we also used PCC to generate the adjacency matrix of a gene co-expression Table 1Summary of microarray datasets
Dataset Disease Number of samples Platform
GSE31684 bladder cancer 93 GPL570
GSE54002 breast cancer 433 GPL570
GSE102484 breast cancer 683 GPL570
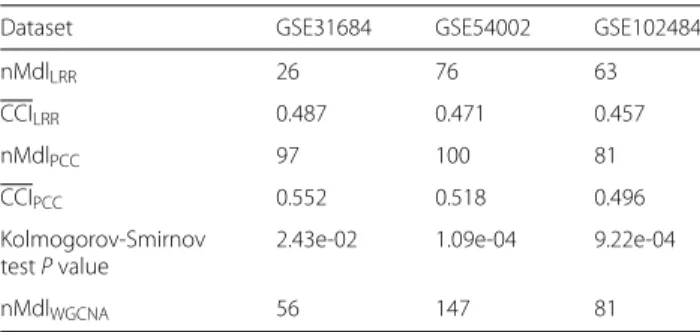
network and applied lmQCM to identify gene co-expression modules. We calculated CCI of each gene module identified using PCC based method and our LRR based method. We observe that gene modules iden-tified by LRR based method have significantly lower CCI values than those identified by PCC based method using Kolmogorov-Smirnov test (Table2). This suggests that LRR, combined with lmQCM, can find gene co-expression modules from subspaces with higher dimen-sionality than current linear correlation based GCNA algorithms.
We also applied one of the state-of-the-art GCNA algorithms, WGCNA [10], for comparison. Since WGCNA partitions all the genes after pre-processing into disjoint sets rather than just identifies highly connected modules, CCI val-ues of modules identified by WGCNA are not comparable with our lmQCM based results and we did not apply Kolmogorov-Smirnov tests on CCI values of identified gene modules between our method and WGCNA. Difference in CCI contributes to difference in enriched biological annotations
In the previous section, we have shown that gene modules identified by LRR based method have different structures from those identified by PCC based method, indicated by lower CCI values. In this section, we further demonstrate that such difference could lead to different enrichment results in biological annotations, such as GO BPs and chromosome bands. This suggests that our method is able to provide different biological insights than current corre-lation based GCNA algorithms and serve as a complement to current methods.
We first compare three similar gene co-expression mod-ules identified in GSE54002 dataset: LRR21identified by our method, PCC30identified by PCC based method and
WGCNA44 identified by WGCNA. These three
mod-ules share a large fraction of the same genes and a Venn diagram of genes in these modules is shown in Fig.1.
Figure1also shows heatmaps of gene expression pro-files in these three modules. Expression levels of each gene have been standardized across different samples in Table 2Gene modules identified by LRR, PCC and WGCNA
Dataset GSE31684 GSE54002 GSE102484
nMdlLRR 26 76 63 CCILRR 0.487 0.471 0.457 nMdlPCC 97 100 81 CCIPCC 0.552 0.518 0.496 Kolmogorov-Smirnov testPvalue
2.43e-02 1.09e-04 9.22e-04
nMdlWGCNA 56 147 81
nMdl: number of gene modules identified CCI: mean of CCI values of gene modules identified
Fig. 1Comparison between LRR21, PCC30and WGCNA44in GSE54002.a. Venn diagram of genes in LRR21, PCC30and WGCNA44;b-d. Heatmaps of
expression profiles of LRR21, PCC30and WGCNA44. Red bars beside gene symbols indicate genes on 9q34.11
order to show the correlation patterns between genes. We observe that PCC30 and WGCNA44show a stronger correlation pattern between genes than LRR21, which is confirmed by higher CCI values (Table3). However, some biological annotations are more enriched in LRR21than in PCC30or WGCNA44. For example, Table3shows chro-mosome band 9q34.11 is more enriched in LRR21withP value= 2.01×10⁻²⁶. Figure2further shows that genes
on the enriched 9q34.11 chromosome band in LRR21
Table 3Summary of LRR21, PCC30and WGCNA44in GSE54002
Module LRR21 PCC30 WGCNA44
number of genes 37 21 40
CCI 0.385 0.486 0.420
number of genes on 9q34.11 14 2 10
Pvalue of enrichment analysis of 9q34.11 2.01e-26 2.38e-3 4.57e-17
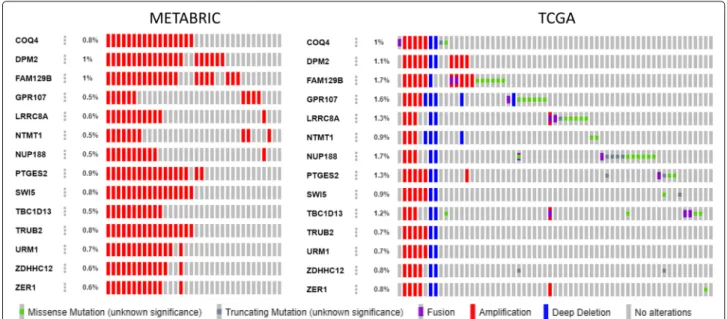
share similar CNV patterns in the TCGA and METABRIC breast cancer patient cohorts.
The aforementioned results suggest that by using LRR and allowing expression profiles of gene modules to have higher subspace dimensionality, we can identify biological annotations such as chromosome bands that are missed by correlation based GCNA algorithms. This may fur-ther lead to new discoveries of cancer-related structural mutations such as CNVs. Figure 3provides the number of enriched GO BPs and chromosome bands using LRR, PCC based methods and WGCNA with a 0.01Pvalue cut-off. Our method not only produces results with substan-tial overlap between current GCNA methods in finding enriched biological annotations, but can also discover new related biological annotations. Such advantages give our method the potential to be combined with current GCNA methods to a get better understanding of gene expres-sion data. Tables4and5list the most significant GO BPs
Fig. 2OncoPrint visualization of breast cancer patients with genetic mutations. Genes are from LRR21which are also on 9q34.11
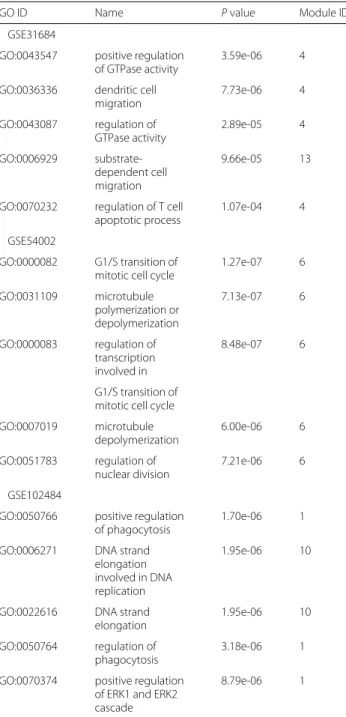
Table 4The most significant GO BPs only enriched in our method
GO ID Name Pvalue Module ID
GSE31684
GO:0043547 positive regulation of GTPase activity
3.59e-06 4 GO:0036336 dendritic cell
migration 7.73e-06 4 GO:0043087 regulation of GTPase activity 2.89e-05 4 GO:0006929 substrate-dependent cell migration 9.66e-05 13
GO:0070232 regulation of T cell apoptotic process
1.07e-04 4 GSE54002
GO:0000082 G1/S transition of mitotic cell cycle
1.27e-07 6 GO:0031109 microtubule polymerization or depolymerization 7.13e-07 6 GO:0000083 regulation of transcription involved in 8.48e-07 6 G1/S transition of mitotic cell cycle GO:0007019 microtubule depolymerization 6.00e-06 6 GO:0051783 regulation of nuclear division 7.21e-06 6 GSE102484
GO:0050766 positive regulation of phagocytosis
1.70e-06 1 GO:0006271 DNA strand
elongation involved in DNA replication
1.95e-06 10
GO:0022616 DNA strand elongation
1.95e-06 10 GO:0050764 regulation of
phagocytosis
3.18e-06 1 GO:0070374 positive regulation
of ERK1 and ERK2 cascade
8.79e-06 1
Pvalue cutoff = 0.01
and chromosome bands that are only enriched when using our method.
We also observe that for most chromosome bands that are only enriched in our method, genes on these chromo-some bands in the corresponding co-expression modules often share similar CNV patterns among patients in the TCGA and METABRIC cohorts.
We also compare overlap of enrichment analysis results between two breast cancer datasets, GSE54002 and GSE102484, using different GCNA methods, which is
Table 5The most significant chromosome bands only enriched in our method
Chromosome band Pvalue Module ID CNVs validated in separate cohorts(TCGA, METABRIC) GSE31684
4q13.3 2.47e-06 13 Yes,NA
Yp11.2 8.25e-04 12 No,NA
Yq11.223 8.25e-04 12 No,NA
4q21.1 8.35e-04 4 Yes,NA 19p13.12 1.25e-03 5 No,NA GSE54002 11p15.1 1.92e-12 44 Yes,Yes 11q12.2 1.61e-06 19 Yes,Yes 19q13.31 1.03e-05 61 Yes,Yes 9q31.3 2.12e-05 26 No,Yes 9q22.33 2.28e-05 26 No,Yes GSE102484 8p11.23 3.97e-19 53 Yes,Yes 9q34.3 1.36e-09 14 Yes,Yes 15q22.31 4.21e-09 27 Yes,Yes 13q14.3 2.27e-08 18 Yes,Yes 7q36.3 4.12e-08 7 Yes,Yes Pvalue cutoff = 0.01
shown in Fig. 4. We observe that LRR and PCC based methods obtain similar fractions of overlap between two datasets, which indicates that our LRR based approach can achieve similar stability with the commonly used PCC based methods. WGCNA produced results with larger overlaps, which may be due to the fact that gene mod-ules detected by WGCNA contains all the genes after pre-processing rather than just densely connected gene modules as in lmQCM. Since information of specific sub-types of breast cancer are unavailable for GSE54002 and GSE102484 on GEO, the difference of the enrichment analysis across these two datasets may come from the difference in breast cancer subtypes.
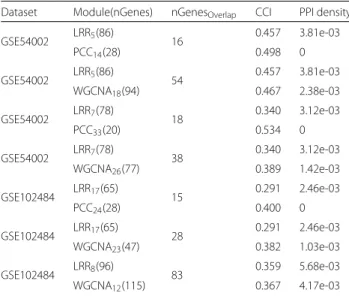
Difference in CCI contributes to difference in PPI networks To further validate our method, we use PINA2 plat-form [27] to verify whether LRR could identify gene co-expression modules that form PPI networks with dif-ferent density. We use the Homo sapiens PPIs database from PINA2 website and map UniProtKB entries to gene symbols through UniProt website (uniprot.org). For a gene co-expression module with n genes and nPPI PPIs within the module, we define PPI density of the module as 2nPPI/(n(n+1))since the PINA2 database allows a protein to interact with itself. We found several cases where mod-ules identified by LRR have lower CCI values and higher
Fig. 4Number of overlapping enriched GO BPs and chromosome bands. GSE54002 and GSE102484 are two breast cancer datasets
PPI densities than those identified by PCC or WGCNA. Some examples are shown in Table6. This suggests that by identifying gene co-expression modules with higher intrinsic dimensionalities, we can find modules that are more densely connected in PPI networks, which indicates that genes in these modules share more similarities in biological functions.
LRR helps identify prognostic gene modules
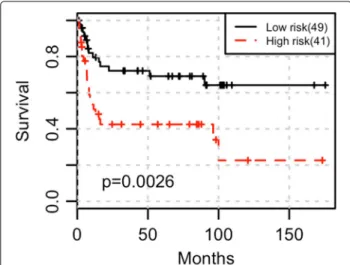
To determine whether a gene module has prognostic value, we use a lasso-regularized Cox proportional haz-ards model to calculate the risk index of each sample based on the expression profiles of the gene module. A leave-one-out cross validation strategy is used to validate our method, where each sample is used as a test sample and classified into a low-risk or a high-risk group. We then use Kaplan-Meier estimator and log-rank test to determine if these two groups have significantly distinct survival. We applied this method on GSE31684, using rence free survival months as survival time and recur-rence/dod events as censoring information. We removed samples with survival time less than one month from analysis.
Table 6Examples of modules identified by our method with lower CCIs and higher PPI densities
Dataset Module(nGenes) nGenesOverlap CCI PPI density
GSE54002 LRR5(86) 16 0.457 3.81e-03 PCC14(28) 0.498 0 GSE54002 LRR5(86) 54 0.457 3.81e-03 WGCNA18(94) 0.467 2.38e-03 GSE54002 LRR7(78) 18 0.340 3.12e-03 PCC33(20) 0.534 0 GSE54002 LRR7(78) 38 0.340 3.12e-03 WGCNA26(77) 0.389 1.42e-03 GSE102484 LRR17(65) 15 0.291 2.46e-03 PCC24(28) 0.400 0 GSE102484 LRR17(65) 28 0.291 2.46e-03 WGCNA23(47) 0.382 1.03e-03 GSE102484 LRR8(96) 83 0.359 5.68e-03 WGCNA12(115) 0.367 4.17e-03
nGenes: number of genes in the module nGenesOverlap: number of genes in both modules
Fig. 5Kaplan-Meier curve of two groups of samples stratified using gene module LRR2in GSE31684. GSE31684 is a bladder cancer dataset
Figure5shows that gene co-expression module LRR2, which contains 189 genes, is strongly associated with sur-vival (P value= 0.00260). Although gene module PCC2 identified by PCC based method has substantial overlap with LRR2 (PCC2 contains 268 genes, where 101 genes are also in LRR2), it is not significantly associated with survival (Pvalue=0.200).
Application to single-cell RNA sequencing data
Single-cell RNA sequencing (scRNA-seq) techniques have provided powerful tools in studying cellular heterogene-ity. In this section, we demonstrate that our method can be extended to scRNA-seq data by applying it on a large scRNA-seq dataset of melanoma cells (GSE72056) [28]. GSE72056 contains 1257 malignant cells, 3256 non-malignant cells and 132 unresolved cells with expression profiles of 23,686 genes. Only the malignant cells were used for gene co-expression analysis.
Expression level of gene i in cell j is quantified as
Gij=log2(TPMij/10+1), where TPMijis Transcript-Per-Million (TPM) for geneiin cellj. In scRNA-seq, dropout
event often occurs due to the low number of RNA tran-scriptomes, which means that expression measurements of some random sampling of transcripts can be missed as zeroes. To account for the dropout events and noise in scRNA-seq data, a different pre-processing method was applied. Firstly, we remove genes with zero expression lev-els in all cells. Then, we filter out genes with the lowest 80% of mean expression level or genes with the lowest 80% of variance. In GSE72056, 3630 genes were retained after pre-processing.
In total, 18, 11 and 16 gene co-expression modules were identified by our method, PCC based lmQCM and WGCNA respectively. Figure 6 provides the number of enriched GO BPs and chromosome bands with a 0.01
P value cutoff. Similar to results in microarray datasets, our method produces results with substantial overlap with existing GCNA methods, while demonstrating the abil-ity to discover new related biological annotations. Table7
and Table 8list the most significant GO BPs and chro-mosome bands that are only enriched when using our method. TCGA skin cutaneous melanoma dataset (363 patients) was used to validate chromosome bands enrich-ment results. We observe that a large number of patients (3% - 9%) in the TCGA cohort have CNVs in genes on the chromosome bands that are uniquely enriched by our method.
Similar to results in microarray datasets, we also observe that difference in CCI values of gene co-expression modules can contributes to difference in enriched biological annotations and density of PPI
net-works in scRNA-seq data. For example, module LRR2
(112 genes, CCI = 0.282) and module PCC3 (95 genes, CCI = 0.324) have large overlap with 45 genes in com-mon. However, GO:0044237 (cellular metabolic process) is more enriched in LRR2(Pvalue 5.85e-42 vs. 2.84e-31) and LRR2has higher PPI density (0.0786 vs. 0.0708). Discussion
In this paper, we present a new approach for generalizing the traditional correlation-based GCNA methods beyond
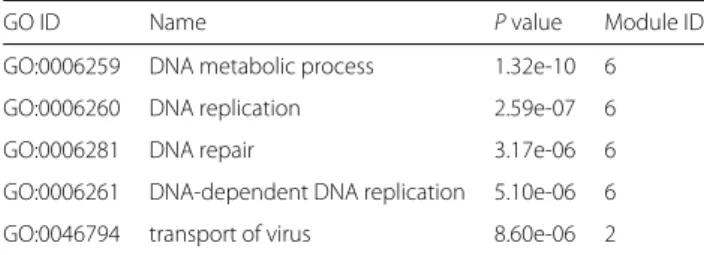
Table 7The most significant GO BPs only enriched using our method in GSE72056
GO ID Name Pvalue Module ID
GO:0006259 DNA metabolic process 1.32e-10 6 GO:0006260 DNA replication 2.59e-07 6
GO:0006281 DNA repair 3.17e-06 6
GO:0006261 DNA-dependent DNA replication 5.10e-06 6 GO:0046794 transport of virus 8.60e-06 2 Pvalue cutoff = 0.01
pairwise relationships between genes. This generalized GCNA method greatly expands the scope for explor-ing complex relationships among genes. This approach combines a subspace clustering algorithm, LRR, with a weighted network mining algorithm, lmQCM, and makes two major improvements comparing with previous meth-ods. Firstly, comparing with current GCNA algorithms, which mostly calculates the similarity between genes based on pairwise correlation coefficients, we introduce subspace clustering into GCNA to find new biologically meaningful gene modules that can not be characterized based on pairwise relationships. Since the LRR approach does not limit the dimensionality of the subspace, it can accommodate complex relationships which often imply multiple gene or pathway interactions or more variable structural variations. Secondly, comparing with current subspace clustering algorithms in [17, 18], which assign every gene into a cluster, we choose to use lmQCM, which identifies densely connected modules such as quasi-cliques in weighted networks. Our method is more con-sistent with the fact that some genes could participate in multiple biological processes. In addition, our method can be applied to different kinds of gene expression data, including microarray data and scRNA-seq data.
Despite the advantages demonstrated in this paper, there still exists limitations in our method. As mentioned in [29], when using the data itself as the dictionary, LRR may not be able to exactly recover the subspaces when data contains certain types of errors, such as dense noise. Moreover, a critical issue of LRR is how to estimate or
Table 8The most significant chromosome bands only enriched using our method in GSE72056
chromosome band Pvalue Module ID
5p15.33 1.41e-06 18 6p22.1 3.44e-05 15 17q11.2 8.46e-05 11 17q11-q12 1.83e-03 11 6q24.1-q24.2 1.83e-03 11 Pvalue cutoff = 0.01
select the parameter λ. When data is contaminated by various errors, the selection of λ could be quite chal-lenging. We used a cross-validation style approach to overcome this challenge. However, our approach is quite computationally expensive and efficient ways for parame-ter estimation should be studied in the future.
Conclusion
In conclusion, we developed a new generalized gene co-expression analysis algorithm based on subspace clus-tering that works beyond pairwise relationships between genes. Correlations between genes have been shown to be very useful in identifying gene co-expression modules with biological meanings. However, our method provides a complement to existing GCNA methods by using subspace clustering to identify gene co-expression mod-ules with expression profiles of higher intrinsic dimen-sionalities. We demonstrate that our method can be applied to various types of gene expression data, includ-ing microarray data and the emerginclud-ing scRNA-seq data. By combining our method with other GCNA tools, we can obtain a more comprehensive understanding of gene expression data.
Abbreviations
ALM: Augmented lagrange multiplier; CCI: Centralized concordance index; CNA: Copy number alternation; CNV: Copy number variation; GCNA: Gene co-expression network analysis; GEO: Gene expression omnibus; GO BP: Gene ontology biological process; lmQCM: Local maximal quasi-clique merger; LRR: Low-rank representation; PCC: Pearson correlation coefficient; PPI:
Protein-protein interaction; SCC: Spearman correlation coefficient; scRNA-seq: Single-cell RNA sequencing; SSC: Sparse subspace clustering; TCGA: The cancer genome atlas; TPM: Transcript-per-million
Acknowledgements
Not applicable.
Funding
This work is partially supported by IUSM startup fund, the NCI ITCR U01 (CA188547) and Indiana University Precision Health Initiative. Publication costs are funded by Indiana University Precision Health Initiative.
Availability of data and materials
All the datasets can be accessed through Gene Expression Omnibus. The code is available athttps://github.com/txWang/generalized_GCNA.
About this supplement
This article has been published as part ofBMC Bioinformatics Volume 20 Supplement 7, 2019: Selected papers from the 12th International Conference on Computational Systems Biology (ISB 2018). The full contents of the supplement are available online athttps://bmcbioinformatics.biomedcentral.com/articles/ supplements/volume-20-supplement-7.
Authors’ contributions
Conceived and designed the experiments: TW, KH. Performed the experiments and analyzed the data: TW, JZ. Developed the structure and arguments for the paper: TW, JZ, KH. Drafted the manuscript: TW, KH. Edited the manuscript: JZ, KH. All the authors reviewed and approved of the final manuscript.
Ethics approval and consent to participate
Not applicable.
Consent for publication
Competing interests
The authors declare that they have no competing interests.
Publisher’s Note
Springer Nature remains neutral with regard to jurisdictional claims in published maps and institutional affiliations.
Author details
1Department of Computer Science, Indiana University Bloomington, 47408
Bloomington, IN, USA.2Department of Medical and Molecular Genetics,
Indiana University School of Medicine, 46202 Indianapolis, IN, USA.
3Department of Medicine, Indiana University School of Medicine, 46202
Indianapolis, IN, USA.4Regenstrief Institute, 46202 Indianapolis, IN, USA.
Published: 1 May 2019 References
1. Pujana MA, Han J-DJ, Starita LM, Stevens KN, Tewari M, Ahn JS, Rennert G, Moreno V, Kirchhoff T, Gold B, et al. Network modeling links breast cancer susceptibility and centrosome dysfunction. Nat Genet. 2007;39(11):1338. 2. Kais Z, Barsky SH, Mathsyaraja H, Zha A, Ransburgh DJ, He G, Pilarski RT,
Shapiro CL, Huang K, Parvin JD. KIAA0101 interacts with BRCA1 and regulates centrosome number. Mol Cancer Res. 2011;9(8):1091–1099. 3. Zhang J, Lu K, Xiang Y, Islam M, Kotian S, Kais Z, Lee C, Arora M, Liu H-w,
Parvin JD, et al. Weighted frequent gene co-expression network mining to identify genes involved in genome stability. PLoS Comput Biol. 2012;8(8):1002656.
4. MacLennan NK, Dong J, Aten JE, Horvath S, Rahib L, Ornelas L, Dipple KM, McCabe ER. Weighted gene co-expression network analysis identifies biomarkers in glycerol kinase deficient mice. Mol Genet Metab. 2009;98(1):203–14.
5. Zhang J, Xiang Y, Ding L, Borlawsky TB, Ozer HG, Jin R, Payne P, Huang K, et al. Using gene co-expression network analysis to predict biomarkers for chronic lymphocytic leukemia. BMC Bioinformatics. 2010;11 (Suppl 9):5. 6. Zhao J, Hu X, He T, Li P, Zhang M, Shen X. An edge-based protein
complex identification algorithm with gene co-expression data (pcia-geco). IEEE Trans Nanobioscience. 2014;13(2):80–88. 7. Zhang J, Ni S, Xiang Y, Parvin JD, Yang Y, Zhou Y, Huang K. Gene
co-expression analysis predicts genetic aberration loci associated with colon cancer metastasis. Int J Comput Biol Drug Des. 2013;6(1-2):60–71. 8. Xu Y, DuanMu H, Chang Z, Zhang S, Li Z, Li Z, Liu Y, Li K, Qiu F, Li X.
The application of gene co-expression network reconstruction based on cnvs and gene expression microarray data in breast cancer. Mol Biol Rep. 2012;39(2):1627–37.
9. Hu H, Yan X, Huang Y, Han J, Zhou XJ. Mining coherent dense subgraphs across massive biological networks for functional discovery. Bioinformatics. 2005;21(12(Suppl 1)):213–21.
10. Langfelder P, Horvath S. Wgcna: an r package for weighted correlation network analysis. BMC Bioinformatics. 2008;9(1):559.
11. Li A, Horvath S. Network module detection: Affinity search technique with the multi-node topological overlap measure. BMC Res Notes. 2009;2:142. 12. Xiang Y, Zhang C-Q, Huang K. Predicting glioblastoma prognosis
networks using weighted gene co-expression network analysis on tcga data. BMC Bioinformatics. 2012;13(Suppl 2):12.
13. Zhang J, Huang K. Normalized imqcm: An algorithm for detecting weak quasi-cliques in weighted graph with applications in gene co-expression module discovery in cancers. Cancer Inf. 2014;13s3:14021.
14. Vidal R. Subspace clustering. IEEE Signal Proc Mag. 2011;28(2):52–68. 15. Hong W, Wright J, Huang K, Ma Y. Multiscale hybrid linear models for
lossy image representation. IEEE Trans Image Proc. 2006;15(12):3655–71. 16. Yang AY, Wright J, Ma Y, Sastry SS. Unsupervised segmentation of
natural images via lossy data compression. Computer Vision and Image Understanding. 2008;110(2):212–225.
17. Elhamifar E, Vidal R. Sparse subspace clustering: Algorithm, theory, and applications. IEEE Trans Pattern Anal Mach Intell. 2013;35(11):2765–81. 18. Liu G, Lin Z, Yu Y. Robust subspace segmentation by low-rank
representation. In: Proceedings of the 27th International Conference on Machine Learning; 2010. p. 663–670.
19. Cheng Y, Church GM. Biclustering of expression data. Proc Int Conf Intell Syst Mol Biol. AAAI. 2000;8:93–103.https://www.ncbi.nlm.nih.gov/ pubmed/10977070.
20. Getz G, Levine E, Domany E. Coupled two-way clustering analysis of gene microarray data. Proc Natl Acad Sci. 2000;97(22):12079–84. 21. Lazzeroni L, Owen A. Plaid models for gene expression data. Stat Sin.
2002:61–86.https://www.jstor.org/stable/2430703.
22. Elhamifar E, Vidal R. Sparse subspace clustering. In: 2009 IEEE Conference on Computer Vision and Pattern Recognition. IEEE; 2009. p. 2790–2797. 23. Jiang D, Tang C, Zhang A. Cluster analysis for gene expression data: a
survey. IEEE Trans Knowl Data Eng. 2004;16(11):1370–86.
24. Gao J, Aksoy BA, Dogrusoz U, Dresdner G, Gross B, Sumer SO, Sun Y, Jacobsen A, Sinha R, Larsson E, et al. Integrative analysis of complex cancer genomics and clinical profiles using the cbioportal. Sci Signal. 2013;6(269):1–1.
25. Curtis C, Shah SP, Chin S-F, Turashvili G, Rueda OM, Dunning MJ, Speed D, Lynch AG, Samarajiwa S, Yuan Y, et al. The genomic and transcriptomic architecture of 2,000 breast tumours reveals novel subgroups. Nature. 2012;486(7403):346.
26. Han Z, Zhang J, Sun G, Liu G, Huang K. A matrix rank based concordance index for evaluating and detecting conditional specific co-expressed gene modules. BMC genomics. 2016;177(Suppl 7):519. 27. Cowley MJ, Pinese M, Kassahn KS, Waddell N, Pearson JV, Grimmond SM,
Biankin AV, Hautaniemi S, Wu J. Pina v2 0: mining interactome modules. Nucleic Acids Res. 2011;40(D1):862–5.
28. Tirosh I, Izar B, Prakadan SM, Wadsworth MH, Treacy D, Trombetta JJ, Rotem A, Rodman C, Lian C, Murphy G, et al. Dissecting the multicellular ecosystem of metastatic melanoma by single-cell rna-seq. Science. 2016;352(6282):189–96.
29. Liu G, Lin Z, Yan S, Sun J, Yu Y, Ma Y. Robust recovery of subspace structures by low-rank representation. IEEE Trans Pattern Anal Mach Intell. 2013;35(1):171–84.