http://www.sciencepublishinggroup.com/j/jeee doi: 10.11648/j.jeee.20170505.16
ISSN: 2329-1613 (Print); ISSN: 2329-1605 (Online)
Detection of Power Quality Disturbances Using Empirical
Wavelet Transform and Hilbert Transform
Chen Xiaojing
1, 2, *, Li Kaicheng
1, Meng Qingxu
1, Cai Delong
1, Luo Yi
11
State Key Laboratory of Advanced Electromagnetic Engineering and Technology, Huazhong University of Science and Technology, Wuhan, China
2
College of Electronic and Information, Yangtze University, Jingzhou, China
Email address:
[email protected] (Chen Xiaojing), likaicheng@ hust.edu.cn (Li Kaicheng)
*Corresponding author
To cite this article:
Chen Xiaojing, Li Kaicheng, Meng Qingxu, Cai Delong, Luo Yi. Detection of Power Quality Disturbances Using Empirical Wavelet Transform and Hilbert Transform. Journal of Electrical and Electronic Engineering. Vol. 5, No. 5, 2017, pp. 192-197. doi: 10.11648/j.jeee.20170505.16 Received: October 23, 2017; Accepted: November 2, 2017; Published: December 6, 2017
Abstract:
With the increasingly penetration of nonlinear loads in the power system, power quality (PQ) has become a significant issue for the power utilities and end users. In order to improve the PQ, the PQ detection is essential. In this paper, a new method for detecting the PQ disturbances via empirical wavelet transform (EWT) and Hilbert (HT) is proposed. Firstly, EWT is applied to the signal for obtaining different modes. Then the instantaneous amplitude and frequency of each mode are calculated by using the HT. By applying it to two stationary signals and two non-stationary signals, the efficiency of the proposed method is evaluated. With no frequency aliasing like the S transform (ST), the proposed method presents more accurate results than the ST.Keywords:
Power Quality Disturbances, Detection, Empirical Wavelet Transform, Hilbert1. Introduction
Power quality (PQ) refers to the particular electromagnetic phenomenon that the voltage or current of power grid deviates from the ideal sinusoidal waveform. These deviations account for the appearance of insulation failures of power equipment, control equipment malfunctions or line outages, which results in the huge economic loss of power users. The wide spread use of nonlinear loads such as the power electronic converters, electric arc furnaces and so on, leads to the PQ deterioration [1]. In order to improve the PQ, the PQ detection is of great importance since the disturbance sources can identified then wiped off by analyzing the PQ detection results.
The mostly used methods for detecting the PQ disturbances include discrete Fourier transform (DFT) [2], wavelet transform (WT) [2-4], S transform (ST) [1, 5, 6], empirical mode decomposition (EMD) [7, 8] and so on. DFT is an efficient tool for analyzing the stationary signals but it is not suitable for analyzing the non-stationary signals due to lack of time information. WT decomposes the signal into several non-uniform frequency bands, which results in the inaccurate
estimations of harmonics and interharmonics. Moreover, the predefined filters are not suitable for analyzing all types of real disturbed signals. ST adopts the scalable, movable and frequency-dependent time window and provides the visual 3D time frequency representation of the signal. ST has been successfully used to detect and classify the PQ disturbances [9, 10]. However, ST has the drawback of frequency aliasing caused by the stiff window width that is inversely proportional to the frequency, which results in the inaccurate estimation of harmonics and interharmonics. An adaptive method for decomposing the non-stationary signals, EMD, has been proposed to analyze the power quality disturbances. Nevertheless, the mode mixing leads it difficult to identify all real modes in the analyzed signal.
parameters such as the amplitude and frequency of each component, which are important for the PQ disturbances analysis was not involved. This paper proposes to use the EWT for detecting these disturbance parameters. Some satisfactory results were obtained.
2. Empirical Wavelet Transform
EWT is a new adaptive wavelet filter bank proposed by French scholar, Gilles. In EWT, the signal f(t) can be regarded as a finite sum of N+1 amplitude modulated-frequency modulated function (AM-FM), fk(t), (k: 0,…,N), which can be
written as follows,
N
0
( ) k( )
k
f t f t
=
=
∑
( ) ( ) cos( ( ))
k k k
f t =F t
ϕ
twhere Fk (t), φk’(t)>0 (1)
These AM-FMs present some characteristics such as high amplitude and compact support in the Fourier spectrum. In order to extract these AM-FM modes, an adaptive EWT filter bank is constructed based on where the analyzed signal is located in the spectrum. The steps to carry out EWT are as follows:
Step 1) Acquire the discrete signal f(n) and the number of AM-FM modes is initialized to N.
Step 2) Obtain the Fourier spectrum of the signal f(n) and search it for the local maxima. If M maxima are found and M is less than N, reset N to M.
Step 3) Separate the Fourier spectrum into N segments and define the boundaries ωi(i=1,…, N-1) of each segment as the
center between two consective maxima.
Step 4) Based on the filter boundaries ωi, the empirical
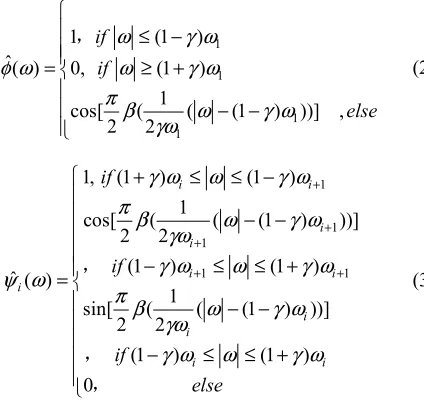
scaling function φ ωˆ( ) and the empirical wavelets ˆ ( )ψ ωi
are defined by expressions of (2) and (3), respectively.
1 1
1 1
1 (1 )
ˆ( ) 0, (1 ) 1
cos[ ( ( (1 ) ))] , 2 2
if
if
else
ω γ ω
φ ω ω γ ω
π β ω γ ω
γω ≤ − = ≥ + − − , (2) 1 1 1 1 1
1, (1 ) (1 ) 1
cos[ ( ( (1 ) ))] 2 2
(1 ) (1 )
ˆ ( )
1
sin[ ( ( (1 ) ))] 2 2
(1 ) (1 ) 0 i i i i i i i i i i i if if if else
γ ω ω γ ω
π β ω γ ω
γω
γ ω ω γ ω
ψ ω
π β ω γ ω
γω
γ ω ω γ ω
+ + + + + + ≤ ≤ − − − − ≤ ≤ + = − − − ≤ ≤ + , , , (3) where
(
)
4 2 3
1, 1
35 84 70 0 ( 20 , 0 ) if x
x if x
x x x x else
β ≥ ≤ = − − + , (4)
γ is the ratio of the transition bandwidth to the cutoff frequency and its range is restrained to
γ<min( 1 1
i i i i
ω ω
ω++ ω
−
+ )|i=1,2,…N-1,ωN=π (5)
Figure 1 shows an example of a Fourier partitioning of an empirical filter bank. The red line is the Fourier spectrum of an analyzed signal and blue lines are the Fourier transforms of the scaling function ˆ( )φ ω and the wavelet function
ˆ ( )i
ψ ω . The number of modes N is 4 and γ is 0.1. It can be clearly seen that the Fourier spectrum of the signal is divided into four segments. EWT filter boundaries are the limits between each segments. Therefore, we can construct a EWT filter bank adaptively based on the Fourier spectrum of the signal. This explains why EWT has an advantage in estimations of harmonics and interharmonics over the other window integral based methods such as WT and ST.
Step 5) In the same way as for the classic wavelet transform, the approximation coefficients Wa
ε
(t) are given by the inner product of the signal f(t) and the scaling function ϕ(t) and the detail coefficients Wd,i
ε
(t) (i=1,…,N-1), given by the inner product with the empirical wavelets ψi(t):
Waε(t) =< f(t),ϕ(t)>=IFFT( ( )F ω φ ω× ˆ( )) (6)
Wd,i ε
(t) =<f(t),ψi(t)>=IFFT( ( )F ω ψ ω× ˆi( )) (7)
where F(ω) is the Fourier transform of f(t) and IFFT represents the inverse Fourier transform.
Figure 1. Example of Fourier partitioning of an empirical filter bank.
Unlike the coefficients of the classic wavelet transform which has no clear physical meaning, the empirical wavelet coefficients directly represent the AM-FM modes in the signal. EWT behaves like EMD which can decompose a signal into some specific modes. However, it has no problems such as the time-consuming and iterative process and the mode mixing.
3. Hilbert Transform
Hilbert Transform (HT) to each AM-FM mode extracted by EWT method. The HT of the function f(t)is defined as (8):
1 ( )
( ) . .
f
f
H t p v d
t τ τ
π τ
+∞
−∞ =
−
∫
(8)where, p.v. represents the Cauchy principal value integral. The HT can be used to derive the analytic signal fa(t):
( ) ( ) ( ) ( ) ( ) jI t
a f
f t = f t +iH t =IA t e θ (9)
where, IA(t) and Iθ(t) are the instantaneous amplitude and phase calculated by (10) and (11), respectively.
2 2
( ) ( ) f ( )
IA t = f t +H t (10)
1 ( )
( ) tan ( ) ( )
f
H t I t
f t
θ = − (11)
The instantaneous frequency IF(t) is obtained by evaluating the derivative of phase Iθ(t) as (12)
1 ( ( )) ( )
2
d I t IF t
dt
θ π
= (12)
4. Case Study Analysis
The performance of the proposed EWT-HT method was tested using the simulated waveforms generated by MATLAB. Four cases which include harmonics and interharmonics, flicker, oscillatory transient and simultaneous disturbance are considered. In addition, the analysis results obtained by EWT-HT and ST are compared to demonstrate the advantage of the EWT-HT method.
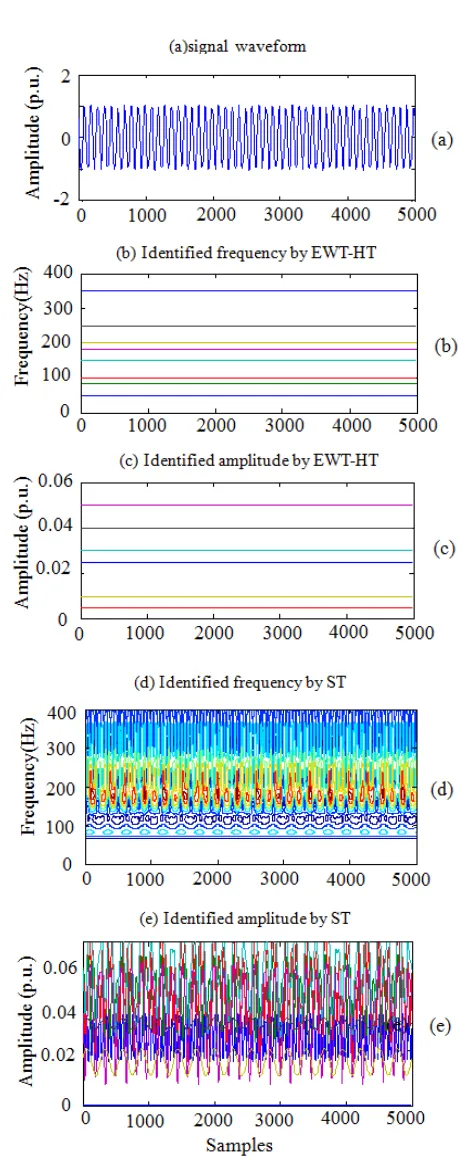
4.1. Harmonics and Interharmonics
The synthetic signal is generated by
( ) cos(2 50 / 3) 0.03 cos(2
82 / 4) 0.005 cos(2 100
/ 5) 0.03 cos(2 150 ) 0.05
cos(2 182 2 ) 0.01cos(2 200
) 0.04 cos(2 250 / 8)
cos(2 350 / 4)
x n n T +
n T n T
n T - /6 +
n T /5 +
n T /3 n T +
+0.025 n T
π π π
π π
π π π
π π π
π π π
π π
= × × ∆ +
× × ∆ + + × × ∆
− + × × ∆
× × ∆ + ×
× ∆ − + × × ∆
× × ∆ −
(13)
The signal is sampled at the sampling interval △T=0.2ms to obtain 5000 sampling points. The analyzed waveform and the associated instantaneous amplitude and frequency obtained from the EWT-HT and ST are given in Figure 2. It is noted that the fundamental amplitude is not shown because of its large value.
It is observed in Figure 2(b)-(c) that the EWT-HT can accurately obtain the amplitude and frequency of each component in the signal. However, Figure 2(d)-(e) show the frequency aliasing in ST is so serious that it is difficult to identify different components.
Figure 2. Detection of harmonics and interharmonics.
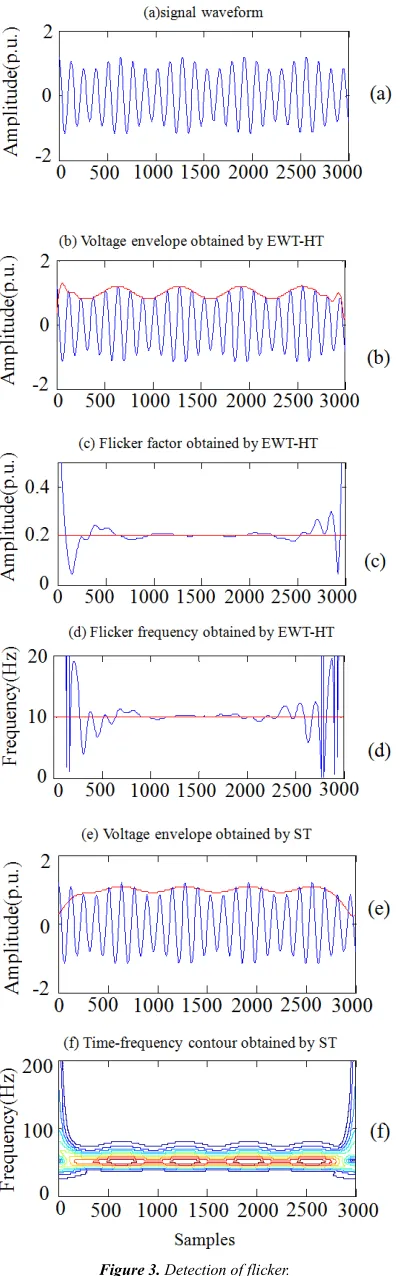
4.2. Flicker
From an electrical point of view, flicker is known as the voltage fluctuation which is the systematic variation of the voltage envelope. The flicker signal is modeled as a modulation of the fundamental frequency waveform as (14)
( ) (1 f cos(2 f )) cos(2 50 )
Figure 3. Detection of flicker.
where, Mf is the flicker factor and ff the flicker frequency. In this test, Mf and ff are 0.2 and 10Hz, respectively. The
sampling frequency is 6.4kHz and the total number of samples is 3000.
The flicker waveform is shown in Figure 3(a). In Figure 3(b), the red line represents the extracted voltage envelope by EWT- HT. It matches the waveform well except for the skewness at both ends. Further, HT is applied to the extracted voltage envelope and Mf and ff are obtained as shown in Figure 3(c) and Figure 3(d). Obviously, the EWT-HT method gives the accurate estimations of the flicker factor and frequency. In comparison with Figure 3(b), Figure 3(e) shows ST could not accurately track the changes of voltage envelope like EWT due to the low time resolution at the fundamental frequency. Figure 3(f) is the time-frequency contour obtained by using ST. The existence of pseudo frequency near the fundamental frequency confirms that ST has a serious spectrum leakage phenomenon.
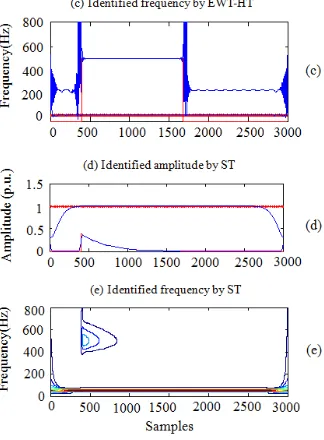
4.3. Oscillatory Transient
In this section, a synthetic oscillatory transient shown as (15) is analyzed.
1 1
( ) cos(2 50 ) exp( ( ) ) cos(2 o ( ) )
x n n T c n n T
f n n T
π α
π
= × × ∆ + − − ∆
× × − ∆ (15)
in which α is the oscillatory amplitude, c the decay coefficient, fo oscillatory frequency and n1 the start instant of the
oscillatory transient. The values of α, c, fo and n1 were set to
0.4, 20, 500 and 400, respectively. The sampling frequency is 6.4kHz and total number of samples is 3000. Figure 4. shows the analyzed waveform and the oscillatory amplitude and frequency obtained from the EWT-HT and ST, respectively.
Figure 4. Detection of oscillatory transient.
4.4. Time-Varying Simultaneous PQ Disturbance
The proposed EWT-HT is further tested on a time-varying simultaneous PQ disturbance signal which starts at 120 point and ends at 366 point. It includes a 60% sag, 20% 2nd harmonic, 10% 3rd harmonic and 5% 198.5Hz interharmonic and 1Hz frequency deviation generated by (16). The analyzed waveform is shown in Figure 5 (a). In Figure 5(b), it is observed that the 1Hz frequency deviation is accurately detected by EWT-HT. Figure 5(c) and Figure 5(d) show EWT-HT accurately detects the variations of amplitudes and frequencies of fundamental harmonics, interharmonics components in the time interval between the 120 point to 366 point. Figure 5(e) shows the estimated amplitudes of 3rd harmonic and 198.5Hz interharmonic obtained by ST fluctuate around the true value. In Figure 5(f), the frequency aliasing is so serious that it is difficult to distinguish the harmonics and interharmonics by ST.
Figure 5. Detection of simultaneous disturbance.
10 cos(2 49 )
120 366
6 cos(2 49 ) cos(2 2
( )
49 ) cos(2 3 49 )
0.5 cos(2 198.5 ) ,
n T
if n or n
n T +2 x n
n T + n T +
n T else
π
π
π
π
π
× × × ∆
< >
× × × ∆ × ×
=
× × ∆ × × × ∆
× × × ∆
,
(16)
5. Conclusion
In this paper, the limitation of S-transform in detecting the power quality disturbances, such as frequency aliasing and slow response at the low frequency have been addressed and a solution with the application of a hybrid of the empirical wavelet transform and Hilbert transform has been presented.
Unlike the stiff window width of S-transform, the empirical wavelet filter banks exhibit the agile window relevant to the Fourier spectrum of the input signal. Based on the convolution principle, the input signal is firstly adaptively decomposed into multiple frequency components. Furthermore, the time-frequency and time-amplitude curves are obtained by utilizing the Hilbert transform in order to estimate the amplitude and frequency parameters of the power quality disturbance signals. Simulation results show that the proposed method is well suitable for analyzing the single disturbance as well as the simultaneous disturbance.
quality disturbances.
Acknowledgements
This work was financially supported by National natural science foundation of China under Grant 51277080 and Cultivation Foundation of Hubei Collaborative Innovation Center for High-efficient Utilization of Solar Energy under Grant HBSZD2014001, Hubei University of Technology, Wuhan, China.
References
[1] P. R. Babu, P. K. Dash, and S. K. Swain, S. Sivanagaraju, “A new fast discrete S-transform and decision tree for the classification and monitoring of power quality disturbance waveforms”. International Transactions on Electrical Energy Systems.2013; 24(9):1279-1300.
[2] S. Santoso, W. M. Grady, E. J. Powers, J. Lamoree, S. C. Bhatt, “Characterization of distribution power quality events with fourier and wavelet transforms”. IEEE TRANSACTIONS ON POWER DELIVERY. 2000; 15(1). 247-254.
[3] N. C. F. Tse, J. Y. C. Chan, W. H. Lau, L. L. Lai, “Hybrid wavelet and Hilbert transform with frequency-shifting decomposition for power quality analysis”. IEEE TRANSACTIONS ON INSTRUMENTATION AND MEASUREMENT. 2012; 61(12): 3225-3233.
[4] D. K. Alves, F. B. Costa, R. L. A. Ribeiro, “Real-time power measurement using the maximal overlap discrete wavelet-packet transform”. IEEE TRANSACTIONS ON INDUSTRIAL ELECTRONICS.2017; 64(4).3177-3187. [5] P. K. Dash, B. K. Panigrahi, G. Panda, “Power quality analysis
using S-transform”. IEEE TRANSACTIONS ON POWER DELIVERY. 2003; 18(2). 406-411.
[6] M. Biswal, P. K. Dash, “Estimation of time-varying power quality indices with an adaptive window-based fast generalized S-transform”. IET Science, Measurement and Technology. 2012; 6(4): 189-197.
[7] D. Camarena-Martinez, M. Valtierra-Rodriguez, C. A. Perez-Ramirez, et al., “Novel down sampling empirical mode decomposition approach for power quality analysis”. IEEE TRANSACTIONS ON INDUSTRIAL ELECTRONICS. 2016; 63(4).2369-2378.
[8] M. Jasa Afroni, D. Sutanto, D. Stirling, “Analysis of nonstationary power-quality waveforms using iterative Hilbert Huang transform and SAX algorithm”. IEEE TRANSACTIONS ON POWER DELIVERY. 2013; 28(4). 2134-2144.
[9] J. Li, Z. Teng, Qiu. Tang, J. Song, “Detection and classification of power quality disturbances using double resolution S-transform and DAG-SVMs”. IEEE TRANSACTIONS ON INSTRUMENTATION AND MEASUREMENT.2016; 65(10).2302-2312.
[10] R. Kumar, B. Singh, D. T. Shahani, A. Chandra, K. Al-Haddad, “Recognition of power-quality disturbances using S-transform-based ANN classifier and rule-based decision tree”. IEEE Transactions on industry applications.2015; 51(2). 1249-1258.
[11] J. Gilles, “Empirical wavelet transform”. IEEE TRANSACTIONS ON SIGNAL PROCESSING. 2013; 61(16):3999-4010.
[12] K. Thirumala, A. C. Umarikar, T. ain; “Estimation of single-phase and three-phase power-quality indices using empirical wavelet transform”. IEEE TRANSACTIONS ON POWER DELIVERY.2015;30(1):2015. 445-454.