PREPARE: Predictive Performance Anomaly
Prevention for Virtualized Cloud Systems
Yongmin Tan, Hiep Nguyen, Zhiming Shen, Xiaohui Gu
North Carolina State UniversityRaleigh, NC, USA
Email:{ytan2,hcnguye3,zshen5}@ncsu.edu, [email protected]
Chitra Venkatramani, Deepak Rajan
IBM T. J. Watson ResearchHawthorne, NY, USA Email:{chitrav,drajan}@us.ibm.com
Abstract—Virtualized cloud systems are prone to
perfor-mance anomalies due to various reasons such as resource contentions, software bugs, and hardware failures. In this paper, we present a novel PREdictive Performance Anomaly pREvention (PREPARE) system that provides automatic per-formance anomaly prevention for virtualized cloud computing infrastructures. PREPARE integrates online anomaly predic-tion, learning-based cause inference, and predictive prevention actuation to minimize the performance anomaly penalty without human intervention. We have implemented PREPARE on top of the Xen platform and tested it on the NCSU’s Virtual Computing Lab using a commercial data stream processing system (IBM System S) and an online auction benchmark (RUBiS). The experimental results show that PREPARE can effectively prevent performance anomalies while imposing low overhead to the cloud infrastructure.
Index Terms—performance anomaly prevention, online
anomaly prediction, cloud computing
I. INTRODUCTION
Infrastructure-as-a-Service (IaaS) cloud systems [1] al-low users to lease resources in a pay-as-you-go fashion. Cloud systems provide application service providers (ASPs) with a more cost-effective solution than in-house computing by obviating the need for ASPs to own and maintain a complicated physical computing infrastructure. Since cloud systems are often shared by multiple users, virtualization technologies [2], [3] are used to achieve isolation among different users. However, applications running inside the cloud are prone to performance anomalies due to various reasons such as resource contentions, software bugs, and hardware failures. Although application developers often perform rigorous debugging offline, many tough bugs only manifest during large-scale runs. It will be a daunting task for system administrators to manually keep track of the execution status of many virtual machines (VMs) all the time. Moreover, manual diagnosis can cause prolonged service level objective (SLO) violation time, which is often associated with big financial penalty.
It is challenging to diagnose and prevent performance anomalies in virtualized cloud computing environments. First, the application running inside the IaaS cloud often appears as a black-box to the cloud service provider, which makes it infeasible to obtain detailed measurements about the application and apply previous intrusive diagnosis
techniques. Second, the cloud management system wishes to automatically prevent any performance anomaly in order to minimize the financial penalty. As a result, traditional reactive anomaly management is often insufficient.
In this paper, we present a novel PREdictive Performance Anomaly pREvention (PREPARE) system for virtualized cloud systems. PREPARE integrates online anomaly pre-diction and virtualization-based prevention techniques (e.g., elastic resource scaling [4], [5] and live VM migration [6]) to automatically prevent performance anomalies in cloud systems. PREPARE applies statistical learning algorithms over system-level metrics (e.g., CPU, memory, network I/O statistics) to achieve two objectives: 1) early anomaly detection that can raise advance anomaly alerts before a performance anomaly happens; and 2) coarse-grained anomaly cause inference that can pinpoint faulty VMs and infer the system metrics that are related to the per-formance anomaly. Based on the informative prediction results, PREPARE leverages virtualization technologies to perform VM perturbations for automatically preventing per-formance anomalies. PREPARE also performs false alarm filtering and prevention effectiveness validation to cope with online anomaly prediction errors. Specifically, this paper makes the following contributions:
• We present PREPARE, a prediction-driven
perfor-mance anomaly prevention system for virtualized cloud computing infrastructures. PREPARE is non-intrusive and application-agnostic, which can be read-ily applied to any application running inside the IaaS cloud.
• We show how to achieve accurate and informative
online anomaly prediction using only system-level metrics by integrating the 2-dependent Markov chain model with the tree-augmented Bayesian networks (TAN) model.
• We introduce several prevention validation schemes to cope with online anomaly prediction errors.
We have implemented a prototype of PREPARE on top of the Xen platform [2]. We have deployed and tested PREPARE on NCSU’s virtual computing lab (VCL) [7] that operates in a similar way as Amazon EC2 [1]. We conducted extensive experiments by running real distributed
systems (IBM System S data stream processing applica-tions [8] and the online auction benchmark system RU-BiS [9]) inside the VCL. Our experimental results show that PREPARE can significantly reduce SLO violation time by up to 97% compared to the traditional reactive intervention scheme. Our anomaly prediction model can predict a range of performance anomalies with sufficient lead time for the system to take preventive actions in time. Our prototype implementation shows that PREPARE is feasible and imposes negligible overhead for the cloud system.
The rest of the paper is organized as follows. Section II describes the design details of PREPARE. Section III presents the experimental evaluation. Section IV compares our work with related work. Section V discusses the lim-itations of the PREPARE system and possible extensions. Finally, the paper concludes in Section VI.
II. SYSTEMDESIGN
In this section, we first provide an overview of our approach. We then describe our online anomaly prediction and cause inference algorithms followed by the prediction-driven prevention actuation schemes.
A. Approach Overview
PREPARE is built on top of the Xen virtualization plat-form, which consists of four major modules: 1) VM mon-itoring, 2) online anomaly prediction, 3) online anomaly cause inference, and 4) predictive prevention actuation, which is illustrated by Figure 1.
The VM monitoring module continuously tracks system-level metrics (e.g. CPU usage, free memory, network traffic, disk I/O statistics) of different VMs using a pre-defined sampling interval (e.g. 5 seconds). Traditional system mon-itoring tools often run within the guest VM. However, the responsiveness of the monitoring tool can be affected when the application VM experiences performance anomalies. Furthermore, it might be difficult to implant the monitoring tool inside a guest VM in practice due to privacy concerns. To achieve better accuracy and robustness, PREPARE strives to collect guest VM information from outside as much as possible.
Most virtualization platforms provide interfaces that al-low the hypervisor (or domain 0 in the Xen platform [2]) to extract guest VM’s system-level metrics from outside. PREPARE uses libxenstat to monitor guest VM’s resource usage from domain 0. However, it is challenging to extract the memory usage information of guest VMs from outside in Xen since the memory utilization is only known to the OS within each guest VM. Thus, if we want to monitor the application’s memory usage metric, we need to install a simple memory monitoring daemon (e.g., through the /proc interface in Linux) within the guest VM to get the memory usage statistics. In addition, our system also needs to know whether the application is experiencing any SLO violation. PREPARE can either rely on the application itself or an
Alert Dom0 Xen hypervisor Host 1 Resource usage VM + application Host 2 Host N ….
Application SLO violation information PREPARE
Resource scaling & VM migration Faulty components Relevant attributes
Online anomaly prediction
Online anomaly cause inference
Predictive prevention actuation
M
M : VM monitoring
Fig. 1. Overall architecture of the PREPARE system.
external tool to keep track of whether the application SLO is violated. Our current prototype adopts the latter approach. To minimize the performance anomaly penalty, PRE-PARE aims at triggering proper preventive actions before the application starts to experience performance anomalies (i.e., SLO violations). To achieve this goal, we build an online anomaly prediction model for each distributed application component (i.e., VM). The online anomaly prediction module should be able to foresee impending performance anomalies with a certain lead time, which provides the opportunity to steer the system away from the abnormal state. To achieve practical anomaly management for virtualized cloud systems, the prediction component only relies on system-level metrics (e.g., CPU, memory, network traffic, disk I/O) that can be collected via hypervi-sor or guest OS. Our anomaly prediction model combines attribute value prediction and multi-variant anomaly classi-fication to raise early alarms [10], [11]. The metric value prediction can estimate the value distribution of an attribute at a future time. The multi-variant classifier can map a set of future attribute measurements into the probabilities of “normal” or “abnormal” states to achieve classification over the future predicted metric values. In PREPARE, we use the 2-dependent Markov model as the attribute value predictor and the tree-augmented Bayesian networks (TAN) model [12] as the anomaly classifier.
Upon receiving a set of anomaly alerts, PREPARE first tries to filter out those false alarms caused by transient resource spikes or inaccurate measurements. After the anomaly alert is confirmed, PREPARE performs anomaly cause inference to identify faulty VMs and related system metrics. Since PREPARE maintains per-VM anomaly pre-diction models, we can infer which VMs are the faulty ones by checking which prediction models raise anomaly alerts. Moreover, we leverage the attribute selection capability of the TAN model to rank the contribution of each system-level metric to the predicted anomaly.
Finally, PREPARE triggers proper prevention actions to steer the system away from the SLO violation state. Since PREPARE targets virtualized cloud computing en-vironments, we develop virtualization-based prevention techniques. Currently, PREPARE supports elastic VM re-source scaling [4], [5] and live VM migration [6] as the
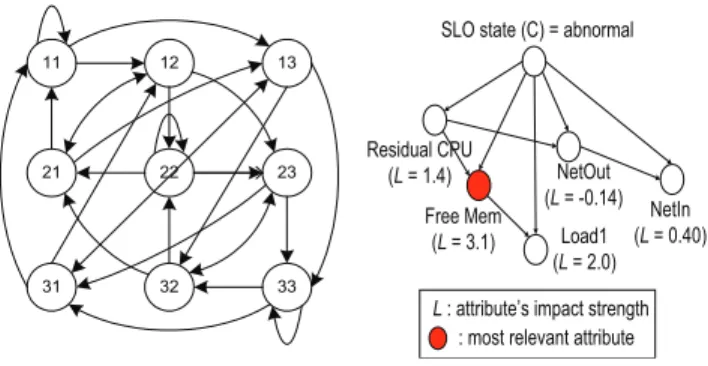
11 13 31 12 23 33 32 22 21
Fig. 2. 2-dependent Markov model for attribute value predic-tion.
SLO state (C) = abnormal
Residual CPU (L = 1.4) NetOut (L = -0.14) NetIn (L = 0.40) Load1 (L = 2.0)
L : attribute’s impact strength : most relevant attribute Free Mem
(L = 3.1)
Fig. 3. Attribute selection using the TAN model.
anomaly prevention actions. For example, if the perfor-mance anomaly is caused by insufficient memory, PRE-PARE dynamically increases the memory allocation to the faulty VM to prevent the performance anomaly. After a prevention action is triggered, we perform effectiveness validation to deal with black-box diagnosis mistakes. B. Per-VM Anomaly Prediction Model
PREPARE maintains one anomaly prediction model for each application VM. Our anomaly prediction model com-bines attribute value prediction and multi-variant anomaly classification to raise early alarms [10], [11]. Most previ-ous learning-based anomaly detection schemes [12] treat a distributed application as one monolithic entity, which suffer from two major problems. First, we cannot distin-guish which components are attributed to the performance anomaly. Second, as we will show in Section III, the prediction accuracy of one monolithic model is significantly worse than that of per-component model since the attribute value prediction errors accumulate as we include the at-tributes of all components into one model.
In our previous work [10], we used the simple Markov chain model for attribute value prediction and the naive Bayesian model for anomaly classification, which has sev-eral limitations. First, the simple Markov chain model as-sumes that the changing behavior of each attribute value is strictly a Markov process, that is, the conditional probability distribution of a future value only depends on the current value but not any past value. However, in practice, not all attributes follow the Markov property. For example, if an attribute value exhibits a sinusoidal pattern, we need to rely on both the current value and the previous value to determine whether the attribute value on an increasing slope or a decreasing slope. To address this problem, we use a two-dependent Markov chain model for each attribute. By using this model, transitions from each value depend on both the current value and the prior value.
Figure 2 shows the transition diagram of an example 2-dependent Markov chain model for an attribute whose value is discretized into three single states. We can construct nine combined states after combining every two single states to transform a non-Markovian attribute into a Markovian one. Such conversion can improve the value prediction accuracy
for fluctuating attributes. The attribute value prediction model is periodically update with new data measurements to adapt to dynamic systems.
To prevent performance anomalies, PREPARE needs to know not only when a performance anomaly will appear but also which system-level metrics are attributed to the anomaly. Although our previous work [10] has shown that naive Bayesian can achieve good anomaly classification ac-curacy, it cannot provide the metric attribution information accurately. To address this problem, PREPARE incorporates the Tree-Augmented Naive (TAN) Bayesian network [12] into the anomaly prediction model. The TAN model is an extension of the naive Bayesian model by further taking dependencies among attributes into account. It can classify a system state into normal or abnormal and give a ranked list of metrics that are mostly related to the anomaly.
By combining the metric value prediction and anomaly classification, our anomaly predictor performs classification over future data to foresee whether the application will enter the anomaly state in a look-ahead window (e.g., 120 seconds). PREPARE will raise an anomaly alert for a distributed application as long as any of the application’s per-VM anomaly predictor raises an alert. To maintain per-VM anomaly prediction models, PREPARE relies on previously developed fault localization techniques [13], [14] to identify the faulty VMs and train the corresponding per-VM anomaly predictors.
Since the TAN model is a supervised learning method, we need to train the TAN model with labelled data (i.e., measurements with normal or abnormal labels). PREPARE supports automatic runtime data labeling by matching the timestamps of system-level metric measurements and SLO violation logs. By using the supervised classification method, PREPARE can only detect previously seen (or recurrent) anomalies. However, it is straightforward to extend PREPARE to support unknown anomalies by replac-ing the supervised classification method with unsupervised classifiers (e.g., clustering and outlier detection).
C. Online Anomaly Cause Inference
Upon receiving an anomaly alert, PREPARE first per-forms false alarm filtering to avoid triggering unnecessary preventions. We use a simple majority voting scheme to filter the false alarms. This scheme is based on the obser-vation that real anomaly symptoms often persist for some time while most of false alarms are caused by transient and sporadic resource spikes. Thus, PREPARE triggers prevention actions only after receiving at least k alerts in the recentW predictions. Different combinations ofkand W represent the tradeoff between the filtering effectiveness and alert timeliness. We set k to be 3 and W to be 4 in our experiments for achieving low false alarm rate.
After confirming a performance anomaly alert for a distributed application, PREPARE performs a fast diag-nostic inference that answers two key questions: 1) which distributed application VMs are faulty; and 2) which system
metrics on those faulty VMs are mostly related to the pre-dicted performance anomaly. Since our system maintains per-VM anomaly prediction models, we can easily infer which VMs are faulty by checking which prediction models raise the alert. However, it is insufficient to just know which VMs are faulty. Although we can try some simplistic approaches such as migrating the faulty VM to another idle host, we may not only fail to resolve the performance anomaly but also introduce excessive overhead (e.g., the VM migration costs).
To further identify the most relevant system metrics to the predicted anomaly for accurate anomaly prevention, our system leverages the attribute selection capability of the TAN classifier [12]. The TAN classifier can quantify the influence of each system attribute on the “abnormal” classification result using a probabilistic model. Specifi-cally, we can derive the following mathematical form to decide the TAN classifier’s choice. This form is a sum of terms, each of which involves the probability that the value of an attribute ai occurs in each class label C (i.e., “abnormal”(1) or “normal”(0)) given the value of its parent attribute api. A sum greater than zero generates an
“abnormal” classification result:
X i log P(a i|api, C = 1) P(ai|api, C = 0) + logP(C= 1) P(C= 0) >0 (1)
We define Li as the strength of the attribute ai’s impact on the TAN classifier’s decision. We can extract Li from Equation (1): Li= log P(ai|api, C = 1) P(ai|api, C = 0) (2) A larger value of Li for an attribute ai suggests that ai is more relevant to the predicted anomaly. Figure 3 shows an attribute selection example in which the “Free Mem” attribute has the largest influence on the predicted anomaly. One tricky issue is to distinguish a workload change from some internal faults. Intuitively, if an anomaly is caused by external factors such as a workload change, all the application components will be affected. Thus, we should observe changes in some system metrics on all the appli-cation components. Based on this observation, PREPARE can infer a workload change by checking whether all the application components have change points in some system metrics simultaneously [13].
D. Predictive Prevention Actuation
After pinpointing the faulty VMs and the relevant met-rics, PREPARE triggers proper anomaly prevention actions. Since PREPARE targets virtualized cloud environments, we focus on hypervisor-based prevention techniques. PRE-PARE currently supports two types of prevention actions: 1) elastic VM resource scaling [4], [5], and 2) live VM migration [6]. The elastic VM resource scaling system can dynamically adjust the allocation of a specific resource to the faulty VMs to mitigate the anomaly impact. Our system
currently supports CPU and memory scaling. For example, if the prediction modules raise alerts on two VMs and the pinpointed attributes are memory and CPU respectively, PREPARE will trigger the memory scaling on the first VM and CPU scaling on the second VM. We can also leverage live VM migration to prevent performance anomalies by relocating the faulty VM to a host with desired resources. However, compared to migration, resource scaling is more light-weight and less intrusive. Thus, PREPARE strives to first use resource scaling to alleviate performance anomaly. If the scaling prevention is ineffective or cannot be applied due to insufficient resources on the local host, PREPARE will trigger live VM migration to relocate the faulty VM to a different host with matching resources [15].
Online anomaly prediction are rarely perfect in practice, which may miss predictions, raise false alarms, or pinpoint wrong faulty VMs and fault-related system metrics. If the anomaly predictor fails to raise advance alert for a happened anomaly, PREPARE will trigger the prevention action after the application’s SLO violation is detected. In this case, the prevention is performed reactively rather than proactively. To handle false alarms1and metric pinpointing mistakes, PREPARE performs online validation to check the effectiveness of the triggered prevention action. This is achieved by checking the anomaly alerts and compar-ing the resource usage before and after the prevention action. If the prediction models stop sending any anomaly alert (i.e., SLO violation is gone), it means that we have successfully avoided or corrected a performance anomaly. Otherwise, PREPARE builds a back window and look-ahead window for each prevention. The look-back window provides statistics of the resource usage shortly before the prevention and the look-ahead window provides statistics of the resource usage shortly after the prevention. Intuitively, if the application resource usage does not change after a prevention action, it means that the prevention does not have any effect. The system will try other prevention actions (e.g., scaling the next metric in the list of related metrics provided by the TAN model) until the performance anomaly is gone.
III. EXPERIMENTALEVALUATION
We have implemented the PREPARE system on top of Xen, and conducted extensive experiments using the IBM System S data stream processing system [8] and the RUBiS online auction benchmark (EJB version) [9]. In this section, we first describe our experiment setup. We then present the experimental results.
A. Experiment setup
Our experiments were conducted on the NCSU’s virtual computing lab (VCL) [7]. Each VCL host has a dual-core Xeon 3.00GHz CPU, 4GB memory, and runs CentOS 5.2
1Although our majority voting scheme can filter out some false alarms,
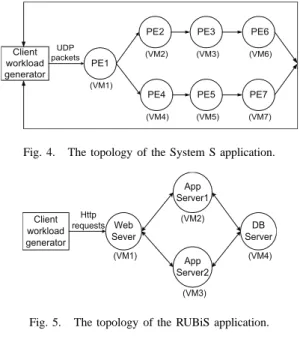
PE1 PE2 (VM1) PE3 PE4 PE5 (VM2) (VM3) (VM4) (VM5) PE6 PE7 (VM6) (VM7) Client workload generator UDP packets
Fig. 4. The topology of the System S application.
Web Sever App Server1 (VM1) App Server2 (VM2) (VM4) (VM3) Client workload generator Http requests DB Server
Fig. 5. The topology of the RUBiS application.
64-bit with Xen 3.0.3. The guest VMs also run CentOS 5.2 64-bit.
Case study distributed systems. To test our system with
real distributed systems, we used IBM System S [8] and RUBiS [9] (EJB version) benchmarks.
System S is a commercial high-performance data stream processing system. Each System S application consists of a set of inter-connected processing elements called PEs. In our experiments, we used a tax-calculation application, one of the sample applications provided by System S product distribution. Figure 4 shows the application topology used in the experiments. A SLO violation is marked if either
InputRate/OutputRate < 0.95or the average per-tuple
processing time is larger than 20ms. We run each PE in a guest VM.
RUBiS is a three-tier online auction benchmark. Figure 5 shows the topology of the RUBiS application used in the experiments. The client workload generator also tracks the response time of the HTTP requests it made. A SLO violation is marked if the average request response time is larger than200ms. In order to evaluate our system under dynamic workloads with realistic time variations, we used a client workload generator that emulates the workload intensity observed in the NASA web server trace beginning at 00:00:00 July 1, 1995 from the IRCache Internet traffic archive [16].
Fault injection. In the experiments using System S, we
injected the following faults: 1) memory leak: we inject a memory leak bug in a randomly selected PE. The faulty PE performs continuous memory allocations but forgets to release the allocated memory; 2) CPU hog: we introduce an infinite loop bug in a randomly selected PE; and 3) bottleneck: we gradually increase the workload until hitting the CPU capacity limit of the bottleneck PE that is the first PE to be overloaded (i.e., PE6 in Figure 4, a sink PE that intensively sends processed data tuples to the network).
In the experiments using RUBiS, we injected the follow-ing faults: 1) memory leak: we start a program that has a memory leak bug in the VM running the database server; 2) CPU hog: we start a CPU-bound program that competes CPU with the database server inside the same VM; and 3) bottleneck: we gradually increase the workload until hitting the capacity limit of the bottleneck component that is the database server in RUBiS.
Evaluation methodology. We compare our approach
with 1) reactive intervention that triggers anomaly inter-vention actions when a SLO violation is detected. This approach leverages the same anomaly cause inference and prevention actuation modules as PREPARE. However, the fundamental difference is that all these actions are triggered only after a SLO violation has already occurred; and 2) without intervention that does not perform any intervention to the faulty application. The sampling interval of the system-level metrics is configured to be 5 seconds. We define SLO violation time as the total time during which the application’s SLO is violated. Thus, we evaluate the effectiveness of different anomaly management schemes by comparing the SLO violation time. Shorter SLO violation time indicates a better anomaly management. Furthermore, we use true positive rate AT and false alarm rate AF to quantify the accuracy of the anomaly prediction model. Let Ntp, Nfn, Nfp, andNtn denote the true positive number, false negative number, false positive number, and true negative number, respectively. We define AT and AF in a standard way as follows,
AT = Ntp Ntp+Nfn, AF = Nfp Nfp+Ntn (3) B. Experiment results
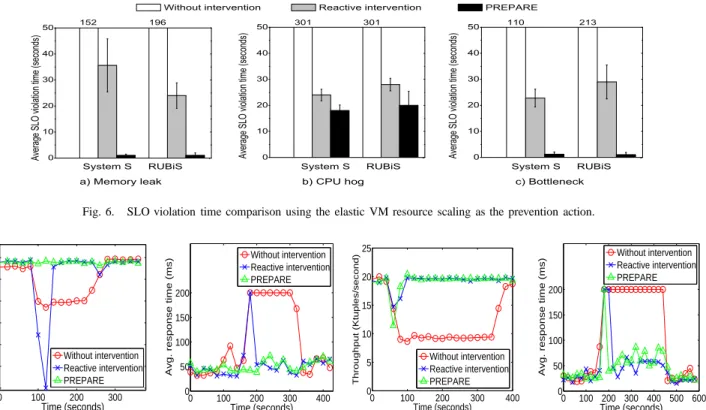
Figure 6 shows the SLO violation time experienced by System S and RUBiS under different faults. In this set of experiments, we use the elastic VM resource scaling as the prevention action. Both PREPARE and the reactive intervention scheme perform the cause inference and vali-dation to automatically identify the right system metric that should be adjusted. Each experiment run lasts from 1200 to 1800 seconds. Since the current prototype of PREPARE can only handle recurrent anomalies, we inject two faults of the same type and each fault injection lasts about 300 seconds. Our prediction model learns the anomaly during the first fault injection and starts to make prediction for the second injected fault. We repeat each experiment five times. We report both mean and standard deviation for the SLO violation time. The results show that PREPARE can significantly reduce the SLO violation time by 90-99% compared to the “without intervention” scheme. By achieving early detection using the anomaly prediction, PREPARE outperforms the reactive intervention scheme by reducing the SLO violation time by 25-97%. PREPARE achieves more significant SLO conformance improvement for the memory leak and bottleneck faults than the CPU hog fault. The reason is that both the memory leak fault
0 10 20 30 40 50 c) Bottleneck b) CPU hog 152 A v e r a g e S L O v i o l a t i o n t i m e ( s e c o n d s ) A v e r a g e S L O v i o l a t i o n t i m e ( s e c o n d s ) A v e r a g e S L O v i o l a t io n t i m e ( s e c o n d s )
Without intervention Reactive intervention PREPARE
196 a) Memory leak 0 10 20 30 40 50 213 110
System S RUBiS System S RUBiS
301 301 System S RUBiS 0 10 20 30 40 50
Fig. 6. SLO violation time comparison using the elastic VM resource scaling as the prevention action.
0 100 200 300 0 5 10 15 20 25 30 Time (seconds) Throughput (Ktuples/second) Without intervention Reactive intervention PREPARE
(a) Memory leak (System S)
0 100 200 300 400 0 50 100 150 200 Time (seconds)
Avg. response time (ms)
Without intervention Reactive intervention PREPARE
(b) Memory leak (RUBiS)
0 100 200 300 400 0 5 10 15 20 25 Time (seconds) Throughput (Ktuples/second) Without intervention Reactive intervention PREPARE
(c) CPU hog (System S)
0 100 200 300 400 500 600 0 50 100 150 200 Time (seconds)
Avg. response time (ms)
Without intervention Reactive intervention PREPARE
(d) CPU hog (RUBiS) Fig. 7. Sampled SLO metric trace comparison using the elastic VM resource scaling as the prevention action.
and the bottleneck fault exhibit gradual changing behavior in some system-level metrics, which gives opportunity for PREPARE to make more accurate and earlier prediction. In contrast, the CPU hog fault often manifests suddenly, which makes it difficult to predict.
Figure 7 shows the continuously sampled SLO metric traces for a subset of the tested faults in the above experi-ments. Those trace results give us close-up views about the effectiveness of different anomaly management schemes. For System S, we present the throughput trace that samples the end-to-end stream system output rate in the number of produced result tuples per second. For RUBiS, we present the sampled average request response time trace. We choose these two metrics since they can reflect the application’s SLO status during runtime. Figure 7(a) shows the sys-tem throughput comparison in the presence of a memory leak fault for System S. We observe that PREPARE can almost completely prevent the performance anomaly (i.e., throughput drop). In contrast, for the reactive intervention approach, the application still has to suffer from a short period of SLO violation during the beginning phase of the fault manifestation. Figure 7(b) shows the average request response time comparison for a memory leak fault in RUBiS. Similarly, the results show that PREPARE can effectively avoid SLO violation by maintaining the response time under the SLO violation threshold. For the reactive intervention approach, the application still has to experience a short period of SLO violations since the prevention action is triggered after the SLO violation is detected.
Figure 7(c) and Figure 7(d) show the system throughput comparison in the presence of a CPU hog fault for System S and RUBiS, respectively. We observe that both PREPARE and the reactive intervention scheme can quickly alleviate the SLO violation using proper scaling since the CPU hog fault manifest immediately into SLO violation. However, PREPARE achieves only a little SLO conformance im-provement compared to the reactive intervention scheme for the CPU hog fault. The reason is that the CPU hog fault often manifests as sudden increase in the CPU usage metric, which is difficult for PREPARE to raise early alarms.
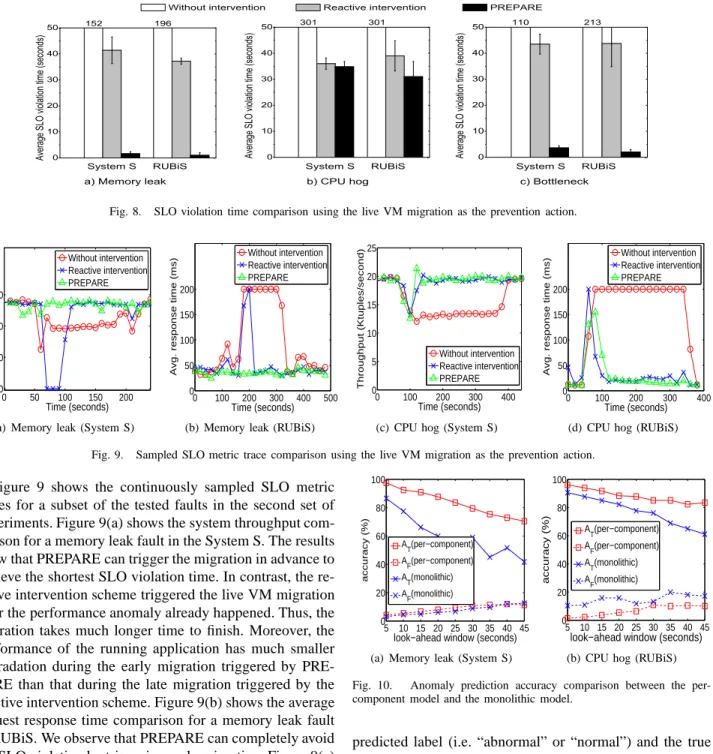
Next, we repeat the same set of experiments but use the live VM migration as the prevention action. Figure 8 shows the SLO violation time experienced by System S and RU-BiS under different anomaly faults. The results show that PREPARE can effectively reduce the SLO violation time by 88-99% compared to the “without intervention” scheme. Compared to the reactive intervention scheme, PREPARE can achieve 3-97% shorter SLO violation time. We also observe that using live VM migration as the prevention action incurs longer SLO violation time in most cases. The reason is that the resource scaling often takes effect immediately while the live VM migration takes around 8-15 seconds to be effective if the migration is triggered before the anomaly happens. If the live migration is triggered late, the performance penalty will be even larger. Thus, PREPARE will choose to perform resource scaling first and only trigger the migration if the scaling cannot be performed (i.e., insufficient resources on the local host).
0 10 20 30 40 50 c) Bottleneck b) CPU hog 152 A v e r a g e S L O v i o l a t i o n t i m e ( s e c o n d s ) A v e r a g e S L O v i o l a t i o n t i m e ( s e c o n d s ) A v e r a g e S L O v i o l a t io n t i m e ( s e c o n d s )
Without intervention Reactive intervention PREPARE
196 a) Memory leak 0 10 20 30 40 50 213 110
System S RUBiS System S RUBiS
301 301 System S RUBiS 0 10 20 30 40 50
Fig. 8. SLO violation time comparison using the live VM migration as the prevention action.
0 50 100 150 200 0 10 20 30 Time (seconds) Throughput (Ktuples/second) Without intervention Reactive intervention PREPARE
(a) Memory leak (System S)
0 100 200 300 400 500 0 50 100 150 200 Time (seconds)
Avg. response time (ms)
Without intervention Reactive intervention PREPARE
(b) Memory leak (RUBiS)
0 100 200 300 400 0 5 10 15 20 25 Time (seconds) Throughput (Ktuples/second) Without intervention Reactive intervention PREPARE
(c) CPU hog (System S)
0 100 200 300 400 0 50 100 150 200 Time (seconds)
Avg. response time (ms)
Without intervention Reactive intervention PREPARE
(d) CPU hog (RUBiS) Fig. 9. Sampled SLO metric trace comparison using the live VM migration as the prevention action.
Figure 9 shows the continuously sampled SLO metric traces for a subset of the tested faults in the second set of experiments. Figure 9(a) shows the system throughput com-parison for a memory leak fault in the System S. The results show that PREPARE can trigger the migration in advance to achieve the shortest SLO violation time. In contrast, the re-active intervention scheme triggered the live VM migration after the performance anomaly already happened. Thus, the migration takes much longer time to finish. Moreover, the performance of the running application has much smaller degradation during the early migration triggered by PRE-PARE than that during the late migration triggered by the reactive intervention scheme. Figure 9(b) shows the average request response time comparison for a memory leak fault in RUBiS. We observe that PREPARE can completely avoid the SLO violation by triggering early migration. Figure 9(c) and Figure 9(d) show the throughput comparison for a CPU hog fault in System S and RUBiS, respectively. Again, we observe that due to the limited predictability of the related attribute (i.e. CPU usage) during the fault manifestation, the prevention efficacy of PREPARE degrades to that of the reactive intervention approach.
To further quantify the accuracy of our anomaly predic-tion model, we conduct trace-driven experiments using the data collected in the above two sets of experiments. We cal-culated the prediction accuracy under different look-ahead windows for the second fault injection in each experiment. We use the formula defined in Equation (3) to calculate the accuracy of our anomaly predictor by comparing the
5 10 15 20 25 30 35 40 45 0 20 40 60 80 100
look−ahead window (seconds)
accuracy (%)
AT(per−component) AF(per−component) AT(monolithic) AF(monolithic)
(a) Memory leak (System S)
5 10 15 20 25 30 35 40 45 0 20 40 60 80 100
look−ahead window (seconds)
accuracy (%) AT(per−component) A F(per−component) A T(monolithic) A F(monolithic)
(b) CPU hog (RUBiS) Fig. 10. Anomaly prediction accuracy comparison between the per-component model and the monolithic model.
predicted label (i.e. “abnormal” or “normal”) and the true label for all the data samples in each dataset. The labels are automatically produced by correlating the timestamps of the measurement samples with the SLO violation logs, as described in Section II-B.
Figure 10 compares the prediction accuracy between our per-VM prediction model scheme and the monolithic prediction model scheme that incorporates the performance metrics of all the application VMs into one single prediction model. Due to the space limitation, we only show a subset of results. We observe that the prediction accuracy of our per-VM model is significantly better than that of the monolithic model. The reason is that as the number of attributes increases, the attribute value prediction errors will accumulate. As a result, the classification accuracy
5 10 15 20 25 30 35 40 45 0 20 40 60 80 100
look−ahead window (seconds)
accuracy (%) AT (2−dep. Markov) A F (2−dep. Markov) AT (simple Markov) A F (simple Markov)
(a) Memory leak (System S)
5 10 15 20 25 30 35 40 45 0 20 40 60 80
look−ahead window (seconds)
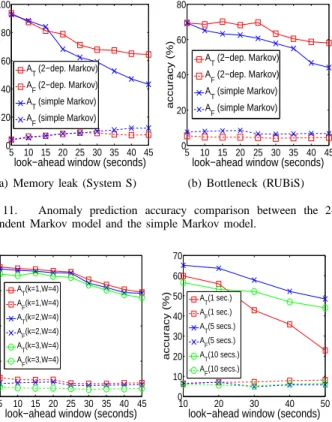
accuracy (%) A T (2−dep. Markov) AF (2−dep. Markov) A T (simple Markov) A F (simple Markov) (b) Bottleneck (RUBiS) Fig. 11. Anomaly prediction accuracy comparison between the 2-dependent Markov model and the simple Markov model.
5 10 15 20 25 30 35 40 45 0 20 40 60 80
look−ahead window (seconds)
accuracy (%) A T(k=1,W=4) AF(k=1,W=4) AT(k=2,W=4) A F(k=2,W=4) A T(k=3,W=4) A F(k=3,W=4)
Fig. 12. Anomaly prediction ac-curacy comparison under different settings of the false alarm filtering for a bottleneck fault in RUBiS.
10 20 30 40 50 0 10 20 30 40 50 60 70
look−ahead window (seconds)
accuracy (%) AT(1 sec.) AF(1 sec.) A T(5 secs.) A F(5 secs.) A T(10 secs.) A F(10 secs.)
Fig. 13. Anomaly prediction ac-curacy comparison under different sampling intervals for a bottleneck fault in RUBiS.
over predicted values will degrade. Thus, it is necessary to build per-VM anomaly prediction model for distributed applications.
Figure 11 shows the anomaly prediction accuracy com-parison between 2-dependent Markov model and simple Markov model for a subset of tested faults. We observe that the 2-dependent Markov model can achieve higher pre-diction accuracy than the simple Markov model, especially under larger look-ahead windows. Note that although the trace-driven experiments show that our anomaly prediction models still produce significant number of false alarms, most false alarms will be filtered by our continuity check and online validation schemes during runtime.
PREPARE triggers prevention actions only after receiv-ing at least k alerts in the recent W predictions for false alarm filtering. Figure 12 compares the prediction accuracy under different settings of k andW for a bottleneck fault in RUBiS. We observe that a larger value ofk(i.e.,k= 3) can effectively filter out more false alarms because it can tolerate sporadic anomaly predictions generated mistakenly in a window of W. A larger value of k also achieves slightly lower true positive rate. The reason is that it triggers prevention actions slightly later when a persistent true anomaly is about to happen. However, such small delay (e.g., one or two sampling intervals) in prevention actions is negligible if PREPARE can achieve generous lead time. We set k to be 3 and W to be 4 for all the applications and faults tested in our experiments.
System Modules CPU cost
VM monitoring (13 attributes) 4.68±0.52 ms Simple Markov model training (600 samples) 61.0±0.60 ms 2-dep. Markov model training (600 samples) 135.1±0.88 ms TAN model training (600 samples) 4.0±0.02 ms Anomaly prediction 1.3±0.06 ms CPU resource scaling 107.0±0.53 ms Memory resource scaling 116.0±2.39 ms Live VM migration (512MB Memory) 8.56±1.05 sec
TABLE I
PREPARE SYSTEM OVERHEAD MEASUREMENTS.
Figure 13 compares the prediction accuracy under dif-ferent sampling intervals of the performance metrics for a bottleneck fault in RUBiS. We observe that 5 seconds sampling interval can achieve the highest prediction accu-racy. In comparison, too fine-grained monitoring (i.e., 1 sec-ond sampling interval) achieves lower prediction accuracy, especially under larger look-ahead windows. The reason is that the sampling interval also decides the step size of the Markov model that has limited accuracy for large step predictions. In contrast, coarser grained monitoring (i.e., 10 seconds sampling interval) also achieves lower prediction accuracy. The reason is that sampling system metrics less frequently might not capture the pre-anomaly behaviors accurately and thus leads to inaccurate predictions.
Finally, we evaluate the overhead of the PREPARE system. Table I lists the CPU cost of each key module in the PREPARE system. The VM monitoring module runs within the domain 0 of each host, which collects 13 resource attributes every five seconds. Each collection takes around 1.3 milliseconds. The simple Markov model training takes around 61 milliseconds using 600 training data samples.In comparison, the 2-dependent Markov model training takes around 135 milliseconds using the same training samples. The TAN model training takes around 4 milliseconds for 600 training data samples. The anomaly prediction takes around 1.3 milliseconds, which includes the time of calcu-lating state probabilities, generating predicted class labels for different look-ahead windows and performing attribute selection for each data sample. The time spent on perform-ing CPU or memory scalperform-ing is around 100 milliseconds. The live VM migration takes around 8 seconds to migrate one VM with 512 MB memory. During the normal execu-tion, PREPARE imposes less than 1% CPU load in domain 0. The memory consumption of PREPARE is around 3MB. Furthermore, since PREPARE maintains per-VM anomaly prediction models, different anomaly prediction models can be distributed on different cloud nodes for scalability. Overall, we believe that PREPARE is practical for online system anomaly management.
IV. RELATEDWORK
Recent work has shown that statistical machine learning techniques are useful for automatic system management. Cohen et al. proposed to use the TAN model to correlate low-level system metrics to high-level system states [12],
and capture the essential system characteristics called sig-natures [17]. Fox et al. proposed an anomaly detection approach that considers both simple operational statistics and structural change in a complex distributed system [18]. Bodik et al. applied statistical machine learning techniques to estimate the relationships among performance, workload, and physical resources [19]. Shen et al. proposed a change profile based approach to detect system anomaly symptoms by checking performance deviation between reference and target execution conditions [20]. Kaustubh et. al. proposed a model-driven integrated monitoring and recovery approach for distributed systems [21]. The authors proposed to use Bayesian estimation and Markov decision theory to choose recovery actions according to a user-defined optimization criteria. In comparison, our work provides a new online, prediction-driven anomaly prevention framework by com-bining online anomaly prediction with hypervisor-based out-of-box VM preventions. Our approach is non-intrusive and application-agnostic, which makes it suitable for cloud computing environments.
Previous work has also developed various performance anomaly debugging techniques. Project5 [22] performed cross-correlations between message traces to derive causal paths and identify performance bottlenecks. Cherkasova et al. presented an integrated framework of using regression-based transaction models and application performance sig-natures to detect anomalous application behavior [23]. Kahuna [24] provides a problem diagnosis approach for MapReduce systems by statistically comparing both black box and white box data across different nodes. NAP [25] collected network communication traces and applied queue-ing theory to estimate the service time and waitqueue-ing time for identifying bottleneck components. Monalytics [26] combines monitoring and analysis for managing large-scale data centers, and uses entropy-based anomaly detection method [27] to identify the anomalies. Chopstix [28] pro-vided a light-weight approximate data collection frame-work and diagnosis rules for troubleshooting a large-scale production system. In comparison, PREPARE focuses on predicting system performance anomalies in advance and providing pre-anomaly and coarse-grained debugging in-formation to actuate anomaly prevention actions.
Our work is also related to previous trial-and-error failure management approach. Qin et al. presented Rx [29], a system that helps system survive bugs by rolling back the program and re-executing it in modified environments. Similarly, Triage [30] leverages lightweight re-execution support to deal with production run bugs. However, these techniques require periodical system checkpointing and sys-tem rollback for re-execution, which can bring significant overhead to the system. In comparison, PREPARE performs predictive anomaly correction, which triggers VM preven-tion acpreven-tions before the anomaly happens. Thus, PREPARE does not need to pay the cost of checkpointing during normal execution and avoid expensive rollback to recover from failure.
Predictive system management has been studied under different contexts. Henriksson et. al [31] proposed a feed-forward delay predictor that uses instantaneous measure-ments to predict future delays on an Apache web server and then dynamically changes the service rate to satisfy the delay specification according to the prediction results. Thereska et. al [32] proposed a “Whatif” interface to enable a system to predict the performance impact of external changes such as workload and hardware devices using operational laws. Thomas et. al. [33] used auto-correlation and cross-auto-correlation to predict the workload and linear regression to predict the execution time of each component in the distributed stream processing system. They proposed an early execution migration scheme based on the workload and execution time predictions to alleviate application hot-spots. In contrast, PREPARE provides a more informed anomaly prediction scheme that can not only raise advance anomaly alerts with certain lead time but also provide important cues about the anomaly causes. Moreover, PREPARE integrates the online anomaly predic-tion with VM prevenpredic-tion techniques to achieve automatic anomaly prevention for the cloud system.
V. DISCUSSIONS
First, PREPARE currently only works with recurrent anomalies. The reason is that we use the supervised learning method. It means that the model requires labeled histor-ical training data to derive the anomaly classifier. Thus, PREPARE can only predict the anomalies that the model has already seen before. Furthermore, although PREPARE supports automatic runtime data labeling by correlating the time-series data samples with the SLO violation logs based on the timestamp information, it would be challenging to obtain labeled training data for large-scale cloud systems. We plan to extend PREPARE to handle unseen anomalies by developing unsupervised anomaly prediction models.
Second, PREPARE performs coarse-grained black-box anomaly prediction and diagnosis (i.e., pinpointing the faulty components and the most relevant system metrics) and prevents performance anomalies by using the VM re-source scaling and live VM migration techniques. However, PREPARE is not intended to replace those fine-grained fault localization and diagnosis tools (e.g., pinpointing lines of faulty code). If the fault is deterministic (e.g., a mem-ory leak bug), PREPARE can only temporarily avoid the SLO violations. To completely remove the fault, we need to integrate PREPARE with other fine-grained debugging tools. However, PREPARE can delay the SLO violation occurrence, which provides precious time for fine-grained debugging.
Third, PREPARE assumes that performance anomalies manifest in system-level metrics. Although our experimen-tal study shows that this assumption is valid for most performance anomalies we have tested, there may still exist performance anomalies that do not manifest as system-level metric changes. Under those circumstances,
black-box approaches generally will not be effective. We need to leverage the white-box or grey-box diagnosis techniques to handle the anomalies.
Fourth, PREPARE currently needs to implant a light-weight monitoring daemon within one guest VM to track its memory usage information. However, these memory usage statistics can either be inferred indirectly [34] or obtained by VM introspection techniques [35].
VI. CONCLUSION
We have presented the design and implementation of the PREPARE system, a novel predictive performance anomaly prevention system for virtualized cloud comput-ing infrastructure. PREPARE can predict recurrent perfor-mance anomalies by combining attribute value prediction with supervised anomaly classification methods. PREPARE builds per-VM prediction model and leverages the attribute attribution capability of the TAN classification method to pinpoint faulty VMs and relevant system metrics. Based on its black-box diagnosis results, PREPARE performs elastic VM resource scaling or live VM migration to prevent the performance anomalies. We have implemented PREPARE on top of the Xen platform and tested it on the NCSU’s Virtual Computing Lab using real distributed systems (IBM System S stream processing system and RUBiS). Our results show that PREPARE can effectively prevent the performance anomalies caused by a set of common soft-ware faults. PREPARE is light-weight and non-intrusive, which makes it an attractive practical anomaly management solution for large-scale virtualized cloud computing infras-tructures.
ACKNOWLEDGMENT
This work was sponsored in part by NSF CNS0915567 grant, NSF CNS0915861 grant, NSF CAREER Award CNS1149445, U.S. Army Research Office (ARO) un-der grant W911NF-10-1-0273, IBM Faculty Awards and Google Research Awards. Any opinions expressed in this paper are those of the authors and do not necessarily reflect the views of NSF, ARO, or U.S. Government. The authors would like to thank the anonymous reviewers for their insightful comments.
REFERENCES
[1] “Amazon Elastic Compute Cloud,” http://aws.amazon.com/ec2/. [2] P. Barham and et al., “Xen and the Art of Virtualization,” in Proc.
of SOSP, 2003.
[3] “VMware Virtualization Technology,” http://www.vmware.com/. [4] Z. Shen, S. Subbiah, X. Gu, and J. Wilkes, “Cloudscale: Elastic
resource scaling for multi-tenant cloud systems,” in Proc. of SOCC, 2011.
[5] Z. Gong, X. Gu, and J. Wilkes, “PRESS: PRedictive Elastic Re-Source Scaling for cloud systems,” in Proc. of CNSM, 2010. [6] C. Clark, K. Fraser, S. Hand, J. G. Hansen, E. Jul, C. Limpach,
I. Pratt, and A. Warfield, “Live migration of virtual machines,” in
Proc. of NSDI, 2005.
[7] “Virtual Computing Lab,” http://vcl.ncsu.edu/.
[8] B. Gedik, H. Andrade, K.-L. Wu, P. S. Yu, and M. Doo, “SPADE: the system s declarative stream processing engine,” in Proc. of SIGMOD, 2008.
[9] “RUBiS Online Auction System,” http://rubis.ow2.org/.
[10] X. Gu and H. Wang, “Online Anomaly Prediction for Robust Cluster Systems,” in Proc. of ICDE, 2009.
[11] Y. Tan, X. Gu, and H. Wang, “Adaptive runtime anomaly prediction for dynamic hosting infrastructures,” in Proc. of PODC, 2010. [12] I. Cohen, M. Goldszmidt, T. Kelly, J. Symons, and J. S. Chase,
“Correlating Instrumentation Data to System States: A Building Block for Automated Diagnosis and Control,” in Proc. of OSDI, 2004.
[13] H. Nguyen, Y. Tan, and X. Gu, “PAL: Propagation-aware anomaly localization for cloud hosted distributed applications,” in Proc. of
SLAML, 2011.
[14] E. Kiciman and A. Fox, “Detecting Application-Level Failures in Component-based Internet Services,” IEEE Transactions on Neural
Networks, 2005.
[15] Z. Gong and X. Gu, “PAC: Pattern-driven Application Consolidation for Efficient Cloud Computing,” in Proc. of MASCOTS, 2010. [16] “The IRCache Project,” http://www.ircache.net/.
[17] I. Cohen, S. Zhang, M. Goldszmidt, J. Symons, T. Kelly, and A. Fox, “Capturing, indexing, clustering, and retrieving system history,” in
Proc. of SOSP, 2005.
[18] A. Fox, E. Kiciman, and D. A. Patterson, “Combining statistical monitoring and predictable recovery for self-management,” in Proc.
of WOSS, 2004.
[19] P. Bodik, R. Griffith, C. Sutton, A. Fox, M. Jordan, and D. Patterson, “Statistical machine learning makes automatic control practical for internet datacenters,,” in Proc. of HotCloud, 2009.
[20] K. Shen, C. Stewart, C. Li, and X. Li, “Reference-driven performance anomaly identification,” in Proc. of SIGMET-RICS/Performance, 2009.
[21] K. Joshi, M. Hiltunen, W. Sanders, and R. Schlichting, “Probabilistic model-driven recovery in distributed systems,” IEEE Transactions on
Dependable and Secure Computing, 2010.
[22] M. K. Aguilera, J. C. Mogul, J. L. Wiener, P. Reynolds, and A. Muthitacharoen, “Performance debugging for distributed systems of black boxes,” in Proc. of SOSP, 2003.
[23] L. Cherkasova, K. M. Ozonat, N. Mi, J. Symons, and E. Smirni, “Au-tomated anomaly detection and performance modeling of enterprise applications,” ACM Trans. Comput. Syst, vol. 27, no. 3, 2009. [24] J. Tan, X. Pan, E. Marinelli, S. Kavulya, R. Gandhi, and
P. Narasimhan, “Kahuna: Problem diagnosis for mapreduce-based cloud computing environments,” in Proc. of NOMS, 2010. [25] M. Ben-Yehuda, D. Breitgand, M. Factor, H. Kolodner, V. Kravtsov,
and D. Pelleg, “Nap: a building block for remediating performance bottlenecks via black box network analysis,” in Proc. of ICAC, 2009. [26] M. Kutare, G. Eisenhauer, C. Wang, K. Schwan, V. Talwar, and M. Wolf, “Monalytics: online monitoring and analytics for managing large scale data centers,” in Proc. of ICAC, 2010.
[27] C. Wang, V. Talwar, K. Schwan, and P. Ranganathan, “Online detection of utility cloud anomalies using metric distributions,” in
Proc. of NOMS, 2010.
[28] S. Bhatia, A. Kumar, M. E. Fiuczynski, and L. L. Peterson, “Lightweight, high-resolution monitoring for troubleshooting pro-duction systems,” in Proc. of OSDI, 2008.
[29] F. Qin, J. Tucek, and Y. Zhou, “Treating bugs as allergies – a safe method to survive software failures,” in Proc. of SOSP, 2005. [30] J. Tucek, S. Lu, C. Huang, S. Xanthos, and Y. Zhou, “Triage:
diagnosing production run failures at the user’s site,” in Proc. of
SOSP, 2007.
[31] D. Henriksson, Y. Lu, and T. F. Abdelzaher, “Improved prediction for web server delay control,” in Proc. of ECRTS, 2004.
[32] E. Thereska, D. Narayanan, and G. R. Ganger, “Towards self-predicting systems: What if you could ask ”what-if”?” in Proc. of
DEXA, 2005.
[33] T. Repantis and V. Kalogeraki, “Hot-spot prediction and alleviation in distributed stream processing applications,” in Proc. of DSN, 2008. [34] T. Wood, P. J. Shenoy, A. Venkataramani, and M. S. Yousif, “Black-box and gray-“Black-box strategies for virtual machine migration,” in Proc.
of NSDI, 2007.
[35] K. Nance, M. Bishop, and B. Hay, “Virtual machine introspection: Observation or interference?” Security Privacy, IEEE, vol. 6, no. 5, pp. 32 –37, sept.-oct. 2008.