PerfExplorer: A Performance Data Mining
Framework For Large-Scale Parallel Computing
Kevin A. Huck
Performance Research Laboratory Department of Computer and
Information Science
University of Oregon, Eugene, OR, USA
[email protected]
Allen D. Malony
Performance Research Laboratory Department of Computer and
Information Science
University of Oregon, Eugene, OR, USA
[email protected]
ABSTRACT
Parallel applications running on high-end computer systems manifest a complexity of performance phenomena. Tools to observe parallel performance attempt to capture these phenomena in measurement datasets rich with information relating multiple performance metrics to execution dynam-ics and parameters specific to the application-system exper-iment. However, the potential size of datasets and the need to assimilate results from multiple experiments makes it a daunting challenge to not only process the information, but discover and understand performance insights. In this pa-per, we present PerfExplorer, a framework for parallel per-formance data mining and knowledge discovery. The frame-work architecture enables the development and integration of data mining operations that will be applied to large-scale parallel performance profiles. PerfExplorer operates as a client-server system and is built on a robust parallel per-formance database (PerfDMF) to access the parallel profiles and save its analysis results. Examples are given demon-strating these techniques for performance analysis of ASCI applications.
1.
INTRODUCTION
As high-end parallel computer systems scale in number of processors, their operation, programming, and performance evaluation grow more complex. Complexity, as it arises from the evolving nature of scalable machines and applications, has been either the bane or the bugaboo (or both) of paral-lel performance tools. The general goal of any performance tool is to provide the user with an understanding of per-formance phenomena, whether that be by interactive data analysis or by more automatic methods for performance in-vestigation. However, when faced with systems and appli-cations of greater sophistication, size, and integration, the requirements to address new performance complexity goals challenge tool design, engineering, and technology.
Permission to make digital or hard copies of all or part of this work for personal or classroom use is granted without fee provided that copies are not made or distributed for profit or commercial advantage, and that copies bear this notice and the full citation on the first page. To copy otherwise, to republish, to post on servers or to redistribute to lists, requires prior specific permission and/or a fee.
SC|05November 12-18, 2005, Seattle, Washington, USA
c
2005 ACM 1-59593-061-2/05/0011 ...$5.00.
How do we build performance tools that can deliver high utility and productivity for the parallel computing commu-nity without being overwhelmed by high-end complexity de-mands? In The Path of Law (1897), Oliver Wendell Holmes wrote, “I would give my life for the simplicity on the other side of complexity.” Here Holmes is commenting on how the realities of society question the na¨ıve reason and moral-ity inherent in the practice of law. He believes the great-est potential of law as a force for change comes only from embracing societal complexities, and in doing so, the true purpose of law is realized. In the same spirit, large-scale parallel computing presents a complex face to performance tools. Tools that ignore the complexity are limited in power, either by their simplicity or by their scope. Similarly, tools that feature creative solutions but which are complicated and unusable in practice will go largely unnoticed. Parallel performance technology must acknowledge the complexity challenges of high-end systems and strive to deliver tool solu-tions of high value and productivity. Ultimately, the poten-tial of performance tools will be realized by both addressing hard performance analysis problems and by developing and delivering tools with strong computer science contributions and high engineering standards.
In this paper, we describe our research and development work onPerfExplorer, a framework for parallel performance data mining. The research is motivated by our interest in au-tomatic parallel performance analysis and by our concern for extensible and reusable performance tool technology. Perf-Explorer is built on an open performance data management framework (PerfDMF [9]) that provides a common, reusable foundation for performance results storage, access, and shar-ing. Our work targets large-scale performance analysis for single experiments on thousands of processors and for mul-tiple experiments from parametric studies. PerfExplorer ad-dresses the need to manage large-scale data complexity using techniques such as clustering and dimensionality reduction, and the need to perform automated discovery of relevant data relationships using comparative and correlation anal-ysis techniques. Such data mining operations are engaged in the PerfExplorer framework via an open, flexible inter-face to statistical analysis and computational packages, in-cluding the R system1
, WEKA2 , and Octave3 . With these 1 http://www.r-project.org 2 http://www.cs.waikato.ac.nz/ ml/weka/ 3 http://www.octave.org/
programmable packages, PerfExplorer functionality can be extended by us and others in the future.
The following sections describe how PerfExplorer is built and used for performance data mining. Section 2 outlines the goals of the PerfExplorer project and presents the Perf-Explorer framework architecture, software design and engi-neering. Here we also describe the different analysis meth-ods PerfExplorer will support in its data mining repertoire. The intent of the framework is to provide easy access to these methods and to coordinate their use. In Section 3, details on the implementation of PerfExplorer are given. In Section 4, we show the application of PerfExplorer to three performance analysis studies. The first demonstrates Perf-Explorer’s ability to rediscover performance features previ-ously found by clustering analysis in the sPPM benchmark [1]. This exercise both validates the PerfExplorer data min-ing methodology as well as demonstrates the automation of the clustering techniques. The second study applies cluster discovery methods to the Miranda code run on 8K proces-sors of the Lawrence Livermore (LLNL) BG/L machine. We show how PerfExplorer is used to uncover computational structure and per cluster performance features. The last study is a comparative analysis of the GYRO benchmark run on multiple large-scale platforms and problems sizes. Section 5 describes the related work in this area. Final con-clusions and future work are given in Section 6.
2.
GOALS AND DESIGN
The overall goal of the PerfExplorer project is to create a software infrastructure to help conduct parallel performance analysis in a systematic, collaborative, and reusable manner. The infrastructure should exist to provide easy performance data access and to link analysis capabilities. It is also im-portant to provide support to manage the analysis process. In particular, our objective is to integrate sophisticated data mining techniques in the analysis of large-scale parallel per-formance data. Given existing robust data mining tools, PerfExplorer’s design motivation is to interface cleanly with these tools and make their functionality easily accessible to the user. The analysis leverage and extensibility gained, coupled with the data and analysis process management, gives the PerfExplorer environment a powerful set of capa-bilities for performance knowledge discovery.
2.1
Complexity Management
One important goal of PerfExplorer is to reduce the degree of complexity in large performance profiles and in their analy-sis. This is accomplished by more robust support for perfor-mance data and results management as well as management of analysis processes and automation. To discover charac-teristics of an application or parallel machine which may be hidden in the data, we need flexibility in a performance data mining tool to select features of interest to investigate and mining operations to perform. PerfExplorer manages data complexity through the use of a performance data reposi-tory (PerfDMF) and by making it easy for a user to select datasets and parameters in different combinations for anal-ysis. PerfExplorer manages analysis complexity through the abstraction of data mining procedures, thereby reducing the expertise required of the user to develop these procedures or to efficiently access them via available statistical packages. There is also significant value to the automation of data
min-ing processes that may involve multiple experiments and a sequence of analysis steps.
The intended uses of PerfExplorer includes, but is not lim-ited to benchmarking, procurement evaluation, modeling, prediction and application optimization. In all these uses, the ability to quickly compare the results of several experi-ments, and summarize characteristics of large processor runs will replace the need for users to develop their own tools or manually orchestrate several tools in a analysis process. Our aim is to provide an application that does not require a per-formance expert to operate, and yet still provide meaningful performance analysis.
2.2
PerfExplorer Architecture
From the start, PerfExplorer was targeted to large-scale per-formance data analysis. The concept was one of an interac-tive environment from where analysis processes would be launched and results would be visually reviewed. Initial tests running data analyses against large data sets made it obvious that for an interactive application to be respon-sive to user events, the framework would need to be either multi-threaded or distributed. We decided to support both a client-server architecture and a multi-threaded, standalone option. In the client-server configuration, several analysis clients can share a single analysis server. Remote clients would request data mining operations and retrieve results. In a distributed environment, the architecture affords the potential to locate clients and servers where desired, and to leverage Internet and other technologies when implementing the components. For example, the PerfExplorer client has been configured to be launched from a web browser, with no prior installation or configuration of the environment or client workstation required.
The architecture can be effectively realized on a single ma-chine, when workstation performance is not an issue, or where network security may be an obstacle to distributed applications. When PerfExplorer is executed as a standalone application, the behavior of the client application is exactly the same. The only difference is that rather than requesting remote objects from a server application, the analysis would be performed in a separate thread, allowing for responsive interactive queries while long-running analysis is performed by the server thread.
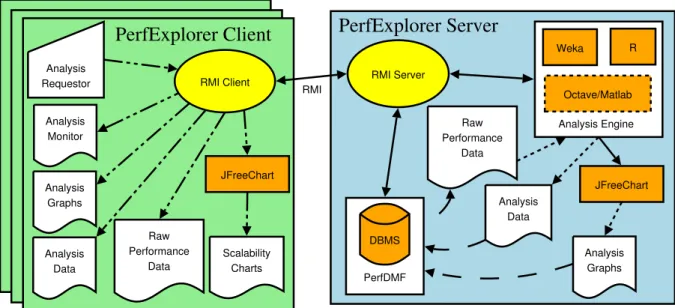
Figure 1 shows the PerfExplorer architecture. It consists of two main components, thePerfExplorer Clientand the Perf-Explorer Server. The PerfExplorer Client is a standard Java client application, with a graphical user interface developed in Swing. The client application connects to the remote PerfExplorer server (also written in Java) using Remote Method Invocation (RMI), and makes processing requests of the server. The process of performing the data mining analysis is straightforward. Using the PerfDMF API, The server application makes calls to the performance database management system (DBMS) to get raw performance data. The server then passes the raw data to an analysis engine which performs the requested analysis. Once the analysis is complete, the PerfExplorer server saves the result data to the PerfDMF DBMS. Output graphics can also be requested at the server and images saved for later review. Because the analysis server is multi-threaded, it can continue to serve
PerfDMF Analysis Graphs Analysis Data Raw Performance Data Analysis Monitor Raw Performance Data RMI JFreeChart JFreeChart Scalability Charts RMI Client Analysis
Requestor RMI Server
Analysis Data Analysis Graphs R Weka
PerfExplorer Client
DBMSPerfExplorer Server
Octave/Matlab Analysis EngineFigure 1: The PerfExplorer architecture. The Performance Client sends requests to the Performance Server. The Performance Server gets the data from the DBMS, performs the analysis using the toolkit of choice, and saves the results in the DBMS.
interactive requests to the client (or multiple clients) while performing analysis. One such type of interactive request is to perform comparative analysis. In that case, the user selects two or more data objects, and requests the data to be compared from the server. The server performs the data-base query, and returns the results to the client, which are rendered for the user. The types of interactive displays avail-able include scalability charts, four dimensional correlation scatterplots, and data summarizations.
2.3
Analysis Methods
Data mining of large-scale parallel performance data seeks to discover features of the data automatically. Some areas in which we are interested are clustering, summarization, association, regression, and correlation. Cluster analysis is the process of organizing data points into logically simi-lar groupings, called clusters. Summarization is the process of describing the similarities within, and dissimilarities be-tween, the discovered clusters. Association is the process of finding relationships in the data. One such method of association is regression analysis, the process of finding in-dependent and in-dependent correlated variables in the data. In addition, comparative analysis extends these operations to compare results from different experiments, for instance, as part of a parametric study. The objective of PerfExplorer is to provide a common framework for the incorporation of multiple analysis capabilities.
Clustering
Cluster analysis is a valuable tool for reducing large paral-lel profiles down to representative groups for investigation. Currently, there are two types of clustering analysis imple-mented in PerfExplorer. Both hierarchical and k-means
analysis are used to group parallel profiles into common clusters, and then the clusters are summarized. Initially, we used similarity measures computed on a single parallel profile as input to the clustering algorithms, although other forms of input are possible. Here, the performance data is
organized into multi-dimensional vectors for analysis. Each vector represents one parallel thread (or process) of execu-tion in the profile. Each dimension in the vector represents an event that was profiled in the application. Events can be any sub-region of code, including libraries, functions, loops, basic blocks or even individual lines of code. In simple clus-tering examples, each vector represents only one metric of measurement. For our purposes, some dissimilarity value, such asEuclidean or Manhattan distance, is computed on the vectors. As discussed later, we have tested hierarchi-cal andk-means cluster analysis in PerfExplorer on profiles with over 32K threads of execution with few difficulties. Hierarchical clustering is a form of clustering which starts with individuals, and works to organize them into clusters by merging the two closest members into a new cluster. Ini-tially, each individual is assigned to a different cluster with size 1. Using a Manhattan distance calculation between the cluster centers, the two closest clusters are merged into one cluster, and the mean is calculated for the new cluster. The process is continued until there is only one cluster. The result is typically displayed as a tree dendrogram.
k-means clustering groups the individuals into k common groups, or clusters. The clustering is performed by selecting
k initial cluster centers, and assigning the individuals to the cluster to which they are the closest, using a Euclidean distance calculation. New cluster centers are calculated as the mean of the members of the cluster, and the process is repeated until convergence. k-means clustering results are typically displayed as scatterplots.
Dimensionality Reduction
Clustering algorithms perform reasonably well on datasets of low dimensions, with ”low” defined as less than 15. Un-fortunately, we have test datasets with dimensions over 100. As pointed out by several authors[2, 8, 12], locality-based clustering methods are not fully effective when clustering
high dimensional data. In high dimensional data sets, it is very unlikely that data points are nearer to each other than the average distance between data points because of sparsely filled space. As the dimensionality increases, the difference between the nearest and farthest neighbors within a cluster goes to zero. As a result, a high dimensional data point is equally likely to belong to any cluster. Because of this, dimension reduction is necessary for accurate clustering. We have implemented three types of dimension reduction in PerfExplorer. The first type of dimension reduction is to ignore dimensions which are less significant. That is, only consider dimensions which are statistically significant with respect to the overall runtime behavior of the application. The user specifies a minimum percentage, and any events which, on average, constitute less than that percentage of the total execution are not included. For example, if time is the metric of interest and the user sets a minimum percent-age of 3%, only events which, on averpercent-age, constitute greater than or equal to 3% of the execution time will be included in the dimensions. For the sPPM application discussed further below, a setting of 1% reduced the number of dimensions from 105 down to 10. A future version of PerfExplorer will calculate and suggest a minimum percentage to the user. Another method of dimension reduction implemented is ran-dom linear projection. It has been demonstrated by Das-gupta[5] that data from a mixture of k Gaussians can be projected into justO(logk) dimensions while still retaining the approximate level of separation between the clusters. In addition, even if the original clusters are far from spherical, they are made more spherical by linear projection. Because of these two properties, random linear projection is a good solution for dimension reduction.
A third method supported in PerfExplorer isPrincipal Com-ponents Analysis (PCA). PCA is designed to capture the variance in a particular dataset in terms of the principle components, that is, the dimensions which define the maxi-mum amount of variation within the dataset. Because each component is orthogonal to, and therefore uncorrelated with, the other components, this method helps to remove corre-lated variables in the data, leaving only the data which de-scribes the maximum variance. PCA is useful in reducing the number of metrics in a dataset. Ahn and Vetter[1] used this technique to demonstrate that many hardware counters are often highly correlated.
Correlation
PerfExplorer also implementsCoefficient of Correlation anal-ysis. This is a measure of the strength of the linear relation-ship between two variables, xandy. The coefficient value will lie between 1.0 and -1.0, indicating whether there is a linear relationship (close to 1.0), no relationship (close to 0.0) or a negative linear relationship (close to -1.0) between the two variables. The coefficient of correlation is useful in determining the relationships among different events and metrics in the data. For example, in parallel applications which implement message passing, there often are relation-ships between sending and receiving events. Also, hardware counters are often highly correlated, and this type of anal-ysis can help differentiate between the metrics which will contribute to the understanding of the performance of the
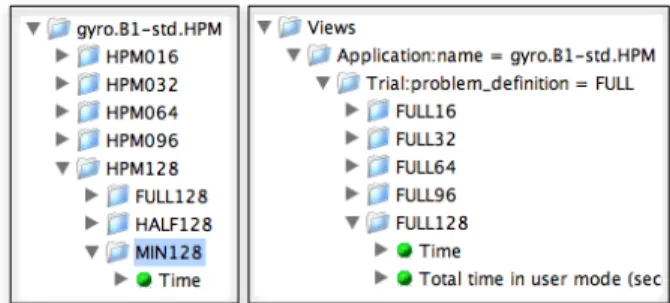
Figure 2: In this example, the data for the B1 bench-mark of the GYRO application has been loaded into the database organized by processor count, and then by input problem, as shown on the left. By creat-ing views and sub-views, as shown on the right, the same data can be reused in a scalability analysis.
application and those which can be ignored or not collected at all.
Comparative Analysis
In addition to the data mining operations available, the user may optionally choose to perform comparative analysis. The types of charts available include time-steps per second, rela-tive efficiency and speedup of the entire application, relarela-tive efficiency and speedup of one event, relative efficiency and speedup for all events, relative efficiency and speedup for all phases and runtime breakdown of the application by event or by phase. In addition, when the events are grouped to-gether, such as in the case of communication routines, yet another chart shows the percentage of total runtime spent in that group of events. These analyses can be conducted across different combinations of parallel profiles.
Views
Because the comparisons depend on the organization of the data, it is necessary to support arbitrary views of the per-formance data in the database. For example, suppose the data for a particular experiment is organized to facilitate a scalability study. If the same data is needed for a para-metric study related to the implementation of some user-tunable calculation, then it should not be necessary to re-load the data in order to re-organize it. Therefore, we have designed the comparative analysis to execute on user de-finedviews. The views are designed such that the user can select a subset of data from the database, and then further subdivide that data into different organizations based on ar-bitrary data columns. Figure 2 shows an example where the data has been loaded into the database organized by pro-cessor count, and then by input problem. By creating views and sub-views, the same data can be reused in a scalability analysis.
3.
IMPLEMENTATION
In this section, we will look in more detail at the technology involved in PerfExplorer’s construction, and take a look at the PerfExplorer user interface.
3.1
Components
The types of analysis described and their respective visu-alizations would take many man-months of development to implement. It makes much more sense to leverage the avail-able tools in the open-source community, rather than strug-gle with the complexities of implementing our own analysis routines. Several software components are needed for this research project, and we will discuss the major contributors.
TAU and PerfDMF.
PerfExplorer is an extension of the Tuning and Analysis Utilities (Tau4) project at the University of Oregon. Tau is both a framework and technology toolkit for performance instrumentation, measurement and analysis of scalable par-allel programs. It targets a general computational model consisting of shared-memory compute nodes where multi-plecontexts reside, each providing a virtual address space shared by multiplethreadsof execution. The measurement library inTauimplements performance profiling and trac-ing support for performance events, and organizes the data on a(node, context, thread) basis. Additionally, Tau pro-vides data analysis and presentation utilities, text-based and graphical tools to visualize the performance data, as well as bridges to third-party software, such as Vampir5
for sophis-ticated trace analysis and visualization. TAU’s ParaProf tool is used for parallel profile viewing.
Distributed with Tau is the Performance Data Manage-ment Framework (PerfDMF)[9]. PerfDMF is a database schema and API for building performance database appli-cations. The performance data are statistical profiles from parallel executions. The data parsers in PerfDMF support over a half dozen common parallel profile data formats (e.g., mpiP6
, dynaprof7
, HPMtoolkit[14], and TAU), and the schema represents a union of their profile data specifications. Queries to the database are constructed in standard SQL, to ensure compatibility with a large subset of DBMS implementations, assuming they provide a Java database connectivity (JDBC) interface. PerfDMF provides both a Java API and a C inter-face for accessing the data. PerfDMF provides the founda-tion on top of which we have built the performance analysis toolkit, with extends the API to perform queries against the database to characterize parallel performance behavior. While code instrumentation can be difficult, tools such as tau compiler[15] make this process much easier. With the ability to easily generate parallel profile data and store it in the PerfDMF database, we are now attempting to pro-vide easy, automated performance analysis which does not require a performance expert to produce or understand.
PostgreSQL.
PerfDMF supports many different DBMS implementations, including Oracle, MySQL, DB2 and PostgreSQL. The data-base selected for the development of this project is Post-greSQL 7.4. PostPost-greSQL is a robust, open source relational DBMS. PostgreSQL is also the primary development data-base for PerfDMF. However, the selection of the datadata-base
4 http://www.cs.uoregon.edu/research/paracomp/tau 5 http://www.pallas.com/e/products/vampir/index.htm 6 http://www.llnl.gov/CASC/mpip 7 http://www.cs.utk.edu/∼mucci/dynaprof
to use for development is immaterial, as the PerfDMF pro-vides a homogeneous interface to connect to all supported databases.
Java.
The primary development language for the tools in theTau project and PerfExplorer is Java 1.3, to ensure the maxi-mum portability among systems today. The developers of the Tau project are focused primarily on integration, re-usability, and portability, based on robust and open soft-ware. Java was selected for its near ubiquitousness, its facil-ity for extension, and for the large selection of class libraries which use Java as a code base. By using Java, we can lever-age the software base already developed and in use in the PerfDMF project, as well as other supporting libraries and frameworks.
R and Weka.
There are several techniques for statistical analysis and data mining on parallel performance data. Many of these tech-niques have already been implemented in other tools. It makes little sense to re-implement these capabilities in our own Java library. One of the goals of the PerfExplorer de-velopment is to leverage mature, open source software solu-tions where possible. In addition, if a performance analyst using PerfExplorer already has a library of analysis opera-tions which he/she has developed, we would like to integrate that functionality within the PerfExplorer framework. Cur-rently, we have designed PerfExplorer as a wrapper around two analysis packages: R and Weka.8
R is a language and environment for statistical computing and graphics. It is essentially an open source implemen-tation of the S language and environment, which was de-veloped at Bell Laboratories. R provides a wide variety of statistical and graphical techniques, and is highly extensible. R has been ported to a number of platforms. We used the available Omegahat9
interface to integrate the R analysis into the PerfExplorer Java application.
The second package we integrated is Weka, a collection of machine learning algorithms for data mining tasks. Unlike R, Weka is written entirely in Java. It contains tools for data pre-processing, classification, regression, clustering, associ-ation rules, and visualizassoci-ation. Several projects have used Weka and contributed new tools. PerfExplorer’s wrapping approach allows R and Weka to be used separately or in combination.
JFreeChart.
Each of the analysis packages mentioned have visualiza-tion funcvisualiza-tionality included, but they are dissimilar and non-uniform. Visualization is an important component of Perf-Explorer and we desire consistent visualization results, re-gardless of the choice of package for analysis. For this reason, it makes sense to use a charting graphics package written in Java to integrate into the environment. JFreeChart10
in-cludes support for a large number of charts, including pie,
8
We are presently investigating the integration of Matlab and/or Octave into PerfExplorer.
9
http://www.omegahat.org/RSJava
10
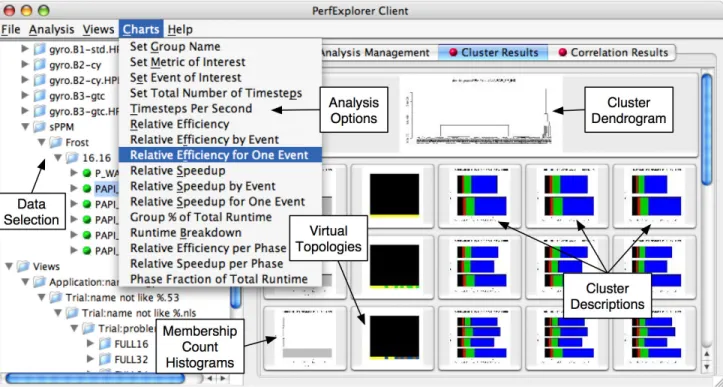
Figure 3: The PerfExplorer user interface. Performance data is organized in a tree view on the left side of the window, and the cluster analysis results are visible on the right side of the window. Various types of comparative analysis are available from the drop down menu selected.
bar, line, area, scatter, bubble, time series and combination charts. By loading the performance data and/or results in a common data format, we are able to visualize this data using one visualization call. JFreeChart can be used to gen-erate visualizations on the server side which are stored in the database, awaiting request from the client. It can also be used to generate charts in the client, for interactive data display.
3.2
User Interface
As important as the data mining functionality provided, the user’s interface to PerfExplorer will determine how produc-tively it is used. Figure 3 shows the user interface design for PerfExplorer. The PerfExplorer client serves as a man-agement console for requesting, checking the status of, and reviewing the results of analysis operations. The main client window is divided in two. The left side contains a naviga-tion tree, representing the performance data as it is stored in the database. PerfDMF data is organized in an Appli-cation / Experiment / Trial hierarchy, and that hierarchy is represented in the top of the tree. In addition, the user has the ability to create views of the data, with arbitrary organization. The views are visible in the lower section of the tree view.
The tree navigation is primarily used for selecting the fo-cus of the data analysis, requesting analysis operations, and querying the status of the analysis operations. In a sam-ple user case, as shown in Figure 3, the user will browse to the trial(s) of interest. The user then selects the relevant datasets that will form the basis of analysis. After setting
optional analysis parameters, the user will then request the analysis operation. While the operation is being performed, the user can use theAnalysis Monitor(not shown) to query the status of the analysis. As soon as preliminary results of the analysis are available, or when the analysis is com-plete, the user can access the other two tabbed consoles to examine the results.
As shown in Figure 3, theCluster Results console presents the user with a “thumbnail” view of the performance graphs generated by the analysis. If the user finds a graph that is particularly interesting, she can select the thumbnail. A larger view of the graph will be presented and additional data will be shown to the user, including the raw data, method, and numerical results that were used to generate the performance graph.
The Correlation Results console (not shown) presents the user with thumbnail views of correlation analysis. Currently, the user can request correlation analysis of events or met-rics, the result of which will help guide the selection of per-formance metrics and/or events of interest. Scatter plots are used to represent the results of the correlation analy-sis, along with tables showing the coefficient of correlation between the events and/or metrics.
When performing comparative analysis, the user can browse the data in the database, and either select data from the existing application / experiment / trial structure, or build custom views of the data. The user can then select a number of experiments, where each experiment represents a machine and parameter combination. Then the user selects a
com-parative analysis to perform from the drop-down menu at the of the application, as demonstrated in Figure 3.
4.
EXPERIMENTAL RESULTS
To demonstrate how PerfExplorer is used in practice, this section reviews our work with three large-scale parallel ap-plications: sPPM, Miranda, and GYRO. While the discus-sion highlights the data mining results for these applica-tions, the relative simplicity of using PerfExplorer should also be emphasized. Much of the analysis process is auto-mated and the user interfaces with the framework at a high level. It is straightforward to capture the analysis results graphically for reports, or have them recorded back into the performance database for later use.
4.1
ASCI Purple Benchmark: sPPM
The sPPM11benchmark solves a 3D gas dynamics problem on a uniform Cartesian mesh using a simplified version of the PPM (Piecewise Parabolic Method) code. The code is written to simultaneously exploit explicit threads for shared memory parallelism and domain decomposition with mes-sage passing for distributed parallelism. sPPM represents the current state of ongoing research and has demonstrated good processor performance, excellent multi-threaded effi-ciency, and excellent message passing parallel speedups. The sPPM code is written in Fortran 77 with some C routines, OpenMP, and MPI. We compiled and executed sPPM on parallel computing resources at LLNL. Instrumentation and measurement was done withTau. sPPM has been analyzed by others and much is known about its execution and per-formance behavior. Our interest was to see if PerfExplorer could uncover these well understood features. The pro-gram uses MPI to communicate between computer nodes and OpenMP to activate parallelism within a node. By clustering thread performance for different metrics, Perf-Explorer should discover these relationships and which met-rics best distinguish their differences.
sPPM was executed on LLNL’s Frost machine. Frost is a cluster of 16-way IBM Power3 processors running AIX. sPPM used 16 processes (one per node), with 16 threads per process for a total of 256 threads of execution. Clus-tering on execution time, initial analysis showed that events executed by the master threads dominate. Worker threads sit idle for nearly all of the time, since they are only active during short OpenMP loops. Plus, the master threads per-form all communication operations. The only metric which showed a balanced work load is that of floating point opera-tions, where the work is nearly evenly distributed among the threads. For any choice of metrics, PerfExplorer will take the clustering results and display the representative perfor-mance for each cluster based on the average perforperfor-mance from the threads that are members of the cluster.
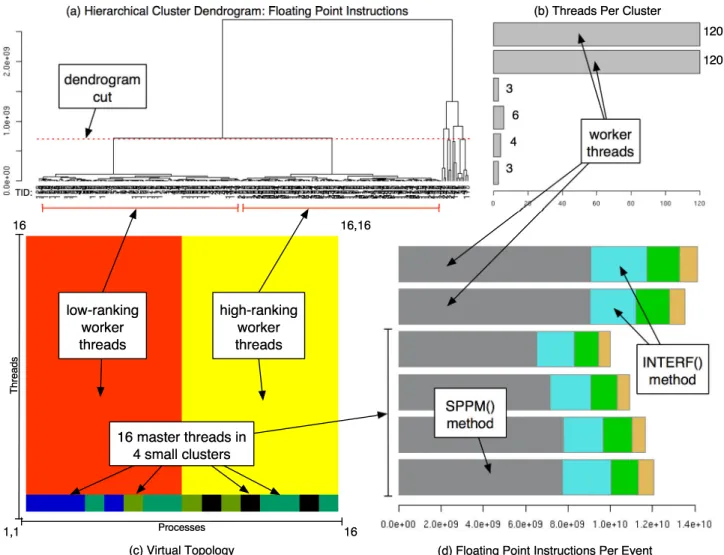
Consider the clustering analysis results for floating point instructions shown in Figure 4. The hierarchical cluster-ing is used in PerfExplorer to help the user select a logi-cal number of clusters. The dendrogram shows visually the similarity ordering between the threads. Once a number is decided by the user, the k-means clustering results are examined to determine cluster grouping and representative
11
http://www.llnl.gov/asci/purple/benchmarks/
performance. The virtual topology gives a view of how clus-ters map to threads and processes. As seen in Figure 4, the floating point instructions in sPPM have an unusual cluster-ing. As noted by Ahn and Vetter[1] and reproduced here, the higher ranking threads seem to execute 3% fewer float-ing point instructions than lower rankfloat-ing threads. This is appears to be true only for the worker threads. A selection ofk≥6 is required to show this relationship in the cluster results. Further investigation shows that the difference is primarily in theINTERFmethod, used to construct the sim-plest possible monotone parabolae within zones of the grid. However, when the application is run on MCR, a cluster of dual-processor machines, the higher ranking threads execute
morefloating point instructions in theINTERFmethod than the lower ranking threads do, for both worker and master
threads.
4.2
LLNL Application: Miranda
Miranda[3] is a research hydrodynamics code ideal for sim-ulating Rayleigh-Taylor and Richtmyer-Meshkov instability growth. It is written in Fortran 95 and uses MPI for commu-nication between processes. The code uses 10th-order com-pact (spectral-like) or spectral schemes in all directions to compute global derivative and filtering operations. The data is transposed to perform sparse linear (pentadiagonal) solu-tions and FFTs, which requires mostly synchronous com-munication in the form of MPI Alltoall onp
Npx, y com-municators for global operations, where Np is processors, and xandydefine the problem size. There are some MPI reductions and broadcasts for statistics. The current in-put/output model is n→n, that is, each CPU writes and reads its own restart and graphics data files. The Miranda application has been ported to the BlueGene/L (BG/L) ma-chine12
at LLNL, and has been executed in configurations up to 32K processors. Prior to the experiments on BG/L, Miranda showed good scalability when tested up to 1728 CPUs, with communication scaling for fixed workload per CPU.Tauwas used to instrument and measure the Miranda application on BG/L. Experiments were done with 4K, 8K, 16K and 32K processors and the performance profiles were loaded into the PerfDMF database. Note, this performance data does not represent the current state of the application or machine, but shows some interesting knowledge discovery capability of the PerfExplorer framework.
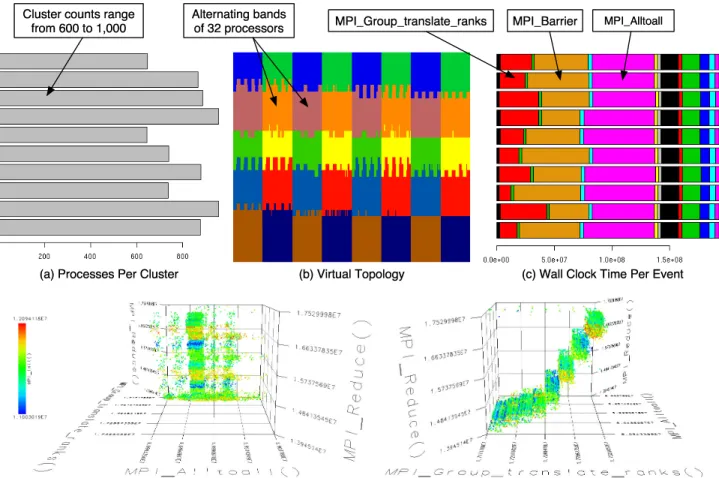
Figure 5 shows some of the clustering results for the 8K pro-cessor data. What is immediately apparent is the pattern of cluster assignment to virtual topology. This is probably related to the physical design of the BG/L system – there are 32 processor chips per node board, and 32 node boards per cabinet. The events that primarily caused the clusters were the MPI Barrier call and theMPI Alltoall call. In-terestingly, there were no such patterns in the 16K data, due to the fact that the 16K run occurred later than the 8K run, and reflected improvements to both the communi-cation infrastructure and to the code itself. However, both datasets showed the same gradual change from first to last processor, showing a relationship betweenMPI Barrierand
MPI Group translate ranks. Specifically, the Miranda ap-plication on BG/L has an inverse relationship between the functionsMPI BarrierandMPI Group translate ranks. As
12
! " # $ % &' () **)* + , -. / 01 2 32 2 4 2 4 2 4 32 4 # 5 # 6 " 7 8 9 :; < = >? @ABC D E ? BC A FC GAHI JAB? C G E K H L M K CA N N 4 O 2 P Q 2 P Q VW X Y Z [ \] 7 ! # :J < b BHAI @ >S ? c ? >? D d e f" 5 g5 6 ! " # $ ! g6 ! f" 5 g5 6 ! " # $ h ij k l m 7 " $ ! " # $ g5 n $ 7 " ee 8 e 9 $ $ o p p q \] 7 ! #
Figure 4: The dendrogram in (a) shows cluster relationship of floating point instructions when running sPPM on Frost. For clustering withk= 6, the histogram in (b) shows membership counts for each cluster and the graphic in (c) shows the virtual topology of the 16 processes (columns) and 16 threads (rows). Notice the worker threads are split into two distinct clusters. (d) shows the average behavior for each cluster. Notice that the higher ranked worker threads (second bar graph down) execute fewer floating point instructions in the INTERF() method.
the MPI rank of the process gets larger, theMPI Barriercall takes more time, and theMPI Group Translate Ranks call takes less time. This behavior in the application is due to the MPI communication implementation on the BG/L architec-ture, and unofficial reports from LLNL are that IBM contin-ues to improve the performance of the communication archi-tecture. In the later sets of data, the negative linear relation-ship betweenMPI BarrierandMPI Group Translate Ranks
has also disappeared, again probably due to improvements in the performance of the machine. However, in the more recent 8K data, subtle relationships still exist in the nearly uniform data, in the form of alternating bands of 32 pro-cesses.
Figure 5 (d) shows some performance data from a different 8K processor execution of the Miranda application, after ad-ditional modifications have been made. What the two iso-metric views show is the relationships between the four MPI
events. This view is constructed by selecting the four events in the data which experience the most variance in their re-spective ranges, weighted by percentage of total execution time, across processes. Because the Miranda application is very regular and balanced, the four events selected happen to be MPI events, and variation in their values is mostly determined by their physical and logical distance from the root MPI process. However, there are other patterns, such as the staircase of eight clusters when examiningMPI Reduce
toMPI Group translate ranksreflecting the hardware con-figuration of eight racks of 1K processors.
4.3
GYRO
GYRO[6] is a physics code that simulates tokamak turbu-lence by solving the time-dependent, nonlinear gyrokinetic-Maxwell equations for both ions and electrons. It uses a five-dimensional grid and advances the system in time us-ing a second-order, implicit-explicit (IMEX) Runge-Kutta
rs t u vw x y z z y z u y v { |} z~y v r t v~} s | w w |w rx t s || { |w x y u y v y ~ w vw x y z z w vz vw ~w u vw } ~vs z |s~y vs z u s vvy v ¡ ¢ r t £ ¤¥ y z w s | z w y~vx y¦ z w § § ¤ s vs x y y y ~z u ¨ y } x y u ||~w s || u vw } ~vs z |s~y vs z s u ~
Figure 5: These figures show the relationship between threads of execution when executing Miranda on BG/L. For clustering on execution time withk = 10, the histogram in (a) shows a relatively small variation for cluster membership counts, and the graphic in (b) shows the virtual topology of the 8192 processes organized arbitrarily in 32 rows of 256 processes. The alternating bands of behavior are clearly visible as the viewer progresses from left to right, bottom to top, from processor 1 to processor 8192. (c) shows the average behavior for each cluster. Although the clusters are not ordered, with careful viewing it should be obvious that there are two groups of behavior for MPI Alltoall, and a negative linear relationship between
MPI Group translate ranks and MPI Barrier. (d) shows a 4 Dimensional Scatterplot of Miranda events after modifications were made to the source code. The events shown were selected because these events have the most variance within their range, weighted by percentage of total execution, across the 8K processors.
(RK) integrator. The equations are solved in either a local (fluxtube) or global radial domain. GYRO is the only GKM code that has both global and electromagnetic operational capabilities. GYRO has been ported to a variety of modern platforms, and the data which we have analyzed includes ports to the Cray X1, SGI Altix, TeraGrid, and the IBM p690 and SP3.
GYRO is the subject of a PERC [13] tool evaluation effort underway at Oak Ridge National Laboratory. The scientists there have executed the application many times on several machines with different configurations in an effort to per-form an in-depth analysis of GYRO, and to evaluate current performance tools. As theTauproject team is participat-ing in this effort, we have access to the performance data available to date. This data comes from various sources: embedded timers, HPMToolkit, MPICL, mpiP, and Tau. Preliminary comparative analysis by ORNL of the
embed-ded timers was done manually using spreadsheets for data input and statistical displays. Our interest was to see what productivity gains could be realized using PerfExplorer. The PerfDMF parsers give the advantage of importing pro-file data from multiple sources. Parsers were already avail-able for HPMToolkit, mpiP, and TAU. For our comparative analysis study, we decided to focus on the data collected by the hand-instrumented timers. It was a simple matter to write a PerfDMF parser for this data. The instrumentation tracks seven events of interest, two of which are communi-cation events, and the data is divided into execution phases. There are three benchmark data sets used (B1, B2, and B3), each with a different number of time-steps. The B1 bench-mark runs for 500 time-steps, and outputs performance data every 50 time-steps, giving ten phases. This data was loaded into the PerfDMF database as call-path data, modeled af-ter the new phase-based analysis data structures available
±¶ ·¸¸±¹ ±· ¶ ¹º » ¼ º ½ ¾ µ ¿ ¿ À ¶ ±¹ ®Á±µ ¶ ´µ ÀÁ±¶ ·  ¾ µ ÃÃÄ Á´ ±¯ Á · ¿ ® ±¶ ¹ ® À ¯ · ÅÅÅ Æ µ ´ ¾ µ ÃÃÄ Á´Â µ ¶ ú Á · © ª « ¬ ´À ¶ ¯ ®Ç · Á ±¯ ³ ´µ © ±¶ · ¸¸±¹ ±· ¶ ¹º È Á· ´® Á±µ ¶ ª ® ³ ³ ´µ © ±¶ · ¸¸±¹ ±· ¶ ¹º ¸µ ´ É Ê Ë © ´µ ¹ · ¯ ¯ µ ´¯ Ì µ ´· Ç ® ´±® ° ±Ã±Áº ° · ÁÍ · · ¶ © ® ¯ · ¯ ¸µ ´ ±² © ´µ ¹ · ¯ ¯ µ ´ ¹ µ À ¶Á Î ® Ï Ð Ç · ´® ÃÃ Ñ · îÁ±Ç · Ò ¸¸±¹ ±· ¶ ¹º ¸µ ´ ® Ãà ¹ µ ¶¸±² À ´®Á±µ ¶ ¯ Î ° Ï Ñ · îÁ±Ç · Ò ¸¸±¹ ±· ¶ ¹º ¸µ ´ ® Ãà ·Ç · ¶ Á¯ µ ¶ µ ¶ · ¹ µ ¶ ¸±² À ´®Á±µ ¶ Î ¹ Ï Ñ · î Á±Ç · Ò ¸¸±¹ ±· ¶ ¹º ¸µ ´ µ ¶ · · Ç · ¶Á µ ¶ ® Ãà ¹ µ ¶ ¸±² À ´® Á±µ ¶ ¯ Î ³ Ï Ñ · îÁ±Ç · Ò ¸¸±¹ ±· ¶ ¹º ¸µ ´ ® Ãà © ® ¯ · ¯ µ ¶ µ ¶ · ¹ µ ¶ ¸±² À ´® Á±µ ¶ ° ® ¯ · ¹ ® ¯ ·
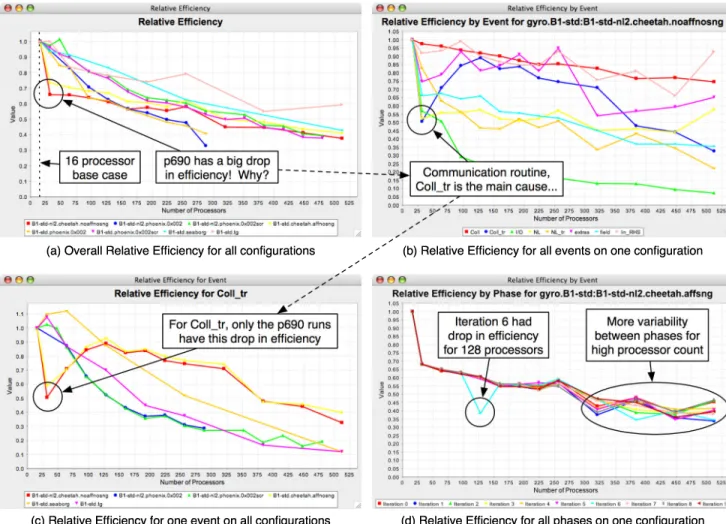
Figure 6: Relative Efficiency comparisons for various machines and configurations when running the GYRO application. In (a), there is a noticeable drop in efficiency for the two IBM p690 runs (cheetah), when looking at total execution time. By comparing the scalability of all events for that particular execution, we see that the significant cause for the drop is due to poor performance for the Coll tr event, shown in (b). The other three events which scale poorly are I/O related, and/or do not contribute to a large percentage of the total execution time. By comparing this event on all machines and configurations, we see that the p690 is the only machine in the study that has this drop in efficiency for this event, shown in (c). Figure 6(d) is an example of phased-based performance analysis, showing variability between time-steps in GYRO.
inTau. Because the data given was aggregate data across all processors, cluster analysis would be of no use, as the data would form one cluster (the average behavior). So, we focused our attention to comparative evaluation across the combinations of benchmark type, machines, and platform configurations.
As mentioned above, there are several types of comparison available in PerfExplorer. The figures in Figure 6 show the relative efficiency comparison for the B1 benchmark. We start by comparing the total execution time for the appli-cation, across all machines and configurations in the study, using 16 processors as our base case. In Figure 6(a), it is obvious that the IBM p690 (cheetah) has a sharp dip in ef-ficiency when going from 16 to 32 processors. PerfExplorer provides the ability to “drill-down” through the data, for example, 6(b) shows the relative efficiency by event for only one configuration of the p690. This view is, in effect, a event
scalability view. The statistically significant dip in efficiency is caused primarily by the Coll tr event, which performs transpose communications before and after the main colli-sion routine. By doing a total execution percentage break-down (not shown), we learned that the other events which do not scale well do not contribute significantly to the over-all runtime of the application. By looking at the data from another perspective in Figure 6(c), we can view only the
Coll tr event for all machines/configurations in the study, and see that only the p690 has this large dip in efficiency, for both configurations tested. In contrast to hand-generated analysis, it is important to realize that PerfExplorer is per-forming the analyses interactively with the user. It is cer-tainly possible to have the production of the graphs seen here be fully automated through the use of scripting, which will be implemented. This could, for instance, enable per-formance regression reports to be generated with little user intervention. Also, PerfExplorer’s access via PerfDMF to
performance data from multiple tools and perspectives pro-vides the opportunity to do more integrative analysis. Unrelated to the previous three figures, Figure 6(d) shows the breakdown of a single execution by phase (based on time-steps), and shows the variability in the time to solution (shown as relative efficiency) for each phase as the number of processors increase. The phases here are in 50 time-step in-tervals. One aspect of the data visible is that the variability appears to increase as the number of processors increases. In addition, in this particular execution, iteration 6 had some drop-off in performance, which was found to be a 3x increase in the amount of time spent in one communication routine (NL tr) during that phase. This is probably an anomaly due to an unusual network load.
5.
RELATED WORK
The primary inspiration for the data mining aspect of Perf-Explorer is the research by Ahn and Vetter[1]. Those au-thors chose to use several multivariate statistical analysis techniques to analyze parallel performance behavior. The types of analysis they performed included cluster analysis and F-ratio, factor analysis, and principal component anal-ysis. They showed how hardware counters could be used to analyze the performance of multiprocessor parallel ma-chines. One of their interesting results is that many hard-ware counters collect closely correlated, and therefore redun-dant metrics. They found that data mining techniques were useful in discovering interesting features in the data. The demonstrated usefulness of this type of analysis inspired us to create PerfExplorer. We saw the need for a tool because this analysis was in an ad-hoc manner. While not all of the analysis methods described are currently implemented in PerfExplorer, the primary component (cluster analysis) and PCA methods available and we implementing the oth-ers using the capabilities in Weka and/or R.
Another major inspiration for the PerfExplorer project is the work done by Sherwood et al[16]. The primary goal of their SimPoint application is to reduce long-running ap-plications down to tractable simulations. The authors met that goal by statistically sampling the instruction mix of a running serial application to determine where the applica-tion spent its time. The authors define the concept of “basic block vectors”, and use those concepts to define the behav-ior of blocks of execution, usually one million instructions at a time. In a similar way, we used threads of execution as instruction vectors in our preliminary work. Re-applying the similarity graphics used in their paper, we were able to show the differences between threads of execution by on Manhattan distance calculations. The basic block similar-ity matrix was the inspiration for our thread of execution similarity matrix. In addition, this research was one of the inspirations for adding phase analysis toTau profile data collection and analysis, and for adding a phase-based focus to the comparative analysis.
The Prophesy system[18] uses some statistical analysis meth-ods to do application performance analysis. Prophesy uses three types of analysis, curve fitting, parameterization method and kernel coupling. Because the curve fitting analysis is de-pendent on input parameters to the application, it is helpful in exploring application scalability but not in exploring
dif-ferent system configurations. The parameterization method involves static analysis of small sections of code to deter-mine a parametric function describing the performance of that section of code. Kernel coupling is used to model the interaction between different kernels of code within the ap-plication. Our work differs from Prophesy in that the anal-ysis done by Prophesy seeks to develop an accurate, pre-dictive model for a parallel application, rather than charac-terize empirical data, detect performance characteristics or diagnose performance problems.
The PPerfDB[7] and PPerfXchange[4] projects provide tools for performing comparative analysis on parallel application profile data. PPerfDB associates circumstantial attributes with the performance data, and represents each execution as a hierarchical collection of resources. By selecting a sub-set of attributes and/or resources, the user is able to se-lect a subset of performance trials, and simple comparative analysis is performed on the trials selected. PPerfDB can compare performance results collected from different tools (heterogeneous data), by translating the data into a com-mon data format prior to the comparison. PPerfXchange ex-tends PPerfDB to support geographically dispersed, hetero-geneous data stores, implemented using Web Service tech-nology. Additionally, PPerfXchange supports comparisons between flat file data and data located in a database through a common XML protocol.
The LLNL project called PerfTrack aims to further extend the PPerfDB project to include every variable that can be reasonably collected about a parallel application execution, and store the performance data and associated environment information in a relational database. The PerfTrack tool will provide a user interface to navigate the performance results by selecting resource foci, and querying the related data. When that project is further along, we hope to integrate our data mining analysis with that application.
Song et al.[17] have developed an algebra for performance analysis across experiments. The unique feature of their ap-proach is the closure property. Derived data and raw data are in the same format, so it is easy to chain together anal-ysis operations to do comparative analanal-ysis between experi-ments. This way, it is easy to compare executions when do-ing optimization analysis, or regression testdo-ing to check the performance improvement or degradation of a code change. HPCToolkit [10] is also a powerful performance analysis tool that is able to merge profile data from multiple performance experiments into a database file and perform various statis-tical and comparative analyses. The HPCView [11] compo-nent of the toolkit provides a interactive interface that allows the user to define expressions to compute derived metrics as functions of the measured data and of previously-computed derived metrics. The HPCToolkit group is now investigating clustering analysis and workflow processing.
6.
CONCLUSION AND FUTURE WORK
PerfExplorer is a next-generation tool for large-scale paral-lel performance analysis based on data mining techniques. Although the application of these techniques to parallel per-formance data involves a certain degree of sophistication, we designed PerfExplorer as an extensible framework to exploit
the rich products of data mining research, as they are repre-sented in accessible libraries and tools. In this way, we can focus our attention on providing users of PerfExplorer with easy, intuitive access to data mining capabilities. We feel it is important to emphasize PerfExplorer is also a framework for other tool developers. It is extensible in several ways and we hope it can become a widely used environment that serves to simplify the complexity of parallel performance problem solving.
We are pursuing several directions of PerfExplorer research. Many of the data mining techniques assume certain ties of the data. It is important to verify that these proper-ties hold. We intend to add support in PerfExplorer to help the user understand these assumptions and even to auto-matically test for properties where possible. As observed in
k-means cluster analysis, some techniques require a choice of parameters before proceeding. How these parameters are chosen may depend on prior analysis and certain goodness criteria. PerfExplorer may be able to provide some assis-tance in the form of results testing, for insassis-tance, to deter-mine a good “cut” location from hierarchical clustering to seed k-means. We are looking into other ways to provide more automation in the data mining, including automated cluster evaluation in the form of within-cluster variance or silhouette calculations.
An interesting direction to explore is in the area of depen-dency modeling. Dependepen-dency modeling discovers and de-scribes dependencies between variables in the data. The dependencies can be either structural or quantitative, with specified strengths or weights. Some potential methods to show dependencies include Bayesian graphs and fuzzy di-graph di-graphs. There may be some scalability problems with probabilistic dependency modeling due to its NP solution space – each permutation of the data yields a specific prob-ability. In addition, the continuous numeric data in the parallel performance data would have to be bracketed into discrete intervals for this type of analysis.
7.
ACKNOWLEDGMENTS
This research is supported by the U.S. Department of En-ergy, Office of Science, under contracts DE-FG03-01ER25501 and DE-FG02-03ER25561.
8.
REFERENCES
[1] D. Ahn and J. Vetter. Scalable analysis techniques for microprocessor performance counter metrics. In
Proceedings of Supercomputing, 2002.
[2] K. Beyer, J. Goldstein, R. Ramakrishnan, and U. Shaft. When is “nearest neighbor” meaningful? In
Lecture Notes in Computer Science, volume 1540, pages 217–235, 1999.
[3] W. Cabot, A. Cook, and C. Crabb. Large-scale simulations with miranda on bluegene/l. Presentation from BlueGene/L Workshop, Reno, 14–15 October 2003.
[4] M. Colgrove. Querying geographically dispersed, heterogeneous data stores: The pperfxchange approach. Master’s thesis, Portland State CS Department Masters Thesis, 2002.
[5] S. Dasgupta. Experiments with random projection. In
Proceedings of the 16th Conference on Uncertainty in Artificial Intelligence, pages 143–151. Morgan Kaufmann Publishers Inc., 2000.
[6] M. Fahey and J. Candy. Gyro: A 5-d
gyrokinetic-maxwell solver. InSC ’04: Proceedings of the Proceedings of the ACM/IEEE SC2004 Conference (SC’04), page 26, Washington, DC, USA, 2004. IEEE Computer Society.
[7] C. Hansen. Towards comparative profiling of parallel applications with pperfdb. Master’s thesis, Portland State University Computer Science Department, 2001. [8] A. Hinneburg, C. Aggarwal, and D. Keim. What is
the nearest neighbor in high dimensional spaces? In
The VLDB Journal, pages 506–515, 2000.
[9] K. Huck, A. Malony, R. Bell, and A. Morris. Design and implementation of a parallel performance data managment framework. InProceedings of the
International Conference on Parallel Computing, 2005 (ICPP2005), pages 473–482, 2005.
[10] J. Mellor-Crummey. Hpctoolkit: Multi-platform tools for profile-based performance analysis. In5th International Workshop on Automatic Performance Analysis (APART), November 2003.
[11] J. Mellor-Crummey, R. Fowler, and G. Marin. Hpcview: A tool for top-down analysis of node performance.The Journal of Supercomputing, 23:81–101, 2002.
[12] B. Milenova and M. Campos. O-cluster: Scalable clustering of large high dimensional data sets. Oracle Corporation, 2002.
[13] PERC. Performance evaluation research center.
http://perc.nersc.gov/main.htm.
[14] R. Sakellariou, J. Keane, J. Gurd, and L. Freeman, editors.The Hardware Performance Monitor Toolkit, volume 2150/2001. Springer-Verlag Heidelberg, 2001. [15] S. Shende and A. D. Malony. The tau parallel
performance system.The International Journal of High Performance Computing Applications, ACTS Collection Special Issue 2005.(to appear).
[16] T. Sherwood, E. Perelman, G. Hamerly, and B. Calder. Automatically characterizing large scale program behavior. InProceedings of the 10th international conference on Architectural support for programming languages and operating systems, pages 45–57. ACM Press, 2002.
[17] F. Song, F. Wolf, N. Bhatia, J. Dongarra, and S. Moore. An algebra for cross-experiment performance analysis. InProceedings of 2004 International Conference on Parallel Processing (ICPP’04), pages 63–72, Montreal, Quebec, Canada, 2004.
[18] V. Taylor, X. Wu, and R. Stevens. Prophesy: An infrastructure for performance analysis and modeling of parallel and grid applications.SIGMETRICS Perform. Eval. Rev., 30(4):13–18, 2003.