3
rd
Annual Report 2009
National Environmental Research Institute
Aarhus University
rd
Annual R
epor
NUUK ECOLOGICAL RESEARCH OPERATIONS
Title: Nuuk Ecological Research Operations Subtitle: 3rd Annual Report 2009
Editors: Lillian Magelund Jensen and Morten Rasch Publisher: National Environmental Research Institute©
Aarhus University – Denmark
URL: http://www.neri.dk
Year of publication: 2010
Please cite as: Jensen, L.M. and Rasch, M. (eds.) 2010. Nuuk Ecological Research Operations, 3rd Annual Re-port, 2009. National Environmental Research Institute, Aarhus University, Denmark. 80 pp. Reproduction permitted provided the source is explicitly acknowledged.
Layout and drawings: Tinna Christensen
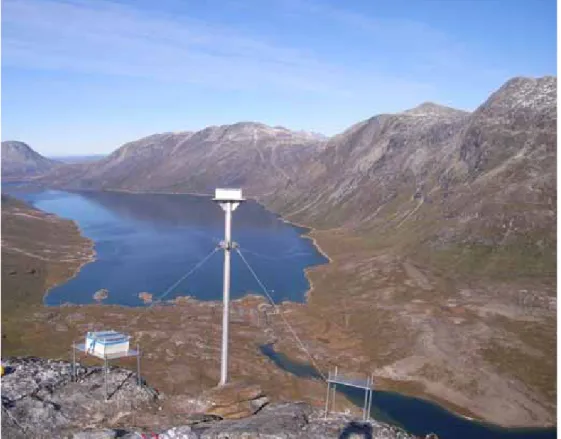
Front cover photo: The new research hut at Kobbefjord, Nuuk. Photo: Henrik Philipsen
Back cover photo: Biologist Alli Lage Labansen on her way down a bird cliff to collect data about breeding kitti-wakes on the island Qeqertannguit in Godthåbsfjord. In the bagground Qoornup Qeqertarssua (Bjørneøen) with the two mountains Marassissoq (left) and Qoornup Qaaqarssua (right). Photo: Lars Maltha Rasmussen
ISSN: 1904-0407
ISBN: 978-87-7073-209-3
Paper quality: Paper 80 g Cyclus offset Printed by: Schultz Grafi sk A/S Number of pages: 80
Circulation: 650
Internet version: The report is available in electronic format (pdf) on www.nuuk-basic.dk/Publications and on www.dmu.dk/pub
Supplementary notes: This report is free of charge and may be ordered from Nuuk Basic Secretariat
National Environmental Research Institute, Aarhus University P. O. Box 358, Frederiksborgvej 399
DK-4000 Roskilde
E-mail: [email protected] Phone: +45 46302155
Nuuk Ecological Research Operations (NERO) is together with Zackenberg Ecological Re-search Operations (ZERO) operated as a centre without walls with a number of Danish and Greenlandic institutions involved. The two programmes are gathered under the umbrella organization Greenland Ecosystem Monitoring (GEM). The following institutions are in-volved in NERO:
National Environmental Research Institute, Aarhus University: GeoBasis, BioBasis and MarineBasis programmes
Greenland Institute of Natural Resources: BioBasis and MarineBasis programmes Asiaq - Greenland Survey: ClimateBasis programme
University of Copenhagen: GeoBasis programme
The programmes are coordinated by a secretariat at National Environmental Research Insti-tute at Aarhus University, and are fi nanced with contributions from:
The Danish Energy Agency
The Danish Environmental Protection Agency The Government of Greenland
Private foundations
Executive Summary 5
Kisser Thorsøe, Birger Ulf Hansen, Peter Aastrup, Thomas Juul-Pedersen, Lillian Magelund Jensen and Morten Rasch
1 Introduction 9
Morten Rasch and Lillian Magelund Jensen
2
Nuuk Basic: The ClimateBasis programme 11
Karl Martin Iversen and Kisser Thorsøe
3
Nuuk Basic: The GeoBasis programme 17
Birger Ulf Hansen, Karl Martin Iversen, Mikkel P. Tamstorf, Charlotte Sigsgaard, Mikkel Fruergaard, Stine Højlund, Magnus Lund, Katrine Raundrup, Mikhail Mastepanov, Julie Marie Falk, Lena Ström, Andreas Westergaard, Bo Holm Rasmussen and Torben R. Christensen
4
NUUK BASIC: The BioBasis programme 29
Katrine Raundrup, Peter Aastrup, Josephine Nymand, Torben L. Lauridsen, Liselotte Sander Johannsson, Paul Henning Krogh, Magnus Lund and Lars Maltha Rasmussen
5
NUUK BASIC: The MarineBasis programme 42
Thomas Juul-Pedersen, Søren Rysgaard, Paul Batty, John Mortensen, Anja Retzel, Rasmus Nygaard, AnnDorte Burmeister, Dorte H. Søgaard, Winnie Martinsen, Mikael K. Sejr, Martin E. Blicher, Dorte Krause-Jensen, Peter Bondo Christensen, Núria Marbà, Birgit Olesen, Alli L. Labansen, Lars Maltha Rasmussen, Lars Witting, Malene Simon and Fernando Ugarte
6 RESEARCH
PROJECTS 62
6.1 Linking ice sheet thinning and changing climate, FreshLink 62
Søren Rysgaard, Carl Egede Bøggild, Roland Kallenborn, Naja Mikkelsen, Niels Nørgaard-Pedersen, Anton Kuijpers, Dirk van As, Rene Forsberg, Sine M. Hvidegaard, Henriette Skourup, John Mortensen, Dorthe Petersen, Kisser Thorsøe, Martin Truffer, Monika Trümper, Thomas Juul-Pedersen and Kunuk Lennert
6.2 FreshNor; the freshwater budget of the Nordic Seas 63
Søren Rysgaard and John Mortensen
6.3 Copepods feeding in a glacial marine environment – effects of suspended sediments 64
Kristine Engel Arendt, Jörg Dutch, Sigrún Huld Jónasdóttir, Signe Jung-Madsen, Eva Friis Møller and Torkel Gissel Nielsen
6.4 Dynamics of autotrophic and heterotrophic activity in sub-arctic fi rst-year sea ice 65
Dorte Haubjerg Søgaard, Morten Kristensen, Søren Rysgaard, Ronnie N. Glud, Per Juel Hansen and Karen Marie Hilligsøe
6.5 Evidence for strong trophic coupling between macrozoobenthos and wintering eiders in Nipisat Sound, SW Greenland 65
Ronnie N. Glud, Paul Batty, Peter Berg, Martin E. Blicher, Eva Friis Møller, Anni Glud, Andrew Hume, Kunuk Lennert, Torkel Gissel Nielsen, Kam Tang and Søren Rysgaard
6.7 Arctic Tipping Points 67
Dorte Krause-Jensen
6.8 Mercury (Hg) transport from the terrestrial to the marine environment 68
Frank F. Rigét, Mikkel P. Tamstorf, Martin M. Larsen, Gert Asmund and Karl Martin Iversen
7
Disturbances in the study area 69
Peter Aastrup
8 Logistics 70
Henrik Philipsen
9
Personnel and visitors 72
Compiled by Thomas Juul-Pedersen
10 Publications 74
Compiled by Lillian Magelund Jensen
11 References 76
Compiled by Lillian Magelund Jensen
Executive Summary
Kisser Thorsøe, Birger Ulf Hansen, Peter Aastrup, Thomas Juul-Pedersen, Lillian Magelund Jensen and Morten Rasch
Introduction
2009 was the third year of operation of the fully implemented Nuuk Basic pro-gramme (including both a terrestrial and a marine component), and it was the fi rst year with complete annual time series for all sub-programmes. The new research hut in Kobbefjord was taken in use during August 2009.
ClimateBasis
The ClimateBasis programme gathers and accumulates data describing the climato-logical and hydroclimato-logical conditions in Kob-befjord. Two automatic climate stations (C1 and C2), two automatic hydrometric stati-ons (H1 and H2) and three diver statistati-ons (H3, H4 and H5) measure data.
The two climate stations are placed next to each other to ensure data continuity. Sixteen climate parameters, including two derived parameters, are monitored, and data are stored in a database.
In Kobbefjord, measurements of the water level and discharge started in 2006 at H1, at H2, H3 and H4 in 2007 and at H5 in 2008. Manual measurements of discharge were in 2009 continued at H1, H3, H4 and H5. H1 and H2 are measuring throughout the year, while measurements at H3, H4 and H5 starts up in early spring when the rivers are free of snow and ice, and ends in late autumn before the river freeze.
In both 2007 and 2008, stage-discharge relations (Q/h-relation) were established for H1, but after the 2008 season there was still a lack of measurements at high water level. In 2009, measurements were made at high water levels and a new Q/h-relation was established. For H2, H3, H4 and H5 there are still a lack of discharge measure-ments to establish reliable Q/h-relations. For H1, which is placed at the main river in Kobbefjord, the total discharge during 2009 was 39.2 million m3. The peak
discharge in 2009 was recorded on 27 June and was caused by precipitation. In late September, a combination of snowmelt and precipitation resulted in a water level just one centimetre lower than the one recorded in June. During this event, fi ve manual dis-charge measurements were carried out.
GeoBasis
The 2009 season was the second f ull season for the GeoBasis programme with a fi eld season between May and late September. However, due to cooperation with other re-search projects, the programme continued until late October. In the previous year, the programme unfortunately ran into several unforeseen problems (e.g. catabatic winds destroying several installations, snowdrifts preventing the automatic cameras from monitoring expected areas, high levels of melt water in the snow pack with follow-ing fl oodfollow-ing of data logger etc.). Most of these problems were solved during the 2009 season. A new micrometeorological station M1000 at 1000 m a.s.l. was installed in October 2009 in collaboration with Cli-mateBasis. The station (M1000) will serve as both a microclimate station and a data communication link to Nuuk.
Melting of snow and ice started in the beginning of May and by mid-June, all snow on the east side of the main river outlet had melted. The ice cover on the lakes in the area broke up in early to late June 2009, eleven to thirteen days later than in 2008. Due to logistical problems, only one snow survey was carried out in mid-April 2009 in cooperation with the ClimateBasis programme. Snow depth varied from 37 cm to 163 cm. The general pattern of snow distribution is mainly controlled by microclimate and small-scale topography variations resulting in very heterogeneous snow cover conditions. The micrometeorological station at 1000 m a.s.l. (M1000) completes the installation
of the climate stations along the altitudinal range represented in the study area. Nor-mal temperature lapse rate with decrea-sing temperatures with altitude prevails on an annual basis in 84 % of the time. In-version prevailed up to 33 % of the time in March due to shadows from surrounding mountains and snow cover with a subse-quent radiative cooling of the valley fl oor. At the three automatic soil stations in the area i.e. SoilFen, SoilEmp and SoilEmpSa, the inter-annual variations in the different parameters were documented in 2009. Due to the effect of lesser snow cover in the last quarter of 2009 soil tem-peratures in the upper 30 cm averaged –1.0 °C at the Empetrum site compared to 0.3 °C in 2008. In 2009, thirty soil-water samples were collected from two depths at the fen site and the Empetrum site.
The temporal methane (CH4) fl ux pat-tern in 2009 was similar to the patpat-tern observed in 2008 with a dome-shaped peak with maximum about a month after snow melt and declining to about half of the peak maximum towards the end of the summer season (around 1 September). In the autumn, the methane fl ux continued to decline and it decreased consistently during September and October. The peak summer emissions in 2009 were approxi-mately 8 mg CH4 m-2 h-1 compared to 5 mg CH4 m-2 h-1 in 2008.
The temporal variation in daily net ex-change of CO2 were initiated 15 May and continued until 31 October. In 2009, the period with net CO2 uptake lasted until 27 August, which was 11 days later than in 2008. During this period the fen accu-mulated 42.5 g C m-2. The estimated net uptake period was approximately 57 days in 2009 and the maximum daily uptake reached 1.48 g C m-2 d-1 compared to 2.27 g C m-2 d-1 in 2008.
In 2009, GeoBasis Nuuk has completed the installation of instruments necessary for the run of the programme. The second full year has provided valuable learning lessons that will improve the programme even further in the following years.
BioBasis
We now have two years of data collected by the BioBasis programme. Generally, there is a high consistency in data collected during the two years indicating that the data and the procedures used are reliable and sound.
The year 2009 had a later snowmelt than 2008. A preliminary review of data related to fl owering and plant reproductive pheno-logy indicate that 2009 was characterised by later fl owering. However, fl owering terminated at roughly the same time as in 2008 resulting in a shorter fl owering sea-son. The two species on sparsely vegetated plots, Silene acaulis and Loiseleuria
procum-bens, produced more fl owers in 2009 than
in 2008, while the two species on highly vegetated plots, Eriophorum angustifolium and Salix glauca, produced fewer fl owers. The general pattern is that vegetation greening (measured as NDVI) starts as soon as the snow has melted in June with a peak of greenness in mid-summer (20 July to 5 August) and a gradual decrease in greenness resulting in more or less bell-shaped curves and gradually levelling off during autumn until the frost sets in. Measurements of the land-atmosphere exchange of CO2 using the closed chamber technique, soil temperature, soil moisture and phenology of Salix glauca have been conducted weekly during June-September since 2008. All plots generally functioned as sinks of CO2. The net CO2 uptake was generally higher in control plots compared with plots with increased temperature and plots with shading. These results show the initial response of the heath ecosystem to the treatments, and may not be indicative of long-term trends. It is thus important to run the experiment for several years to be able to study possible changes over time. Arthropods were sampled during the period 28 May to 2 October. No identifi ca-tions of specimens have been carried out yet. Soil characterisation of the microar-thropods plots was completed showing signifi cant differences between plots. Extraction effi ciency was satisfactory and species determinations have been double-checked with good results. There is a striking absence of epigeic collembolans, which may probably be a common feature of many arctic tundras and heaths. The
Sa-lix and Empetrum plots were very similar
in terms of abundance and diversity when comparing the two sampling years 2007 and 2009. Only few distinct phenological patterns were detected in the data over the two to three months sampling period. The most common breeding passerine bird species were snow bunting and Lap-land bunting with about 20 territories each. Only one territory of northern wheatear was observed and two to fi ve redpoll
in-dividuals were seen. Censuses from bird observation points revealed fewer birds in 2009 compared to 2008.
Lake ecology is studied in two lakes: Badesø (with fi sh) and Qassi-sø (without fi sh). Nutrient levels are generally low in the two lakes. However, in 2009 especially nitrogen levels were lower than in 2008. In contrast, the Secchi depth decreased in Badesø in 2009, whereas it increased, as expected, in Qassi-sø from 2008 to 2009. Temperature differs slightly with the lo-west temperature in Qassi-sø. In Qassi-sø the zooplankton biomass was, in general, higher than in Badesø. The ratio between zooplankton and phytoplankton is higher in Qassi-sø than in Badesø. This refl ects the fi sh predation on the zooplankton in Badesø, which in turn are less effective in grazing the phytoplankton.
MarineBasis
The MarineBasis programme has collected monthly and seasonal data on abiotic and biotic parameters in the marine environ-ment since October 2005, along with annual observations on seabirds and marine mam-mals since 2007 in Godthåbsfjord. The aim of the long-term monitoring programme is to understand the link between dynamics in abiotic and biotic parameters (i.e. physi-ochemical conditions, marine productivity, sinking fl ux and re-mineralization, benthic-pelagic exchange, species abundance and composition) and climatic forcing. Monitoring of the sea ice conditions, using satellite imagery, shows maximum sea ice cover in Baffi n Bay lasting until April/May and followed by a decrease in sea ice cover, reaching a minimum in July/ August. By December, sea ice had again covered much of the northern and western parts of Baffi n Bay. Local satellite observa-tions showed a more pronounced sea ice coverage of the inner part of Godthåbs-fjord during the winter 2008/09 compared to previous years.
Pelagic sampling showed the re-occur-ring seaward export of freshwater from glacier and snowmelt forming a fresher and warmer surface layer towards Akia. This surface layer contained the highest phytoplankton biomass values observed throughout the year. Nevertheless, local vertical mixing at the entrance of the fjord created largely homogenous hydrographi-cal conditions throughout the water column
at the ‘Main Station’ in spring, and resulted in elevated phytoplankton biomasses at depth. The reoccurring spring phytoplank-ton bloom in May, led to an abrupt decrease in nutrient levels. Nonetheless, a minor secondary phytoplankton bloom occurred in August, as observed in previous years. Nutrient levels were only completely reple-nished during autumn, primarily through introduction of offshore nutrient rich wa-ters. Primary production levels (i.e. peak and annual levels) were lower than in previ-ous years, and annual primary production varied by a factor 2.7 during the four annual time series (i.e. 2006-09).
The highest temperatures and salini-ties along the length section during spring were recorded in the West Greenland current fl owing northward outside Fyllas Banke, as observed in previous years. Still, the annually highest measured tempera-tures and lowest salinities were observed at the ‘Main Station’ during summer. As seen in previous years, the freshwater ex-port declined during autumn and colder weather conditions resulted in a cooling of the surface waters.
Several stations outside Fyllas Banke and within the fjord showed surface water
pCO2 levels above atmospheric concentra-tions. Also monthly pCO2 values during autumn exceeded atmospheric levels. Hence, the Godthåbsfjord system was not as strong a CO2 sink as seen in previous years. Moreover, the average annual sur-face pCO2 concentrations at the ‘Main Sta-tion’ have been constantly increasing du-ring the four year time series (i.e. 2006-09), although it remains below the atmospheric concentrations.
The phytoplankton community was dominated by diatoms throughout the year. Contrary to previous years, diatoms dominated during spring when Phaeocystis (i.e. Haptophyceae) previously has been most abundant. Zooplankton showed signifi cantly lower concentrations than in previous years, although a similar sea-sonal succession between copepods, nau-plii and other zooplankton was observed. Again, Microsetella sp. remained the most abundant copepod species throughout most of the year. Fish larvae generally oc-curred in highest numbers at the ‘Main Station’ along the length section from Fyllas Banke to the inner part of the fjord. Previously, the highest concentrations of fi sh larvae at the ‘Main Station’ were recorded in spring, but in 2009, the
high-est numbers were found during autumn. This was primarily due to a decrease in sand eel larvae during spring and a slight increase in capelin larvae du-ring autumn. A seasonal species succession, from arctic shanny to capelin, occurs at the ‘Main Sta-tion’ between spring and autumn. Cod larvae were only observed in May and July. Seasonal patterns in shellfi sh larvae showed similarities with 2008, although species concentrations differed. Prelimi-nary data indicate that jellyfi sh were more abundant from May to August in 2009 than in the previous year. The length sec-tion generally showed low numbers of crab and shrimp larvae in 2008 and 2009 compared to 2007, although they remained present at the ‘Main Station’ in all three years.
The vertical sinking fl uxes of total particulate material remained compara-ble with previous years, but showed signifi cantly less monthly variability. The low carbon content of the sinking mate-rial through all years refl ects the strong infl uence of lithogenic material from terre-strial sources in the inner part of the fjord. Moreover, two distinct peaks in sinking fl ux of total particulate carbon in August and October may be related to the release of particulate material during draining of two glacial melt ponds in the inner part of the fjord. The estimated annual carbon sinking fl ux remains the highest on record largely driven by the two distinct peaks in carbon sinking fl uxes. Sinking fl uxes of chlorophyll a followed the seasonal phyto-plankton production in the water column. The sediment (sampled four times per year) showed the highest oxygen con-sumption in May when biological activity (e.g. bioturbation) and the sinking fl ux of organic material were high. Oxygen con-sumption was comparable during the other periods, and oxygen was depleted within 1 cm of the sediment surface during all sam-pling periods. The physiological status of the dominant sea urchin remained similar to previous year, while the dominant scal-lop showed a small but signifi cant increase in physiological status. Food availability and water temperature seem to be the key parameters for their physiological condi-tions, although this cannot yet be statistical-ly verifi ed. The large brown kelp Laminaria
longicruris showed a tendency towards
larger individual biomass, although the blades had similar length, during the three-year sampling period (2007-09). Moreover,
the nitrogen content and C/N ratio of the algae varied signifi cantly between years, refl ecting differences in the supply and de-mand of nitrogen and of carbon storage. Seabird monitoring at a colony
(Qeqer-tannguit) in Godthåbsfjord indicated
that kittiwakes, Iceland gulls and arctic terns seemed to do better than in 2008, although some counts where still lower than in 2006-07. Similarly, at the colony (Nunngarussuit) south of Godthåbsfjord the number of guillemots (i.e. common and Brünnich’s guillemot) were higher than in 2008, but remained lower than in 2007. Picture analysis showed that 9 % of the identifi ed guillemots were boreal com-mon guillemots, while the rest was arctic Brünnich’s guillemots.
Monitoring of humpback whales was changed to focus only on photo identifi -cation based on individual fl uke colour patterns. Photo identifi cation will later be used for mark-recapture analyses to estimate numbers of humpback whales in Godthåbsfjord. Photo identifi cation can also be used for investigating residence time (i.e. how long the animals stay in a given area) and site fi delity (i.e. individu-als returning to an area in different years). In 2009, seven individuals were re-identi-fi ed from 2007-08 and eight new individu-als were identifi ed. Preliminary data sug-gest that fewer animals re-enter the fjord from year to year, although this cannot yet be conclusively established with the small available sample size.
Research projects
In 2009, eight different research projects were carried out in cooperation with Nuuk Ecological Research Operations. The research projects all focused on dif-ferent biological topics in the limnic com-partment of the ecosystem. The research projects are presented in Chapter 6.
1 Introduction
Morten Rasch and Lillian Magelund Jensen2009 was the third year of operation of the now fully established Nuuk Basic pro-gramme. During the 2009 fi eld season, the establishment of the terrestrial programmes – ClimateBasis, GeoBasis and BioBasis – were completed. The severe failures we experienced in 2008 on especially the fi eld equipment and the automatic installations belonging to the ClimateBasis and Geo-Basis programmes have been corrected or new installations have been established. The 2009 fi eld season in Kobbefjord started 14 January and continued until 16 December. During this period 34 scientists spend approximately 242 ‘man-days’ in the study area.
1.1 New research hut at
Kobbefjord
The new research hut at Kobbefjord was taken in use during August 2009. The hut, which was generously funded by Aage V. Jensen Charity Foundation, includes excel-lent fi eld facilities for accommodation, stor-age and preliminary laboratory analyses. As such, the 55 m2 hut is a perfect base for the research and monitoring activities under the framework of Nuuk Ecological Research Operations, which will allow for a more effi cient execution of the fi eld activi-ties related to the Nuuk Basic programme.
1.2 Nuuk Basic Secretariat
After the closure of the Danish Polar Centre 31 December 2008, the Secretariats for Nuuk Ecological Research Operati-ons (NERO), Nuuk Basic, Zackenberg Research Station, Zackenberg Ecological Research Operations (ZERO), Zackenberg Basic and Greenland Ecosystem Monito-ring (GEM) have been accommodated at the National Environmental Research In-stitute at Aarhus University.1.3 Funding
Nuuk Basic is funded in by the Danish Energy Agency and the Danish Environ-mental Protection Agency with contribu-tions from Greenland Institute of Natural Resources, Asiaq – Greenland Survey, Na-tional Environmental Research Institute at Aarhus University and University of Co-penhagen. Most of the necessary research infrastructure, including boats, research hut, offi ce and accommodation facilities at Greenland Institute of Natural Resources etc., have generously been provided by Aage V. Jensen Charity Foundation.
1.4 Greenland Climate
Research Centre in Nuuk
On 23 November 2009, the Greenlandic Minister for Culture, Education, Research and Church Affairs, Mimi Karlsen, inau-gurated the Greenland Climate Research Centre. The Centre, which is funded by the Danish Ministry of Science, Technolo-gy and Innovation, is placed at Greenland Institute of Natural Resources and led by Professor Søren Rysgaard. A major aim of the centre is to make use of the data provided by Greenland Ecosystem Monitoring (GEM) to evaluate the effects of climate change on Greenlandnature systems and society. It is the vision of the centre to ‘be a leading
international centre for studies on the impact of climate change in Arctic ecosystems and society’. Further information con-cerning Greenland Climate Research Centre is available on www.natur.gl.
The Greenland Climate Research Centre Logo.
1.5 Nuuk Climate Days
The Nuuk Climate Days conference was held in Nuuk between 25 and 27 August 2010. The conference was organised by the Technical University of Denmark, Danish Meteorological Institute and Greenland Climate Research Centre. 150 world-leading scientists were attending the con-ference to discuss climate change and its consequences in Greenland. Several pre-sentations included data from Greenland Ecosystem Monitoring.
1.6 International cooperation
Nuuk Ecological Research Operations has been involved in the ongoing interna-tional work with the overall purpose of establishing a Sustaining Arctic Observing Network (SAON), an initiative approved by Arctic Council. Many bottom-up driven initiatives are taken for establish-ment of observing platforms to become components of a future SAON. Greenland Ecosystem Monitoring is involved in two of the larger initiatives, i.e. Svalbard In-tegrated Arctic Earth Observing System (SIOS) and International Network for Ter-restrial Research and Monitoring in the Arctic (INTERACT). SIOS is a network of different organisations working with earth observations on Svalbard and in its nearest surrounding. INTERACT is a programme launched by the network SCANNET (a circumarctic network of 32 terrestrial fi eld bases) to coordinate their activities. Both projects applied for extensive funding through EU 7th Framework Programme late in 2009, and we hope to be able to launch both programmes during 2010. Greenland Ecosystem Monitoring has a relatively limited role in SIOS but a signifi -cant role in the leadership of INTERACT together with Abisko Scientifi c Research Station.1.7 United Nations Climate
Change Conference in
Copenhagen (COP15)
In December 2009, Denmark hosted the United Nations Climate Change Conferen-ce in Copenhagen (COP15). Nuuk Eco-logical Research Operations was visible during the conference with exhibitions and several lectures at two side events, i.e.‘Arctic Venue’ (a Danish side event) and ‘In the Eye of the Climate’ (a Greenlandic side event).
1.8 Further information
Further information about the Nuuk Basic programme is collected in previous annual reports (Jensen and Rasch 2008 and 2009). Much more information is available on the Nuuk Basic website: www.nuuk-basic.dk
including manuals for the different moni-toring programmes, a database with data from the monitoring, up-to-date weather information, a Nuuk Basic bibliography and a collection of public outreach papers in PDF-format.
The Nuuk Basic programme’s address is:
Nuuk Basic Secretariat
National Environmental Research Institute Aarhus University P.O. Box 358 Frederiksborgvej 399 DK-4000 Roskilde Phone: +45 46 30 21 55 E-mail: [email protected]
Greenland Institute of Natural Resources provides the logistics in the Nuuk area,
Logistics Coordinator
Greenland Institute of Natural Resources P.O. Box 570 Kivioq 3900 Nuuk Greenland Phone: +299 550562 E-mail: [email protected]
2 Nuuk
Basic
The ClimateBasis programme
Karl Martin Iversen and Kisser Thorsøe
The ClimateBasis programme gathers and accumulates data describing the cli-matological and hydrological conditions in the Kobbefjord area. Two automatic climate stations (C1 and C2), two auto-matic hydrometric stations (H1 and H2) and three diver stations (H3, H4 and H5) monitor the physical parameters necessary to describe the variations in climate and hydrology.
Location of the different stations can be seen in fi gure 2.1. ClimateBasis is operated by Asiaq – Greenland Survey.
2.1 Meteorological data
During 2009, the climate stations in Kobbe-fjord were visited twice by Asiaq techni-cians and fourteen times by other Asiaq personnel. The maintenance of the stations included reference test of important para-meters, among them the UV-B radiation, and replacement of the following sensors: Snow Depth, RVI, PAR and Net Radiati-on (Lite). On C2, the four compRadiati-onent net radiometer (CNR1) was also replaced. A full description of the climate stations are given in Jensen and Rasch 2008.
C1 C1 C2 C2 C1 C2 H1 H1 H1 H2 H2 H2 H3 H3 H3 H4 H4 H4 H5 H5 H5 0 2 4 km N Stream Glacier Lake Land Climate station Discharge site Hydrometric station Kobbefjord drainage basin Smaller drainage basin
Figure 2.1 Location of the climate (C1, C2), hy-drometric (H1, H2) and diver stations (H3, H4, H5) in Kobbefjord together with the drainage basin of Kobbefjord and the drainage basin for the hy-drometric stations and the diver stations.
Further work was made on developing technical solutions to improve measure-ments of precipitation and RVI, and to facilitate automatic data retrieval from Nuuk. The automatic data retrieval system was tested in 2009, and when it becomes operational in 2010, it will directly impro-ve the data resilience for all connected stations, which will be C1, C2, H1 and H2 and some stations run by GeoBasis. Meteorological data 2009
This annual report describes data from the second full year of measurements col-lected during the period 1 January to 31 December 2009. Figure 2.2 gives an over-view of the meteorological parameters measured in 2009.
The annual mean of recorded air tem-peratures in 2009 was –1.3 °C, table 2.1. The coldest month was March with an average temperature of –12.1 °C and a minimum temperature as low as –24.0 °C. The war-mest month was July with temperatures averaging 9.9 °C and a maximum tempera-ture as high as 21.0 °C. Compared with the climate normal for Nuuk (1961-90), the recorded temperatures in Kobbefjord 2009 were below normal during spring and autumn (March to May and September to November) and above normal during the months January, February, June to August and December (Cappelen et al. 2001). The general weather pattern observed from January through March does not differ from previous described winter 1 Jan 1 Feb 1 Mar 1 Apr 1 May 1 Jun 1 Jul 1 Aug 1 Sep 1 Oct 1 Nov 1 Dec
Wind direction (deg ree) Wind speed (m s –1 ) Outg. SW r ad. (W m –2) Inc. SW r ad. (W m –2) Net r adiation (W m –2) Sno w depth (m) Air pressure (hP a) Relativ e humidity (%) Air temper ature (°C) 20 10 0 –10 –20 –30 –40 100 80 60 40 20 0 1050 1025 1000 975 600 400 200 0 800 600 400 200 0 800 600 400 200 0 30 20 10 0 360 270 180 90 0 1.2 0.8 0.4 0 No data Figure 2.2 Variation of
climate parameters mea-sured in 2009. From above: Air temperature, relative humidity, air pres-sure, snow depth, net radiation, incoming short wave radiation, outgoing short wave radiation, wind speed and wind direction. Wind speed and direction are measured 10 m above terrain; the remaining pa-rameters are measured 2 m above terrain.
conditions. This period was characterized by long periods with easterly winds and low temperatures. Occasionally, the stable winter weather situation was interrupted when low pressures passed over the area, bringing rising temperatures, westerly winds, high wind speeds and often preci-pitation. The most frequent wind direction in April was WNW, and the precipitation amounted to 110 mm. March and May had easterly winds and average precipitation around 61 mm. The average temperature in May was 3.6 °C lower than in May 2008, though the last day with a mean air temperature below the freezing point was recorded 15 May which was approxi-mately the same as in 2008 (13 May). The last three years the mean air temperature in July has not varied more than 1.0 °C (table 2.2). During the same period May and June mean air temperatures have varied more than 3.1 °C. In fact, May 2009 was the coldest May recorded since 2007. From June until the end of August the dominant wind direction was WSW and air pressure was stable and relatively high (table 2.1). Especially July and August had very stable weather characterized by almost no precipitation, a high frequency of clear sky conditions and an almost har-monic diurnal variation in wind speed, temperature and relative humidity. In fi gure 2.2, clear sky conditions can be ob-served as periods with high positive net radiation during the day and negative net radiation during the night.
In September, the most frequent wind was from NE but low pressures brought
humid air in from west resulting in plenty of precipitation by the end of September. A total of 202 mm was recorded in September, which was the wettest month in 2009. Pas-sing low pressures during autumn are often associated with very high wind speeds. From October to December, three occasions with mean wind speed above 15 m s-1 were registered compared with six in 2008. The fi rst snow fall was recorded 26 September and permanent snow cover at the climate stations started 17 October, al-though rain and above zero temperatures around 30-31 December almost melted away all snow at the stations and partially exposed soil and vegetation underneath the radiation masts.
The levels of selected radiation para-meters are displayed in table 2.3. The table presents a new parameter: the Normalized
Differential Vegetation Index or NDVI (Asiaq
Report 2010). The vegetation underneath the radiation masts had its maximum greenness in August (0.33). The period with positive month mean net radiation was, as in 2008, May to September. Month 2009 Rel. hum. (%) Snow depth (m) Air temp. (°C) Air pressure (hPa) Precip. (mm) Wind (m s-1)
Max 10 min. wind (m s-1) Wind dir. most frequent January 65.5 0.484 –6.1 986.9 45 3.5 15.0 ENE February 67.5 0.492 –6.9 1001.2 36 3.5 12.6 ESE March 71.3 0.634 –12.5 1005.8 67 2.6 19.8 ESE April 76.3 0.807 –4.0 1001.4 110 2.9 12.4 WNW May 70.1 0.846 –0.5 1002.0 55 2.8 14.9 ENE June 73.9 --- 5.6 1011.3 129 3.0 14.4 WSW July 69.2 --- 9.9 1011.5 1 3.0 8.8 WSW August 73.8 --- 8.5 1004.3 5 2.5 9.5 WSW September 70.6 --- 3.0 998.5 202 3.0 11.3 NE October 66.5 --- –1.3 1005.7 57 3.4 11.1 NE November 72.0 --- –8.7 999.3 33 3.6 12.9 NE December 58.9 0.331 –3.5 1005.4 99 4.2 20.0 ENE 2009 69.6 --- –1.3 1002.8 838 3.2 ---
---Table 2.1 Monthly mean values of climate parameters from January to December 2009. For 2009 also annual mean temperature, mean relative humidity, mean air pressure, mean wind speed and accumulated precipitation.
Table 2.2 Comparison of monthly mean air temperatures, 2007 to 2009 (May is in-complete in 2007). Month 2009 Air temp. °C Month 2008 Air temp. °C Month 2007 Air temp. °C
May –0.5 May 3.1 May –0.2
June 5.6 June 7.2 June 4.1
July 9.9 July 10.1 July 9.1
August 8.5 August 7.9 August 9.8
2.2 River water discharge
Hydrometric stationsIn 2009, hydrological measurements were carried out at fi ve places in the Kobbe-fjord area. Two hydrometric stations were established in 2007, and divers are each year deployed in three minor rivulets to Kobbefjord. The drainage basins of the fi ve locations cover 58 km2, corresponding to 56 % of the 115 km2 catchment area to Kobbefjord.
In fi gure 2.1, the location of the hydro-metric stations (H1, H2) and the diver stations (H3, H4, H5) can be seen. For fur-ther descriptions of the stations and their respective drainage area, see Jensen and Rasch 2009. For descriptions of the hydro-metric stations, see Jensen and Rasch 2008.
Q/h-relation
Manual discharge measurements were carried out at station H1, H3, H4 and H5 (respectively 14, 4, 4 and 4 times) during 2009, with the purpose of establishing a stage-discharge relation (Q/h-relation). It is generally recommended to base a Q/h-relation on a minimum of 12-15 discharge measurements covering the water levels normally observed at the station (ISO 1100-2, 1998). For H2, H3, H4 and H5 these numbers of discharge measurements have still not been carried out. Therefore, data from these stations are not presented. In 2009, 14 discharge measurements were carried out at H1. Six of the mea-surements were carried out during winter when the outlet was infl uenced by snow and ice. The hope for 2009 was to mea-sure discharge at high water levels. As Table 2.3 Monthly mean values of selected radiation parameters in 2009.
Month 2009 NDVI Albedo Short wave rad. Long wave rad. Net rad. PAR UVB
in (W m-2) out (W m-2) in (W m-2) out (W m-2) (W m-2) (µmol s-1 m-2) (mW m-2)
January –0.01 0.90 4.3 3.8 243.8 274.0 –31.2 11.7 0.2 February –0.06 0.90 17.7 15.9 239.9 271.4 –30.6 46.6 1.0 March –0.11 0.93 72.4 64.7 222.3 247.4 –26.7 172.7 4.4 April –0.11 0.86 159.8 136.7 260.8 290.6 –5.4 390.6 12.8 May –0.11 0.70 239.6 167.0 270.5 306.9 36.4 568.4 23.1 June 0.21 0.13 203.9 27.2 304.0 354.2 126.5 475.8 21.4 July 0.31 0.15 263.7 41.4 300.0 384.1 134.3 594.9 26.0 August 0.33 0.16 181.2 30.5 306.1 369.5 87.3 389.9 15.5 September 0.28 0.15 80.3 14.0 292.0 328.7 29.9 175.6 5.7 October 0.05 0.52 24.6 11.1 253.9 298.4 –28.0 60.1 2.0 November –0.11 0.96 7.1 6.7 220.4 261.0 –39.8 19.2 0.4 December –0.03 0.89 1.8 1.7 240.3 279.7 –39.2 5.2 0.1
Q/h-relation for H1, from 20 June 2006 Q = 33.54(h-98.68)1.8947 98.6 98.7 98.8 98.9 99.0 99.1 99.2 99.3 0 1 2 3 4 5 6 7 8 9 10 11 12 Discharge Q (m3 s-1) S tage h (m above sea l e vel)
Q/h-relation Measurements used in Q/h-relation Measurements, not used
Figure 2.3 Discharge – water level relation curve (Q/h-relation) at the hydro-metric station H1. The co-effi cient of correlation (R2)
2009 was very dry with almost no rain we had almost given up, but a snowfall in late September followed by rain and temperatures above zero gave high water levels. On 30 September and 1 October, fi ve discharge measurements were carried out during falling water. With the mea-surements carried out in 2009, the manual discharge measurements spans over wa-ter levels ranging from 0.07 to 10.16 m3 s-1 (discharges under ice-free conditions range from 0.13 to 10.16 m3 s-1). The total measured span in water level under ice free conditions during 2006 to 2009 are 0.54 m (differs from earlier publication). A new Q/h-relation was established after the 2009 season. Manual discharge measurements now cover the total span of the registered water levels and accordingly the Q/h-relation is considered fi nal. The Q/h-relation for H1 is shown in fi gure 2.3. River water discharge at H1
Figures 2.4 and 2.5 shows the re-evaluated discharges from H1 in 2007 and 2008, whi-le fi gure 2.6 shows data from 2009. The re-evaluated data has been calculated by
use of the new Q/h-relation. During the period March 2007 to February 2010, ele-ven measurements have been carried out when the outlet was affected by ice and/ or snow. These measurements indicate that the Q/h-relation based on discharges measurements made under ice and snow free conditions can be used under normal winter conditions (periods without heavy thaw and rain events) to estimate the dis-charge accurately but will overestimate the discharge during thaw and rain.
In 2009, the period with ice/snow free conditions at the outlet was from 28 May to 22 October.
The total discharge from H1 during the hydrological year from 1 October 2008 to 30 September 2009 was 39.2 million m3, which is 17 % lower than in 2007/2008. The total discharge corresponds to a run-off of 1265 mm when assuming that the drainage basin covers 31 km2. The peak discharge (12.0 m3 s-1) was recorded 27 June and was caused by precipitation. July and August were rather dry with almost no precipitation. After a small peak 15 July caused by melting of the snow in the
Discharge (m 3 s -1) A c cu mu lated disch arg e (mill. m 3) 0 2 4 6 8 10 12 14 1 Jan 29 Jan 26 Feb 26 Mar 23 Apr 21 May 18 Jun 16 Jul 13 Aug 10 Sep 8 Oct 5 Nov 3 Dec 31 Dec 0 6 12 18 24 30 36 42 Manual discharge measurements
Discharge Acc. discharge Discharge (m 3 s -1) A c cu mu lated disch arg e (mill. m 3) 0 2 4 6 8 10 12 14 1 Jan 29 Jan 26 Feb 25 Mar 22 Apr 20 May 17 Jun 15 Jul 12 Aug 9 Sep 7 Oct 4 Nov 2 Dec 30 Dec 0 6 12 18 24 30 36 42 Manual discharge measurements
Discharge Acc. discharge
Figure 2.4 River water dis-charge at H1 during 2007.
Figure 2.5 River water dis-charge at H1 during 2008.
higher lying areas of the catchment, the discharge decreased almost continuously to 0.36 m3 s-1 on 27 September. During 26 September, it started to rain and the tem-perature rose to above 0 °C resulting in melting of the 11 mm w.e. snow precipita-tion. The following days the temperature remained above 0 °C, and rain continued almost constantly until 1 October which caused the discharge to rise to 11.6 m3 s-1 (30 September) before falling to ap-proximately 1 m3 s-1 a week later. After this event, only small variations in the discharge were recorded as most precipi-tation fell as snow.
A comparison of discharge with pre-cipitation has been made for the hydro-logical year 2008/2009. The precipitation at the meteorological stations, C1 and C2, was 1285 mm whereas the runoff from H1 equalled 1265 mm. The difference between
the precipitation in the catchment and the runoff at H1 is, as can be seen, minimal, but that does not mean that all the hydro-logical processes in the low arctic area in Kobbefjord are understood. Even though the new Q/h-relation has strongly im-proved the validity of discharge under ice-free conditions there remain uncertainties when it comes to describing discharges during wintertime. In addition, diffi culties in measuring precipitation, especially the geographical distribution, have to be con-sidered. Furthermore, the catchment area has to be recalculated when the digital elevation model for the area is complete. One of the aims for the ClimateBasis pro-gramme is to understand the hydrological processes in the low arctic area around Kobbefjord, and the above-mentioned fac-tors will among others, be investigated in the following years.
Discharge (m 3 s -1) A c cu mu lated disch arg e (mill. m 3) 0 2 4 6 8 10 12 14 0 6 12 18 24 30 36 42 Manual discharge measurements
Discharge Acc. discharge 1 Jan 29 Jan 26 Feb 26 Mar 23 Apr 21 May 18 Jun 16 Jul 13 Aug 10 Sep 8 Oct 5 Nov 3 Dec 31 Dec
Figure 2.6 River water dis-charge at H1 during 2009.
3 Nuuk
Basic
The GeoBasis programme
Birger Ulf Hansen, Karl Martin Iversen, Mikkel P. Tamstorf, Charlotte Sigsgaard, Mikkel Fruergaard, Stine Højlund, Magnus Lund, Katrine Raundrup, Mikhail Mastepanov, Julie Marie Falk, Lena Ström, Andreas Westergaard, Bo Holm Rasmussen and Torben R. Christensen
The GeoBasis programme provides long-term data of climatic, hydrological and physical landscape variables describing the environment in the Kobbefjord drainage basin close to Nuuk. GeoBasis was in 2009 operated by the Department of Geography and Geology, University of Copenhagen and the Department for Arctic Environ-ment, National Environmental Research Institute at Aarhus University. GeoBasis was in 2009 funded by the Danish Ministry for Climate and Energy as part of the envir-onmental support programme DANCEA – Danish Cooperation for Environment in the Arctic. A part-time position is placed in Nuuk at Asiaq – Greenland Survey. The GeoBasis programme includes monitoring of the physical variables within snow and ice, soils, vegetation and carbon fl ux. The programme runs from 1 May to the end of September with some year round measure-ments from automated stations.
The 2009 season is the second full sea-son of the GeoBasis programme. In 2007, the fi eld programme was initiated during a three-week intensive fi eld campaign in August when most of the equipment was installed, although some installations had to be postponed until 2008.
Little knowledge was available about local topographic and microclimatic vari-ations during the installation of sensors and stations in 2007. Therefore, the pro-gramme ran into unforeseen problems (e.g. very strong winds that destroyed several installations, build up of snow-drift in front of cameras, high levels of melt water in the snow pack with sub-sequent fl ooding of data logger etc.). Al-though these unforeseen problems have caused gaps in the data series, most of the experienced problems have been solved during the 2009 season.
3.1 Snow and ice
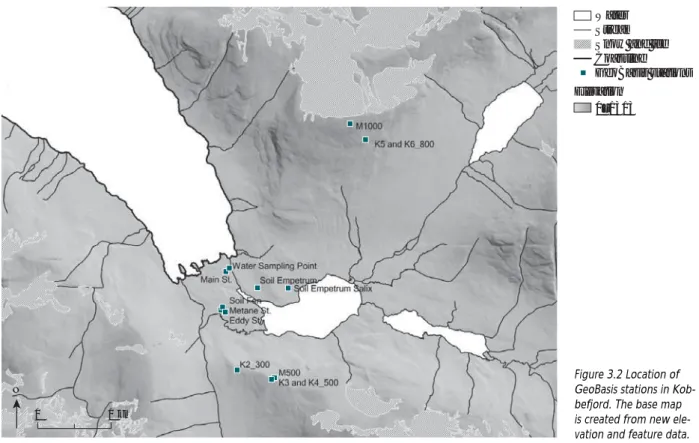
Snow cover extentAutomatic cameras were installed in 2007 at 300 and 500 m a.s.l. to monitor the snow cover extent in the central parts of the Kob-befjord drainage basin. Lack of information on the snow conditions at the cameras posi-tions resulted in K3 and K4 to be installed to close to the ground, and subsequently a big snowdrift from mid-February to late June 2008 covered them. In 2009, these cameras melted free around 1 July. In September 2009, both cameras were elevated 2 m above the ground but the fi eld of views are kept alike (fi gure 3.1). In the same operation, the last two snow monitoring cameras (K5 and K6) were installed. Both cameras were installed at 770 m a.s.l. (N64 °9’06.25’’ W51 °20’46.47’’) (fi gure 3.2). K5 monitors Qassi-sø in the northern valley of the drainage ba-sin while K6 is facing south monitoring the central parts of the drainage basin including Badesø and Langesø.
One of the main advantages of camera-based snow monitoring is that it is relative-ly insensitive to cloud cover (in contrast to satellite-based techniques). Only low clouds and foggy conditions can make the image data unsuitable for mapping purposes. A new updated and more user-friendly algo-rithm for snow cover monitoring has been developed in MatLab, making it possible for each melting season to construct snow cover depletion curves for user specifi ed regions of interest (ROI) on the basis of image data obtained at daily frequency. Figure 3.3 show the results for three ROI at respectively 200, 250 and 300 m a.s.l. seen from camera K2. The ROI at 300 m a.s.l. is facing west against the dominating wind direction which causes a smaller snow accumulation and an earlier
snowmelt with 50 % of the snow cover gone by 2 May in 2008. A more extensive snowfall during the winter and spring 2008/2009 caused a delay in the snow melt, and 50 % snow cover was reached 23 days later in 2009 compared to 2009. The ROI’s at 200 and 250 m a.s.l. are facing to the north which cause a leeward accumulation of snow and a much later snowmelt due to a shading effect from the surrounding mountains. An altitu-dinal delay of four days in the snowmelt is also seen in fi gure 3.2, where the 50 % snow cover fraction in 2009 is reached 16 and 20 days later in the regions of interest (200 and 250 m a.s.l.).
Snow cover
Due to logistical problems, snow cover depths and snow densities in the Kobbe-fjord drainage basin were only surveyed on 15 and 16 April 2009 using a combi-nation of ground penetrating radar and manual stake measurements.
In order to compensate for the lack in temporal monitoring the spatial monito-ring was extended to three new transects. The three new transects were established close to the three soil monitoring stations, SoilFen, SoilEmpSa and Soil Emp. In order to achieve a precise geographical reference of the GPR measurements, the transects were established using a Leica SR530 RTK GPS which received corrections from a GPS base placed on the reference point KOBBEFJORDFIX. This yielded a horizon-tal precision of a few centimetres for the section nodes. Each of the three transects had four line sections as displayed in fi g-ure 3.4 and the section nodes were labelled 1-5. The four line sections (1-2, 1-3, 1-4 and 1-5) were measured both with the GPR with a spatial resolution of 20 cm and with manual stake measurements for every 10 m. Close to Position 1 at each of the three sites, a snow pit was dug to investigate density, texture and temperature. Figure 3.1 Reinstallation
of snow camera K3 500 at 530 m a.s.l. (N64°7´21.27’’ W51°22’18.60’’). The old placing is seen to the right. The new camera has been raised approximately 2 m above the terrain to avoid snow formation in front of the camera. Photo: Karl Martin Iversen.
Site Snow pit depth
(cm)
Avg. density
(kg m–3)
Snow depth (min- avg. - max)
(cm) Standard dev. of snow depth (cm) Avg. snow temperature (°C)
Avg. water eq.
(mm)
Soil Fen 98.0 260 64 – 91 – 128 10 n.a. 237
Soil Empetrum 85.0 323 68 – 102 – 163 18 –1,7 329
Soil Empetrum Salix 65.0 306 37 – 90 – 150 21 –0,9 275
Table 3.1 Snow depths, densities, temperatures and water equivalents at the three soil stations (SoilFen, SoilEmp and SoilEmpSa) measured 15 and 16 April 2009.
Snow depths varied from 37 cm to 163 cm at maximum snow cover. Table 3.1 summarizes the depth and density results from the three snow pits. The SoilFen site had the lowest snow density with only 260 kg m-3 (STD = 10 cm) and a maximum snow depth of only 128 cm. SoilEmp had the deepest maximum snow depth (163 cm) and the highest snow density of 323 kg m-3 (STD=18 cm). The SoilEmpSa site had the smallest snow depth of only 37 cm (STD = 21 cm). This general pattern is mainly controlled by microclimate and small-scale topography variations resulting in very heteroge-neous snow cover conditions that chan-ges within a few metres.
Ice cover
The ice cover on the lakes within the drainage basin broke up in early to late June 2009, i. e. 11-13 days later than 2008 (table 3.2). The smaller lake ‘Langesø’ in the sheltered bottom of the main valley melted fi rst, followed by ‘Badesø’ two days later and the higher situated ‘Qassi-sø’ a week later. The dates reported are visually estimated dates for 50 % ice cover based on photos from the auto-matic cameras. Dates for the perennial formation of ice are also estimated. Sea ice cover in Kobbefjord developed later but timing was diffi cult to estimate in 2008 due to ice on the camera lenses. No sea ice was observed during the last visit
N
0 1 km
Water Stream Snow and ice Coastline GeoBasis stations Elevation
0–1313
Figure 3.2 Location of GeoBasis stations in Kob-befjord. The base map is created from new ele-vation and feature data.
0 0.2 0.4 0.6 0.8 1.0 60 90 120 150 180 210 DOY 300 (2008) 300 (2009) 200 (2009) 250 (2009) 300 200 200 250 250 200 250 Cover fraction
Figure 3.3 Snow cover depletion for three re-gions of interest (at ap-proximately 200, 250 and 300 m a.s.l.) have been analysed using a new snow cover algorithm. The regions are specifi ed on the image to the left, and the depletion curves for each region are shown in the diagram to the right. DOY (day of year).
to Kobbefjord 17 November 2008, but reports from visitors in the area stated sea ice 100 metres from the shore-line at the bottom of the fjord 4 December. A 3000-meter wide and 30 cm thick sea ice cover was reported 20 January and again 12 February 2009. The fjord was ice-free again 4 June 2009.
Micrometeorology
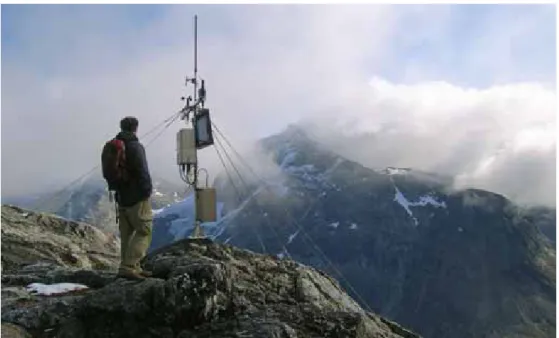
GeoBasis operates three micrometeorolo-gical stations in the area i.e. SoilFen at 40 m a.s.l., M500 at approximately 550 m a.s.l. and M1000 at 1000 m a.s.l. The fi rst two were installed in August 2007 (Tamstorf et al. 2008), while M1000 was installed 4 September 2008. The new station is identi-cal to M500 and includes air temperature, relative humidity, incoming short wave radiation and surface temperature. Unfor-tunately, the mast and several sensors on M1000 were damaged in a severe storm in January 2009. On 15 October 2009, a new installation replaced the existing M1000 at 1000 m a.s.l. (fi gure 3.5). The new station
was installed in collaboration with Clima-teBasis, and the station serves as both a microclimate station and a data communi-cation link to Nuuk.
The purpose of the three stations is to monitor dynamics within the atmos-pheric boundary layer (as for example temperature inversions). Table 3.3 shows temperature gradients and frequency of inversion in the fi rst year with tempera-ture measurements at both SoilFen and M500. The normal temperature lapse rate with decreasing temperatures with alti-tude prevalls in 84 % of the time on an an-nual basis. Inversion prevalled up to 33 % of the time in March due to shadows from the surrounding mountains, and due to snow cover leading to radiative cooling in the valley fl oor. The spring period before snow melt also has the longest occurrence of inversions with 33 hours as a maximum in March. The autumn has the lowest oc-currence of inversions with only 1 % in September and with a maximum of only three hours. B2 B3 B1 B5 B4 C4 C5 A5 A4 A3 A2 A1 C1 C2 C3 0 0.5 km N SOILEMPSA SOILEMP SOILFEN EDDYTOWER KOBBEFJORDFIX N 2 4 1 5 3 Soil station 50 m Snowpit
Figure 3.4 Map showing the three snow survey sites. The fi gure, on the right, outlines the strategy at each site.
Table 3.2 Visually estimated dates for 50 % ice cover on selected lakes within the Kobbefjord drainage basin and in Kobbefjord. Dates are reported for perennial formation of ice cover in the autumn and for the break-up of ice cover in spring. ´Badesø´ is the main lake in the area. ´Langesø´ is the long lake in the valley behind ´Badesø´. ´Qassi-sø´ is the lake at 250 m a.s.l. in the northern valley of the drainage basin. *Due to low cloud cover and ice formation on the cameras, it has not been possible to estimate the ice formation on Kobbefjord in 2008.
2007 2008 2008 2009
Fall Spring Fall Spring
Badesø 23 Oct 2 Jun 5 Nov 13 June
Langesø 22 Oct 31 May 5 Nov 11 June
Qassi-sø 22 Oct 9 June 4 Nov 22 June
3.2 Soil
Soil water chemistry is likely to be affected by physical and chemical changes in the environment and to have important effects on the ecosystem processes. In order to monitor such changes in the environment, the chemical composition of precipitation and soil water is monitored. By such analy-ses plant nutrient status and ongoing soil forming processes are followed. In addi-tion, physical dynamics are monitored by continuous measurements of variables like soil water content and soil temperature.
Physical soil properties
The continuous monitoring of soil physical properties at the three different locations SoilEmp, SoilEmpSa and SoilFen has now continued for more than a full year. The sta-tions have been continuously maintained to assure data quality, see procedures in Iversen et al. 2010.
The results of selected parameters are summarized in tables 3.6, 3.7, and 3.8. Already the monitoring has documented important differences between all three soil stations. For example, the winter soil tem-peratures at the SoilFen site are higher than
Figure 3.5 A new micro-meteorological station (M1000) was installed at 1000 m a.s.l. in October 2009. Photo: Karl Martin Iversen.
Table 3.3 Monthly air temperature gradients between SoilFen station (40 m a.s.l.) and M500 (550 m a.s.l.). Frequen-cy and duration of inversions are shown in % and hours, respectively.
Month-year Decreasing lapse rate with altitude
Increasing lapse rate with altitude Mean lapse rate Longest period with inversion (°C per 100 m) (% of time) (°C per 100 m) (% of time) (hours) 2008 August –0.71 90 0.30 9 –0.61 16 September –0.79 99 0.15 1 –0.78 3 October –0.70 92 0.32 8 –0.62 20 November –0.71 92 0.31 8 –0.62 7 December –0.65 87 0.27 12 –0.54 7 2009 January –0.61 80 0.31 19 –0.43 17 February –0.54 79 0.35 19 –0.36 20 March –0.59 67 0.56 33 –0.21 33 April –0.65 77 0.63 22 –0.36 21 May –0.68 87 0.33 13 –0.55 9 June –0.73 85 0.46 15 –0.55 15 July –0.62 69 0.50 30 –0.28 15 Annual –0.66 84 0.38 16 –0.49 15
at both the SoilEmp and SoilEmpSa sites. The soil stations have also documented inter-annual variations – among them the likely effect of less snow cover in the last quarter of 2009. In this period soil tempera-tures in the upper 30 cm averaged –1.0 °C at the SoilEmp site compared to 0.3 °C in 2008. The same comparison with the air temperature reveals that the last quarter of 2009 was 0.5 °C colder than in 2008. In addition, the progression of soil water content has been recorded to be different among the soil stations. The Empetrum do-minated site is well drained and retained less moisture than the Empetrum-Salix do-minated site. In 2009 only 6 mm precipita-tion was recorded in July and August, and the Empetrum dominated site quickly dried out. However, at the Empetrum-Salix domi-nated site, the soil water content was gene-rally higher and retained for a longer period. Soil water
In 2009, thirty soil water samples were col-lected from two depths at the SoilFen site and at the SoilEmp site. The results from the
analysis of the physical chemistry in the soil water are not yet ready. The small laborato-ry in Kobbefjord will make analyses of soil water pH and alkalinity easier, and in 2010, GeoBasis will accordingly try to streamline the procedures used for soil water chemistry. River water
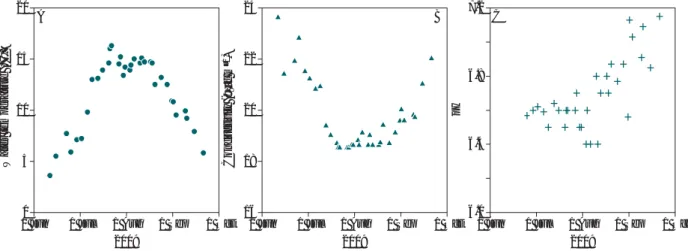
In 2009, 45 river water samples were col-lected at the water sampling point (fi gure 3.2), with the purpose of analyzing for mer-cury (Hg) content. Results from these ana-lyses are reported separately in section 6.8. Simultaneous with the sampling, GeoBasis also measures river water temperature, conductivity and pH. These parameters are presented in fi gure 3.6. The river water has an average conductivity of 19.8 µS cm-1 and there is a tendency towards a lower pH in the snow melt period, although all pH va-lues are close to neutral.
Digital Elevation Model
In December 2009, Asiaq – Greenland Sur-vey received a new and precise digital ele-vation model (DEM) with a spatial resolu-Table 3.4 Air temperature, relative humidity, surface temperature and short wave irradiance measured at the M500 station from October 2008 to August 2009. (The data from September to December 2009 are not yet retrieved).
Table 3.5 Air temperature, relative humidity, surface temperature and short wave irradiance measured at the M1000 station from October 2009 to December 2009.
Month–year Air temp.
2.5 m
Rel. hum. 2.5 m
Surface irradiance temp. 0 m Shortwave irrradiance 2.5 m (°C) (%) (°C) (W m–2) 2008 October –3.2 77.6 –6.2 38.0 November –5.0 91.5 –6.2 8.5 December –10.8 82.2 –13.0 3.3 2009 January –7.7 72.0 –11.5 6.9 February –8.1 69.7 –11.8 30.1 March –13.1 76.5 –16.1 95.1 April –5.3 83.9 –7.6 166.9 May –2.5 79.9 –3.1 254.2 June 3.4 83.2 5.5 220.7 July 8.8 67.8 11.0 287.7 August 7.3 77.4 8.4 194.2 Month 2009 Air temp. 2.5 m Rel. hum. 2.5 m
Surface irradiance temp. 0 m Shortwave irrradiance 2.5 m (°C) (%) (°C) (W m–2) October –6.2 90.1 –6.8 25.5 November –10.4 67.4 –13.2 15.8 December –5.2 55.4 –10.2 4.5
Table 3.6 Air temperature, relative humidity, surface temperature and soil temperatures at four depths measured at SoilFen from October 2008 to December 2009.
Month-year Air temp. 2.5 m Rel. hum. 2.5 m Surface temp. 0 m Soil temp. –1 cm Soil temp. –10 cm Soil temp. –30 cm Soil temp. –50 cm Soil temp. –75 cm (°C) (%) (°C) (°C) (°C) (°C) (°C) (°C) 2008 October –0.1 69.3 –2.4 0.1 0.9 2.6 2.9 3.5 November –1.9 79.8 –4.4 –0.1 0.2 1.3 1.6 2.1 December –8.1 71.8 –11.9 –0.2 0.1 1.0 1.2 1.6 2009 January –5.5 67.6 –10.1 –0.2 0.1 0.9 1.1 1.4 February –6.2 69.3 –10.7 –0.3 0.0 0.7 0.9 1.2 March –12.0 73.7 –16.8 –0.5 –0.1 0.6 0.7 1.1 April –3.4 78.8 –6.7 –0.2 –0.1 0.5 0.7 1.0 May 0.3 71.7 –3.3 0.0 0.0 0.5 0.7 1.0 June 6.3 76.6 7.2 7.0 4.7 2.6 2.3 2.0 July 10.2 72.1 13.1 14.3 12.7 8.7 7.8 6.3 August 8.7 77.2 10.1 10.8 10.6 9.1 8.6 7.7 September 3.5 73.9 2.9 3.9 4.7 5.8 5.9 5.9 October –0.7 69.2 –3.2 –0.2 0.5 2.2 2.5 3.1 November –8.1 74.2 –13.6 –0.3 0.0 1.1 1.4 1.9 December –2.9 61.0 –8.7 –0.6 –0.2 0.8 1.0 1.5
Month-year Soil temp. –1 cm Soil temp. –5 cm Soil temp. –10 cm Soil temp. –30 cm Soil moist. –5 cm Soil moist. –10 cm Soil moist. –30 cm Soil moist. –50 cm (°C) (°C) (°C) (°C) (%) (%) (%) (%) 2008 October 0.3 0.5 0.7 1.1 18 39 24 20 November 0.2 0.3 0.4 0.6 29 45 33 31 December –0.2 0.0 0.1 0.3 10 34 16 14 2009 January –0.9 –0.7 –0.5 –0.1 2 12 4 3 February –1.3 –1.1 –1.0 –0.5 1 9 2 2 March –2.5 –2.3 –2.2 –1.7 1 7 1 1 April –1.4 –1.4 –1.3 –1.1 1 8 1 1 May 0.0 0.0 0.0 0.0 14 21 15 14 June 7.5 7.0 6.7 5.6 32 45 40 41 July 12.4 11.8 11.5 10.4 9 35 14 12 August 10.3 10.1 10.0 9.5 3 17 4 3 September 4.0 4.4 4.6 5.0 6 26 6 5 October –0.5 –0.3 –0.1 0.4 12 25 17 15 November –1.5 –1.3 –1.1 –0.4 2 13 3 3 December –1.9 –1.8 –1.7 –1.2 1 10 2 2
tion of 10×10 m and with mapped features such as coast line, lakes, glaciers, rivers, and buildings (fi gure 3.2). Collaboration between Asiaq – Greenland Survey and GeoBasis has been established to check the quality of the data before distributing the DEM to interested users through http:// www.nuuk-basic.dk.
3.3 Vegetation
Vegetation in the Kobbefjord area is moni-tored by both the BioBasis and GeoBasis programmes. BioBasis monitors individu-al plants and plant phenology using plot
scale sites and transects. GeoBasis moni-tors the phenology of the vegetation com-munities by use of satellite images. Satellite imagery
Successful acquisition of satellite imagery requires cloud free conditions. In 2009, the conditions for a successful acquisition were met on 17 July, which happened to be the same date as the image acquired in 2008. Unfortunately, this is almost two weeks from the maximum of growth (see section 4.1) and the reasons for inter-annu-al differences between greenness are there-fore diffi cult to access although a compari-son will give an indication of inter-annual Month-year Soil temp.
–1 cm Soil temp. –5 cm Soil temp. –10 cm Soil temp. –30 cm Soil moist. –5 cm Soil moist. –10 cm Soil moist. –30 cm Soil moist. –50 cm (°C) (°C) (°C) (°C) (%) (%) (%) (%) 2008 October --- --- 1.4 1.6 60 55 49 51 November --- --- 0.7 0.8 61 55 49 51 December --- --- 0.3 0.5 58 48 48 50 2009 January --- --- –0.4 0.2 37 27 41 38 February --- --- –1.1 –0.3 15 13 33 32 March --- --- –1.5 –0.7 13 12 12 25 April --- --- –0.4 –0.2 15 13 13 14 May --- --- 0.1 0.0 30 21 17 16 June --- --- 4.1 3.5 59 52 38 35 July --- --- 11.0 9.5 51 42 45 45 August --- --- 10.3 9.1 40 30 38 33 September --- 5.3 5.0 5.5 --- 32 38 33 October 0.4 0.9 0.8 1.0 60 53 44 48 November –0.4 0.2 –0.1 0.3 52 37 41 42 December –0.7 –0.2 –0.4 –0.1 28 21 38 35
Table 3.8 Soil temperature and soil moisture at four depths measured at SoilEmpSa from October 2008 to December 2009.
20 15 10 5 0 24 22 20 18 16 7.2 6.8 6.4 6.0
1 Jun 1 Jul 1 Aug 1 Sep 1 Oct 1 Jun 1 Jul 1 Aug 1 Sep 1 Oct
1 Jun 1 Jul 1 Aug 1 Sep 1 Oct
2009 2009 2009 A B C pH Conductivity (µSc m –1 ) Water temperature (°C)
Figure 3.6 A) River water temperature, B) conduc-tivity and C) pH measured at the water sampling point by the main station (conductivity measure-ments are temperature compensated with a standard temperature co-effi cient of 2.1 % per °C).
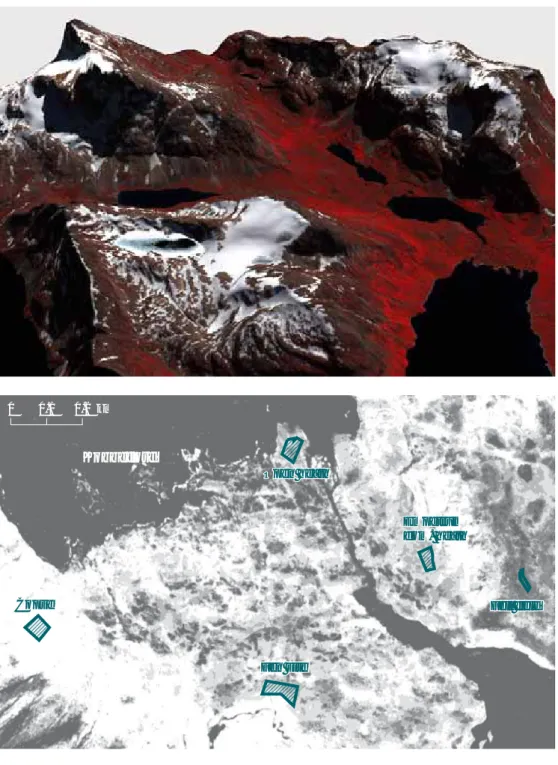
differences in greenness. A QuickBird mul-tispectral image with 2.4 m resolution was acquired and geo-rectifi cation carried out. Atmospheric correction was performed but without topographic correction as the preliminary version of the high resolution, digital elevation model was available only shortly before the deadline of this report. Figure 3.7 shows an example of the Quick-Bird imagery from 17 July 2009 draped on the preliminary DEM.
Normalised Difference Vegetation Index (NDVI) has been calculated from the ima-gery 17 July 2009. A subset of the central part of the monitoring area is shown in fi gure 3.8. The areas on the imagery
repre-sent fi ve different vegetation types from the area i.e. fell fi eld, open mixed heath;
Empetrum dominated heath, fen, and copse.
In future reports, the fully pre-processed imagery will be used for extracting NDVI values in these different regions at the time of peak greenness.
Figure 3.9 shows the difference in NDVI for the fi ve different vegetation types (Notice that images are not topo-graphically corrected and that date of acquisition is outside the maximum green-ness peak). Only the fell fi eld area has a tendency to lower NDVI in 2009 than in 2008. All the other types have a higher NDVI in 2009. Although direct compari-Kobbefjord Kobbefjord 0 0.1 0.2 km Fen site Fen site Copse Copse Empetrum Empetrum dom. heath dom. heath Open heath Open heath Fell field Fell field Fen site Fen site Copse Copse Empetrum Empetrum dom. heath dom. heath Open heath Open heath Fell field Fell field
Figure 3.7 QuickBird ima-gery from 17 July 2009 draped on the new digital elevation model. The false colour representation used here enhances the vegetation in red, bare surface in brown and snow in white colours.
Figure 3.8 Normalised Difference Vegetation Index (NDVI) from 17 July 2009 covering the central part of the Kobbefjord monitoring area and with boxes for the fi ve different vegetation types shown in fi gure 3.9. Data is at-mospherically corrected but lack the topographic correction.