Primary health care-based programmes
targeting potentially avoidable
hospitalisations in vulnerable groups with
chronic disease
Katrina Erny-Albrecht Jodie Oliver-Baxter Petra Bywood
Primary Health Care Research & Information Service (PHCRIS) May 2016
Primary health care-based programmes targeting potentially avoidable hospitalisations in vulnerable groups with chronic disease
© Primary Health Care Research and Information Service 2016 ISBN 978-0-9941874-7-5
May 2016 Expert Review
This report has been reviewed by Associate Professor Zahid Ansari (Manager, Health Intelligence Unit, System Intelligence and Analytics, Department of Health and Human Services, Victoria). Associate Professor Ansari has extensive experience and is well-published in the area of potentially avoidable hospitalisations.
Suggested citation
Erny-Albrecht K, Oliver-Baxter J, Bywood P. (2016). Primary health care-based programmes targeting potentially avoidable hospitalisations in vulnerable groups with chronic disease. PHCRIS Policy Issue Review. Adelaide: Primary Health Care Research & Information Service.
Table of contents
Figures ...ii Tables ...ii Acronyms ... iii Executive summary ... 1 Policy context ... 1 Key findings ... 1Trends in PAH and ED presentation rates ... 1
Overview of programmes to reduce PAHs and ED presentations ... 2
Policy considerations ... 3
Background ... 4
Terminology, definitions and indicators ... 4
Policy context ... 6
Aim ... 6
Methods ... 6
General caveats ... 7
Findings ... 8
Trends in PAH rates ... 8
Trends in ED presentation rates... 10
PAH risk factors ... 13
Overview of findings from systematic reviews ... 17
Patient-level predictors ... 17
Interventions to reduce PAH and ED presentations ... 17
Potentially avoidable hospitalisation (PAH) ... 17
Emergency Department (ED) presentation ... 18
Hospital readmission risk ... 19
Summary ... 20
Programmes to reduce PAHs and ED presentations ... 20
Indigenous people with chronic conditions ... 22
Background ... 22
Rate and trends ... 23
Programmes to reduce PAHs and ED presentations ... 25
NSW CDMP... 25
Fitzroy Valley ... 26
Rural and remote residents with chronic conditions ... 27
Background ... 27
Rate and trends ... 27
Programmes to reduce PAHs and ED presentations ... 28
HARP BCOP... 28
Tele-CDSMP... 29
Mental health emergency care – rural access programme (MHEC-RAP) ... 29
Socioeconomic disadvantaged people with chronic conditions ... 30
Background ... 30
Rate and trends ... 30
Inala Chronic Disease Management Service (ICDMS) ... 31
Southampton model ... 31
Other vulnerable groups ... 32
Elderly ... 32
HealthOne ... 34
Silver Chain Group ... 34
HARP BCOP... 35
Aged Care Emergency (ACE) ... 35
My Health Guardian (MHG) ... 35
Summary & Discussion ... 37
Conclusion ... 39
References ... 40
Appendices ... 49
Glossary ... 92
CASP checklist assessment for systematic reviews included in the current rapid review ... 93
Figures
Figure 1 Trends in PAHs for A: all causes and B: chronic conditions only ... 9Figure 2 Rates per 1 000 population for PAHs in different states and territories of Australia for the period 2013–2014 ... 10
Figure 3 Trends in total ED presentations ... 12
Figure 4 Approximate age related proportion of all triage 4 and 5 ED presentations in Victoria 2012–13. ... 12
Figure 5 Potentially avoidable hospitalisations for chronic conditions among the 45 and Up Study cohort between 2006 and 2011. ... 14
Figure 6 Top 10 PAHs, by Indigenous status, July 2011–June 2013. ... 23
Figure 7 PAHs, by Indigenous status and remoteness, July 2011–June 2013. ... 28
Figure 8 PAHs, by Indigenous status and age group, July 2011–June 2013 ... 33
Tables
Table 1 Selected outcomes of the prospective observational 45 and Up Study for factors influencing rates of PAH among people with chronic disease ... 15Table 2 Separations per 1 000 for PAH for chronic conditions, by Indigenous status 2012–14 ... 25
Table 3 Rates of PAH per 1 000 population for chronic conditions by remoteness area of residence 2011–14 ... 27
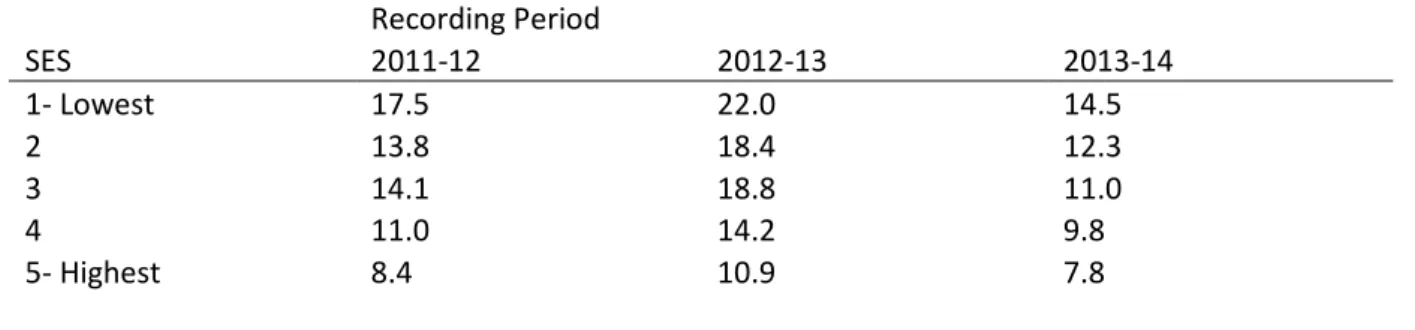
Table 4 Rates per 1 000 population for PAH for total chronic conditions by SES 2011–2014 ... 30
Table 5 Proportion of hospital separations for older Australians ... 33
Table 6 Patient-related variables identified in systematic reviews as influencing rates of PAH, ED presentation or hospital readmission ... 49
Table 7 Systematic reviews of interventions to reduce rates of PAH, ED presentation or hospital readmission ... 51
Table 8 Summary of programmes, target population, key features and evaluation findings ... 56
Acronyms
ABS Australian Bureau of Statistics
ACCHS Aboriginal Community Controlled Health Service ACSC Ambulatory Care Sensitive Condition
ACT Australian Capital Territory
AIHW Australian Institute of Health and Welfare CAD Coronary artery disease
CCSS Care Coordination & Supplementary Services CNC Clinical Nurse Consultant
APHID Assessing Preventable Hospitalisation InDicators CDMP Chronic Disease Management Programme
COAG LSOP Council of Australian Governments Long Stay Older Patients COPD Chronic Obstructive Pulmonary Disease
ED Emergency Department
ED presentation Emergency Department presentation/visit
GP General Practitioner
GPMP-TCA General Practitioner Management Plan with Team Care Arrangement GRACE Geriatric Rapid Acute Care Evaluation
HF Heart Failure
HACC Home and Community Care HARP Hospital Admission Risk Program
HARP BCOP Hospital Admission Risk Program – Better Care for Older People HIP Health Independence Program
HITH Hospital In The Home
ICDMS Inala Chronic Disease Management Service LHD Local Health District
LOS Length of Stay
LTFU Lost to Follow Up
MHEC-RAP Mental Health Emergency Care – Rural Access Programme
MHG My Health Guardian
NPHA National Health Performance Authority
NSW New South Wales
NT Northern Territory
NZ New Zealand
PAC Post-Acute Care
PAH Potentially Avoidable Hospitalisation PPH Potentially Preventable Hospitalisation PRA Priority Response Assessment
QLD Queensland
RACF Residential aged care facility RCT Randomised controlled trial RHP Restoring Health Programme
SA South Australia
SEIFA SocioEconomic Index for Area SES Socioeconomic status
TREAT Triage and Rapid Elderly Assessment Team
UK United Kingdom
US United States of America
Vic Victoria
Executive summary
This report reviews outcomes of intervention programmes targeting reductions in potentially avoidable hospitalisations (PAHs) and/or avoidable Emergency Department presentations (ED presentations) among people with chronic disease. The focus is on the role of primary health care and where possible programmes targeting specific vulnerable populations, namely Indigenous Australians, rural and remote residents and those at socioeconomic disadvantage. This report also aimed to examine trends in PAHs and ED presentations among people with chronic disease. This report examines PAH and ED presentations according to the following structure:
• Trends in PAH and ED presentation rates: describes the current trends and rates in Australia, including recent epidemiological surveys on associated risk factors
• Overview of findings from systematic reviews: examines high level systematic review evidence identifying risk factors and the evidence base for potential intervention strategies
• Programmes to reduce PAHs and ED presentations: examines the success or otherwise of ‘real world’ implemented programmes targeting vulnerable populations.
Policy context
Reductions in PAHs and ED presentations are important health care policy benchmarks and represent potential for improved health outcomes, efficiency and cost savings.
• PAH is a National Health care Agreement (NHA) performance indicator, relating to the outcome
Australians receive appropriate high quality and affordable primary and community health services. The proportion of total separations that were for PAHs is an NHA benchmark (AIHW, 2015a, p 89)
• Potentially avoidable GP-type presentations to emergency departments is an NHA indicator for the outcome area of Australians receive appropriate high quality and affordable primary and community health services
• In 2015, the Australian government announced formation of a Primary Health Care Advisory Group (PHCAG) to examine opportunities for the reform of primary health care in improving the management of people with complex and chronic disease (Australian Government Department of Health, 2015b). Eliminating waste and improving efficiency is part of the stated long-term strategy, and to this end achieving reductions in PAHs and ED presentations is likely to make a significant contribution.
Key findings
Trends in PAH and ED presentation rates
• In the general population, PAH rates are generally high, but stable for chronic and acute
conditions, whereas they have increased for vaccine-preventable conditions
• Compared with the general Australian population, PAHs are higher in vulnerable populations
(Aboriginal and Torres Strait Islander peoples, rural/remote residents, socioeconomic disadvantaged, elderly)
• ED presentations have steadily increased (beyond population growth), with the largest increases
occurring in those aged 0–4 years and 20–24 years (Victorian data). ED presentations are also high in those aged 60 and over. However, increases may be related to increases in absolute number of acute presentations rather than GP-like non-urgent presentations
• Chronic diseases account for more than half of all PAHs. Chronic obstructive pulmonary disease is
the most common chronic disease PAH in all states of Australia.
• Although chronic disease management programmes have been implemented Australia-wide,
• Lack of consistency in the definition and use of PAHs as an indicator of primary health care access may influence findings across studies; and may not adequately determine truly avoidable events, particularly among chronically ill elderly people.
Overview of programmes to reduce PAHs and ED presentations
Systematic reviews of randomised controlled trials (RCTs), comparative cohort studies and evaluations of programmes suggest:
• Key predictors of PAHs, ED presentations and hospital readmissions include: older age, low
socioeconomic status (SES), ethnicity, rurality, comorbidities, mental illness and substance use and relationship status (widowed/separated)
• Elements in successful programmes are largely context- and condition-specific as PAH rates vary
according to different chronic conditions and disease severity; therefore, flexibility in approaches is needed
• Primary health care-based interventions that showed significant reductions in the rates of PAH
and ED presentation included:
o continuity of GP care, but condition-dependent (reduced rates for asthma, but not for diabetes or coronary heart disease)
o increased GP supply, but this is likely to be more relevant in US and Canadian
settings. In other settings outcomes are generally inconsistent (with the exception of asthma or hypertension where increased GP supply is associated with reduced rates of PAH and ED presentation)
o GP management plan with team care arrangement (GPMP-TCA), particularly for patients with diabetes
o multidisciplinary teams are likely to be important for reducing PAHs/ED presentations
o for elderly patients, multidisciplinary teams with specialist gerontologist and integrated with social care needs reduced ED presentations
o comprehensive, flexible vertical and horizontal integration of primary health care with hospital and community-based services
o capacity to provide care in peoples’ homes, particularly for socioeconomically disadvantaged and the elderly
o care coordinators within a multidisciplinary team to liaise with GPs, hospital and home care services improve rates of PAH for all vulnerable populations
o strong governance structures and clear but flexible guidelines are a common element
• Hospital-based interventions showed reduced PAHs in heart failure patients (hospital
outpatient), but included intensive monitoring over a prolonged period
• For Aboriginal and Torres Strait Islander peoples, evidence is highly variable and
condition-specific:
o Remoteness is only one factor that influences rates of PAH and ED presentations, as many Indigenous peoples have multiple disadvantage, including more advanced illness, multimorbidity, low SES and poor health literacy
o Programmes that are culturally appropriate and involve integration with other health and social service sectors are more likely to reduce rates of PAH/ED presentation
• For rural and remote-dwelling people, problems related to access and social isolation (and
multiple disadvantage) may impact on rates of PAH. Successful programmes include:
o Flexible design and implementation (e.g., on-line, telehealth services), such as HARP-BCOP and MHEC-RAP
• For low SES, cost of accessing health care, multimorbidity and low health literacy are key barriers. Factors that influence rates of PAH include:
o Flexible, individualised approach o Use of nurse coordinator
o Integration across primary health care, acute and community care (e.g., HARP-RHP, Southampton model)
• Programmes demonstrating a significant impact on rates of PAH and ED presentation across vulnerable populations include HARP, Inala-ICDM, Silver Chain Group, ACE, My Health Guardian
• Fitzroy Valley Partnership is a promising programme initiative awaiting robust evaluation.
Policy considerations
Evidence from the literature suggests that the following factors may be important to consider in developing policies related to reducing PAHs, ED presentations and hospital readmissions:
• Better validated indicators are needed. Use of PAHs as an indicator of primary health care access and health system performance may not be very reliable; and PAHs data for vulnerable groups is often lacking. Findings from an alternative indicator (APHID) are awaited
• The impact of advanced patient age on the potential of primary health care to reduce PAHs should be taken into consideration. For example, NZ does not include those aged over 75 in PAH rates
• Robust evaluation data on programmes to reduce PAHs in vulnerable populations is lacking; there is a need to incorporate routine evaluation into programme implementation
• Robust and detailed time-series data on rates of chronic PAH are lacking; this limits capacity to investigate the impact of local and national policy and programme initiatives
• All vulnerable groups would benefit from well-integrated care, involving multidisciplinary teams that include: primary health care, relevant specialists, care coordinator, and links to home care services and relevant social care needs, where required
• Culturally appropriate services for Indigenous Australians are essential, including mainstream services
• A targeted approach that is ‘fit for purpose’ may be needed to ensure that programmes reach those who are most in need (often also the costliest proportion of the population). For some programmes that failed to reduce PAHs and ED presentations, many patients were not frequent users of EDs or their disease was in an advanced stage and hospital care was unavoidable. Given the differences in rates of PAH across jurisdictions and between chronic conditions, dedicated condition-specific programmes, with flexibility to tailor to patient’s needs, geographical location and circumstances may be required.
Some but not all evaluated chronic disease management programmes have demonstrated statistically significant reductions in PAH and ED presentation rates; despite increasing rates of chronic disease in the population, the rates of PAH have remained relatively stable, which may reflect the contribution of more successful programmes.
Background
The care and management of people with chronic disease has been a central focus of Australian health reform over the past two to three decades (George Institute for Global Health et al., 2014). While mortality rates for chronic diseases have generally decreased in Australia, chronic diseases account for approximately 85 per cent of the total burden of disease (AIHW, 2014b) and 48 per cent of potentially avoidable hospitalisations (PAHs) in Australian hospitals for the period 2013-14 (AIHW, 2015a). Achieving reductions in chronic disease-associated PAHs and avoidable Emergency
Department presentations (ED presentations) is likely to produce cost savings and reduce the practical burden imposed on hospital services.
In 2013–14, approximately 22 per cent of the chronic disease PAH burden was attributed to chronic obstructive pulmonary disease (COPD), and 14 per cent to diabetes (AIHW, 2015a). Overall rates for chronic disease-related PAHs are greatest among people identifying as Aboriginal and Torres Strait Islander and people living in the lowest socioeconomic areas (AIHW, 2015a). Smoking, which is one of the key social determinants of health (AIHW, 2015b), is a major risk factor for COPD and the proportions of smokers or former smokers among Indigenous people and those from lower SES are as high as 40–50 per cent of the population (Winstanley and White, 2012). Although exact figures are lacking, the prevalence of chronic disease in Australia is thought to be very high, with current
estimates of 50–80 per cent of all Australian adults having at least one chronic condition (Taylor et al., 2010, Knox et al., 2008, AIHW, 2014b). In addition, while chronic conditions are commonly associated with older age groups, the proportions are also high in those aged under 60 years.
Terminology, definitions and indicators
PAHs are also referred to in the literature as ambulatory care sensitive conditions (ACSC) or potentially preventable hospitalisations (PPHs). These terms refer to hospitalisations that may (potentially) have been avoided by the provision of timely and effective non-hospital or primary health care, including preventive care (NHPA, 2015). For consistency, the term PAHs will be used in this report.
There are three broad categories of PAHs described in the Victorian Ambulatory Care Sensitive Conditions (ACSC) Study1 (Victorian Government Department of Human Services, 2004): • Vaccine-preventable. These diseases can be prevented by proper vaccination and include
influenza, bacterial pneumonia, tetanus, measles, mumps, rubella, pertussis and polio. The conditions are considered to be preventable, rather than the hospitalisation.
• Acute. These conditions may not be preventable, but theoretically would not result in
hospitalisation if adequate and timely care (usually non-hospital) was received. These include complicated appendicitis; dehydration/gastroenteritis; pyelonephritis; perforated ulcer; cellulitis; pelvic inflammatory disease; ear, nose and throat infections; and dental conditions.
• Chronic. These conditions may be preventable through behaviour modification and lifestyle change, but they can also be managed effectively through timely care (usually non-hospital) to prevent deterioration and avoid hospitalisation. These conditions include diabetes complications, asthma, angina, hypertension, congestive heart failure (HF) and chronic obstructive pulmonary disease (COPD) (AIHW, 2015a, p 89)2.
1 Based on classifications by Billings et al. (1993).
2 The current list of ICD-10-AM chronic conditions included in the Australian National Health Care Agreement to define PAHs has been
expanded beyond the above list to include bronchiectasis, iron deficiency anaemia, nutritional deficiencies and rheumatic heart disease (AIHW, 2015e).
Although vaccine-preventable and acute PAHs contribute to just over half of PAHs, the rapidly increasing prevalence of chronic diseases and population ageing have prompted formulation of a number of policies and initiatives to target chronic disease-associated PAHs.
Determining which hospitalisation events are preventable is not clear cut. The definition of PAH, and in particular the list of conditions included as ACSC, is not without debate and it has been highlighted that the list of ACSCs originally used to identify PAHs was reached by consensus more than two decades ago but has not been verified to date (Solberg, 2015). In addition, the list of specific conditions included in measures of PAH are known to vary and this influences the estimated rates and general relevance of programmes aimed at reducing PAHs (Bourret et al., 2015). The validity and value of PAH as a measure of health system performance is uncertain but is currently being
investigated in the Australian setting by the Assessing Preventable Hospitalisation InDicators (APHID) study (Jorm et al., 2012). Further, not all chronic disease-associated hospitalisations will be avoidable as the natural progression of some chronic conditions may result in planned (or unplanned)
hospitalisation events; and increasing levels of multimorbidity may also contribute to more hospitalisations.(Manski-Nankervis et al., 2014) The Australian National Health Performance Authority (NHPA) notes in reports of PAHs across Australia that “it is important to recognise that a potentially avoidable hospitalisation may have become unavoidable by the time a patient was admitted.”(NHPA, 2013, pV).Therefore, a broad-based definition of PAH may overestimate the number of actual hospitalisation events that could have been managed through timely non-hospital care.
Potentially avoidable GP-type ED presentations for chronic disease and resulting in hospitalisation is another NHA indicator for the outcome area of Australians receive appropriate high quality and affordable primary and community health service (AIHW, 2014b). In 2012–13, an estimated
2.2 million ED presentations fulfilled the three 3 interim criteria for potentially avoidable GP-type ED
presentations (AIHW, 2014b). Although the proportion of GP-like presentations specifically due to chronic conditions was not reported, as stated above almost 50 per cent of PAHs are for chronic conditions. However, the GP-type ED presentation indicator is problematic and in the 2013–14 Australian hospital statistics report for ED care, potentially avoidable GP-like ED presentations were not reported because the previously applied specifications were deemed as not fit for purpose and this outcome measure awaits improvement in the future (AIHW, 2014e). The term, GP-like ED presentations is used only where it is reported in the literature.
In a previous PHCRIS report, the concept of PAHs as an indicator for primary health care accessibility and effectiveness was examined (Katterl et al., 2012). Evidence showed a relationship between poor access to primary health care and higher rates of PAH; and factors having the strongest effect on PAH rates were age, SES, Indigenous status, rurality and comorbidity (see Table 4 in Katterl et al., 2012). In addition to providing extensive discussion on the concept of PAHs and its role as an indicator for primary health care effectiveness, Katterl et al. (2012) compiled a list of programmes aimed at reducing PAH rates for three of the most common ACSC conditions: diabetes complications, COPD and dental problems (see Katterl et al.’s report for more information). For some of the programmes, evaluation data were not available at that time, and currently there is no overview of which
programmes reduced PAHs and ED presentations in people with chronic disease, or which aspects of those programmes facilitate success or lead to failure.
3 Interim criteria for GP-type presentations: allocated a triage category of semi-urgent (ATS4) or non-urgent (ATS5), and did not arrive by
ambulance or by police or correctional vehicle, and at the end of the presentation, was not admitted to the hospital was not referred to another hospital, and did not die (AIHW, 2014b).
Policy context
Chronic disease imposes a burden not only on individuals, but also on the health system and the Australian economy, and is an important driver of health system utilisation and costs (Willcox, 2014). PAHs contribute to this burden and, based on the potential for non-hospital care or primary health care to prevent these events, they are a National Health care Agreement (NHA) performance indicator, relating to the outcome Australians receive appropriate high quality and affordable primary and community health services. The NHA uses the proportion of total separations that were for PAHs as a benchmark (AIHW, 2015a); and the PAH performance target for 2014–15 is 8.5 per cent of total hospital admissions (AIHW, 2015d). In 2013-14, the AIHW reported that 6.2 per cent of all hospital separations, 8.1 per cent of public hospital separations and 3.4 per cent of private hospital separations were PAHs, but it is relevant to note that 78 per cent of all PAHs were reported from public hospitals (AIHW, 2015a).
Targeting chronic disease management through non-hospital care and primary health care is thought to have the greatest potential for reducing PAHs and the associated cost. Nine of the 21 conditions included to assess PAH are chronic conditions (AIHW, 2015e), and in 2013–14, people with chronic disease accounted for approximately 48 per cent of separations for PAHs (AIHW, 2015a).
In 2015, the Australian government tasked a Primary Health Care Advisory Group (PHCAG) with examining opportunities for the reform of primary health care to improve the management of people with complex and chronic disease (Australian Government Department of Health, 2015b). Eliminating waste and improving efficiency is part of the stated long-term strategy, and to this end achieving reductions in PAHs and ED presentations is likely to make a significant contribution.
Aim
The aim of this research was to review outcomes of intervention programmes targeting reductions in PAHs and/or avoidable ED presentations among people with chronic disease. The focus was on the role of primary health care and where possible programmes targeting the following vulnerable populations:
• People living in socioeconomic disadvantage
• Rural and remote residents
• People identifying as Aboriginal and Torres Strait Islander peoples.
This report also aimed to examine trends in PAHs and ED presentations among people with chronic disease.
Methods
This report follows a ‘rapid review’ format. Rapid reviews are short literature reviews that focus on research evidence with a view to facilitating evidence-based policy development (Grant and Booth, 2009). Due to the limited timeframe for this review (eight weeks), searches and critical appraisal of the literature were pragmatic rather than systematic. The primary area of interest was programmes targeting PAHs or ED presentations among people with chronic disease, and identifying with one or more4 of the following vulnerable populations: those at socioeconomic disadvantage, rural and
remote residents, and those identifying as Indigenous Australians.
Although not explicitly searched for, where information relating to other vulnerable groups was identified (e.g., for the elderly, and those with mental health issues), this was also included if relevant. Similarly, programmes targeting hospital readmission were not explicitly searched for, but articles relating to this topic were included if considered relevant.
A thorough review of Australian and international literature was undertaken to search academic and grey literature sources including, but not restricted to: PubMed, Trove, Google Scholar, Scopus, PHCRIS primary health care search filter, and publicly accessible websites of relevant organisations including Australian Institute of Health and Welfare, Healthinfonet and individual chronic disease programmes. Keyword terms applied in the searches included combinations of chronic disease ‘AND’ one or more of the following terms: avoidable hosp*; preventable hosp*; socioeconomic
disadvantage; low income; emergency admission; emergency service; emergency hospital*; rural health; rural health service; Indigenous. Searches were restricted to English language, publication period 2009–September 20155, and the following settings: Australia, the United Kingdom (UK),
Canada, and New Zealand (NZ) as these countries have similarities to Australia in their health care systems. Relevant systematic reviews identified in the searches were appraised for quality using the Critical Appraisal Skills Programme checklists as recommended by the National Institute for health and Care Excellence (CASP UK, 2013, NICE, 2014) (See checklist for CASP in Appendix).
The list of chronic diseases used to identify PAHs aligned with the Australian Government National Healthcare Agreement (2015): asthma, congestive cardiac failure, diabetes complications, COPD, bronchiectasis, angina, iron deficiency anaemia, hypertension, rheumatic heart disease (AIHW, 2015e). To assess progress being made towards addressing PAH and ED presentation rates in the ‘real world’, literature searches were conducted to identify systematic reviews (high level evidence) and to identify updates of programmes highlighted in the previous PHCRIS report on this subject for those with chronic diseases. Where relevant, newer programmes reporting outcomes data were also included. Only programmes reporting outcome data were included.
General caveats
Ongoing debate pertaining to the definition of PAH, including which conditions are included and circumstances around hospitalisation, is beyond the scope of this report; but it is important to note that different definitions may influence the statistical analyses and reported findings in the literature. The ACSC categorisation of chronic conditions was originally proposed by Billings et al. (1993), and since then has been widely applied in studies of PAHs (Rosano et al., 2013). However, variation in the list of included conditions can lead to significant differences in estimated rates of PAH depending on the population being studied (Bourret et al., 2015). This review has adopted the NHA selected list of chronic conditions used to identify PAHs (AIHW, 2015e).
Findings
This report examines chronic disease-related PAHs and ED presentations according to the following structure:
• Trends in PAH and ED presentation rates: describes the current trends and rates in Australia, including recent epidemiological surveys on associated risk factors
• Overview of findings from systematic reviews: examines high level systematic review evidence identifying risk factors and the evidence base for potential intervention strategies
• Programmes to reduce PAHs and ED presentations: examines the success or otherwise of ‘real world’ implemented programmes targeting vulnerable populations.
Trends in PAH rates
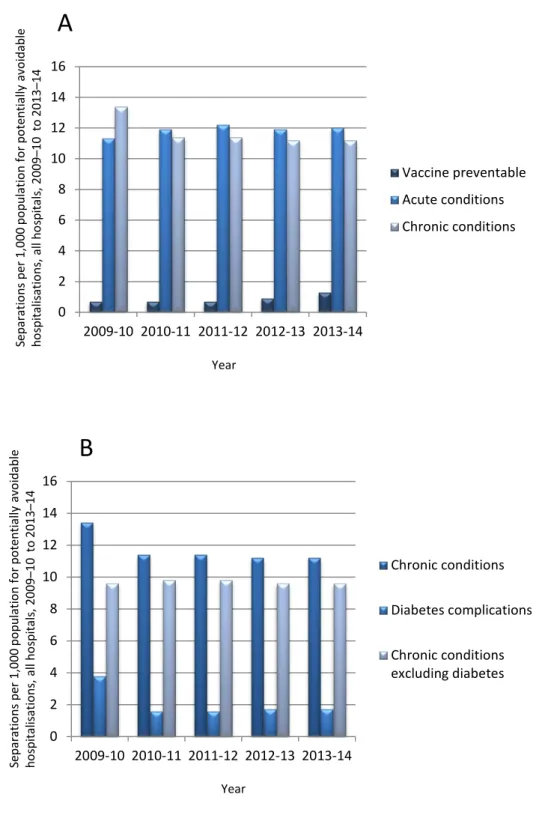
Despite the fact that all Australian states and territories have supported initiatives and policies that focus on reducing PAHs (Katterl et al., 2012, CEHSU, 2009), the overall rates of PAH in Australia have remained high, but relatively stable over the past five years, with very little change between 2009–10 and 2013–14, apart from a 41 per cent increase in vaccine-preventable PAHs (Figure 1) (AIHW, 2015a). Between the states and territories of Australia there was very little variation in rates of PAH for chronic conditions with the exception of very high rates in the NT (Figure 2). COPD was the most common chronic condition PAH in all states and territories of Australia for 2013–14. PAH rates for individual chronic conditions varied markedly between states. For example, iron deficiency and anaemia accounted for 20 per cent of chronic condition PAH separations in Victoria and Tasmania, but only seven and 11 per cent in the NT and QLD respectively. Similarly, rheumatic heart disease accounted for seven per cent of chronic PAHs in the Northern Territory but approximately one per cent in NSW, QLD and WA. The relationship, if any, of these differences to specific factors such as Indigenous status, age, SES or rurality has not been reported. However, caution should be taken when interpreting these differences, because although certain chronic conditions are known to be highly prevalent within some vulnerable populations, the proportion of PAHs attributed to specific conditions will also be influenced by factors such as the overall burden of other conditions and completeness of reporting. For example, anaemia is often associated with diabetes and people presenting with both conditions may be listed as having one or both of the conditions, and this would affect reported relative proportions for the individual conditions.
Chronic condition PAH rates including diabetes indicate a decrease in the years 2009 to 2011 (Figure 1), but this largely reflects changes in coding practices rather than any real change in specific event rates (AIHW, 2014c). These changes in reporting from year to year mean that any time series data should be viewed with caution.
Overall, data on vulnerable populations demonstrate higher rates of PAH compared with the general population. For Indigenous people, PAH rates continue to be much higher compared with non-Indigenous people. Similarly, data indicate that geographical and socioeconomic gradients in PAH exist, with higher rates in rural and remote areas and low SES areas (compared with
city/metropolitan and high SES areas, respectively). However, more detailed information has also revealed wide variation within these categories (Harrold et al., 2014). Trends in chronic disease-associated PAH rates are presented in more detail in the section on specific programmes (from page 20) for the following specific populations - those at socioeconomic disadvantage, rural and remote residents, those identifying as Indigenous Australians, and the elderly.
Figure 1 Trends in PAHs for A: all causes and B: chronic conditions only Source: based on data from (AIHW, 2015a)
Sepa ra tio ns per 1 ,0 00 po pul at io n fo r po tent ia lly a vo ida bl e ho sp ita lis at io ns , a ll h os pi ta ls, 2009 –10 to 2013 –14 Year 0 2 4 6 8 10 12 14 16 2009-10 2010-11 2011-12 2012-13 2013-14 Vaccine preventable Acute conditions Chronic conditions
A
B
0 2 4 6 8 10 12 14 16 2009-10 2010-11 2011-12 2012-13 2013-14 Chronic conditions Diabetes complications Chronic conditions excluding diabetes Sepa ra tio ns per 1 ,0 00 po pul at io n fo r po tent ia lly a vo ida bl e ho sp ita lis at io ns , a ll h os pi ta ls, 2009 –10 to 2013 –14 YearFigure 2 Rates per 1 000 population for PAHs in different states and territories of Australia for the period 2013–2014
Source: based on data from (AIHW, 2014e)
Finally, a NZ report of high relevance to the Australian setting has retrospectively analysed data for a nine-year period following substantial funding increases to primary health care aimed at improving access (Milne et al., 2015). Although access and use of primary health care improved in NZ, changes in PAH rates were inconsistent and for most age groups did not show long-term reductions in PAH or expected relationships to increased funding. It is also worth noting that the NZ Ministry of Health’s definition of ambulatory sensitive hospitalisations (equivalent to PAH) only applies to patients aged 74 years or less due to the likelihood of comorbidities in older patients (Milne et al., 2015).
Trends in ED presentation rates
ED presentations have steadily increased in absolute numbers across Australia between 2009 and 2014 (Figure 3). This increase is above and beyond population growth (Freed et al., 2015b), and is likely to impact on the provision of hospital services. It is widely speculated that elderly people with chronic disease use ED services for GP-type consultations (Freed et al., 2015b). Currently, there is no accepted measure for GP-type ED presentations, although prior to 2013–14 an interim measure6
based on Australian Triage Scale (ATS) level 4 and 5 presentations was used by AIHW (AIHW, 2014b). ATS levels 4 and 5 are equivalent to semi-urgent and non-urgent respectively (see Glossary). Based on this measure, it was estimated that approximately 39 per cent of public hospital ED presentations were GP-type presentations in 2010–11 and 2011–12 (AIHW, 2011b, AIHW, 2012).
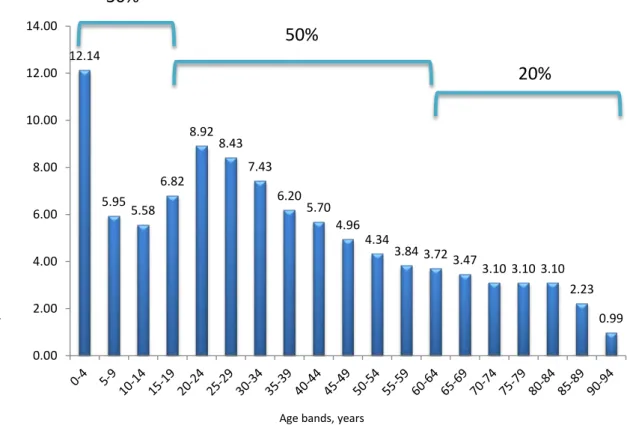
Although the very young and the oldest age groups record the highest per population rates of ATS4-5 in an analysis of ED presentations in Victoria (2002–12), Freed et al. (2015) showed that, at least for that state, the greatest increases in absolute number of ED presentations involved younger age
6 Interim measure for GP-type ED presentations: was allocated a triage category of 4 or 5, and did not arrive by ambulance or police or
correctional vehicle, and was not admitted to the hospital, was not referred to another hospital, and did not die (did not have an episode end status of Admitted to this hospital, Non-admitted patient emergency department service episode completed - referred to another hospital for admission or Died in emergency department as a non-admitted patient).
Sepa ra tio ns per 1 ,0 00 po pul at io n fo r po tent ia lly a vo ida bl e ho sp ita lis at io ns , a ll h os pi ta ls, 2013 -2014 State 0 5 10 15 20 25
NSW Vic QLD WA SA Tas ACT NT
All Chronic conditions
Chronic conditions withoutDiabetes complications
bands and acute ATS1-3 level presentations. Specifically, increases in ATS1-3 by 89 per cent and 95 per cent were evident for age bands 0–4 and 20–24 years respectively, compared to an increase by 63 per cent for those aged 75–79 years (age band above 60 years with greatest increase) over the decade examined. The corresponding increases for ATS4-5 were more modest at 16, 32 and 27 per cent respectively. In terms of absolute number of ED presentations for ATS 1–3 the age band 0–4 record the greatest number followed by 20–30 years although numbers do not drop off strongly until after 80 years of age, while for ATS 4-5 the same two age bands predominate but with a sharp linear reduction beyond 20–24 years. When the absolute number of age-related triage 4 and 5 ED event data reported in Freed et al. (2015b) are presented as proportions of all such events, it is apparent that children account for approximately 30 per cent of presentations and people aged 60 years and over for 20 per cent of such presentations Figure 4. Freed et al.’s (2015b) data confirm and extend an earlier study for Victoria (Lowthian et al., 2012), where similarly the greatest absolute increase in ED presentations (between 1999 and 2009) was for ATS categories 2 and 3. These data suggest that elderly people with GP-type ED presentations are unlikely to be the main contributor to overall increases in ED presentations, at least in the state of Victoria. In the earlier study, elderly people aged 85 years or older were more likely to be triaged as ATS 1-3, and have longer length of stay (LOS) in ED, reflecting increased complexity and urgency of their conditions (Lowthian et al., 2012, Freed et al., 2015b). However, elderly people arriving by ambulance because they do not have alternative transportation options might be elevated to ATS1-3, despite having ATS4-5 presentations (Freed et al., 2015b). Even if they were triaged as ATS 4 or 5, such presentations would not be counted as GP-type using the interim measure. In summary, and acknowledging that available data for ED
presentation rates are for all causes and the detailed data from Freed et al. (2015b) is for the state of Victoria only, recent increases in ED presentations are likely to reflect increased presentation by the very young (age 0-4 years) and young adults (20-30 years) for all ATS categories. Elderly people aged 60 years and over have the highest per population rate for all ATS categories, but are more likely to present with ATS 1-3. However, the elderly also represent approximately 20 per cent of ATS4 and 5 ED presentations in terms of absolute number of events, with approximately half of this involving people aged 75 years or more. Children aged less than 19 years account for approximately 30 per cent of ATS 4 and 5 presentations.
Pertinent questions might be why the younger age groups are turning to ED, and whether this reflects barriers to accessing primary health care, and what proportion of events among the elderly are avoidable. To examine more closely those factors potentially contributing to the high rates of ED presentation in Victoria, Freed et al. (2015b) conducted a study of general practice access and found high level availability of same-day GP appointments with bulk-billing for low acuity conditions in children. These outcomes suggested that access and cost barriers are unlikely to be prime drivers of high rates of ATS 4 and 5 ED attendances for children in metropolitan Victoria (Freed et al., 2015a). From a primary health care perspective it would be important to know the nature of presenting conditions and whether timely intervention could have avoided the need for ED attendance. Although further investigation of this is beyond the scope of the current report, the reasons for ED attendances by children were indicated in a separate Victorian survey from 2014, where 66 per cent of ATS4-5 ED presentations for children aged <9 years were for illness (injury accounting for
remainder) and most did not make prior use of the HealthDirect telenursing triage service (Turbitt and Freed, 2015). Specific details on the illnesses involved were not available. However, in a similarly aged cohort, data from Western Australia a decade earlier indicated that approximately 64 per cent of ED presentations were related to acute lower respiratory infections or asthma (Moore et al., 2012).
Figure 3 Trends in total ED presentations
Source:(AIHW, 2014e). To generate a time series for Indigenous events individual annual reports of Australian
hospital statistics Emergency department care were used available from http://www.aihw.gov.au/hospitals-publications/. (Due to absence of reported data, for Indigenous 2010–11 a value at 5% of total ED
presentations is assumed based on previous and subsequent years data).
Figure 4 Approximate age related proportion of all triage 4 and 5 ED presentations in Victoria 2012–13.
Source: Based on data (from Figure 1 in Freed et al., 2015b)
N on -a dm itt ed e m er ge nc y d ep ar tm en t p re se nt at io ns, publ ic ho spi ta ls, 2 00 9– 10 t o 2013 –14 Year 0 1000000 2000000 3000000 4000000 5000000 6000000 7000000 8000000 2009-10 2010-11 2011-12 2012-13 2013-14 Total ED presentations Indigenous ED presentations 12.14 5.955.58 6.82 8.92 8.43 7.43 6.20 5.70 4.96 4.34 3.84 3.72 3.473.10 3.10 3.10 2.23 0.99 0.00 2.00 4.00 6.00 8.00 10.00 12.00 14.00 Appr ox im at e pr opo rt io n o f a ll t ria ge 4 and 5 E D pr es ent at io ns 2012/ 13
Age bands, years
30%
50%
In summary, overall rates of PAH are stable for acute and chronic conditions but increasing for vaccine preventable hospitalisations. Rates of chronic disease-related PAH have not changed substantially despite chronic disease management programmes implemented in most Australian states and territories. This raises questions about the proportions of chronic disease-related PAH events that are truly avoidable and why chronic disease management programmes are not having more impact on PAH rates. ED presentations have increased steadily since 2009, but due to data limitations it is not possible to determine the contribution of vulnerable populations with chronic disease to this trend or the proportion of GP-type presentations.
More detailed time-series investigation at the state and territory level together with an improved measure of GP-type presentations according to age bands (also Indigenous status, rurality, SES) would be helpful to better investigate this relationship. As noted above, it is also hoped that the Assessing Preventable Hospitalisation InDicators (APHID) study will provide more appropriate indicators for PAH that reflect truly avoidable hospitalisation events (Jorm et al., 2012). Similarly, alignment of PAH and ED presentation rates with national, state and local policy initiatives and intervention programmes as recently published for the Fitzroy Valley region of WA (Reeve et al., 2015) would be more informative in terms of evaluating the impact of these measures on PAH rates.
PAH risk factors
Rates of PAH were recently reported for the 45 andUp Study, a longitudinal study of healthy ageing aimed at answering important health and quality-of-life questions for a range of conditions such as cancer, heart disease, depression, obesity and diabetes. With an enrolled cohort of 267 091 people living in NSW this cross-sectional self-administered survey of people aged 45 and over has been shown to be representative of the relative risk estimates for the NSW population (Falster et al., 2015, Mealing et al., 2010). Sub-cohort analyses for the 45 and Up Study indicate that after adjustment for confounding factors a number of additional factors are related to increased risk for PAH but these may vary depending on the chronic condition and/or characteristics of the care provided in Table 1. For example, among study participants with chronic conditions, the rate of PAHs was generally related to Indigenous status, self-rated health, comorbidities, functional limitations, and age, but to a lesser extent or not at all to number of GPs per 10 000 residents, employment status, education level, body mass index, or psychological distress (Falster et al., 2015). However, for people with hypertension or asthma, fewer hospitalisations were reported as GP numbers increased (Falster et al., 2015). For people with diabetes, although GP management plan or team care arrangements with review were associated with lower rates of PAH, greater effects were noted for the involvement of certain allied health workers, the greatest impact being reported for involvement of a
physiotherapist or diabetes educator (Comino et al., 2015). In the 45 and Up Study, smoking was shown to significantly increase the risk of PAH among people with COPD, and to a lesser but still significant extent among those with diabetes, angina or congestive HF (Tran et al., 2015a). Similarly for this group of chronic conditions, increasing positive behaviours, specifically any of non-smoking, low-to-moderate alcohol consumption, sufficient physical activity, sufficient fruit and vegetables intake, health sitting time and health sleeping time, were also associated with lower rates of PAH (Tran et al., 2014)
In the most recent report of the 45 and Up Study, data from 266 930 participants (average age 63±11 years) were used to develop a predictive risk model for emergency hospitalisations with the final models including age, sex, annual average number of GP visits, number of comorbidities, prior admission and self-rated health (model 1) or functional limitation (model 2) (Lewis, 2015b). The final c-statistic was 0.733 for both models, and according to Kansagara et al. (2011), this represents
acceptable discrimination. For both models the risk for hospitalisation (hazards ratio) was
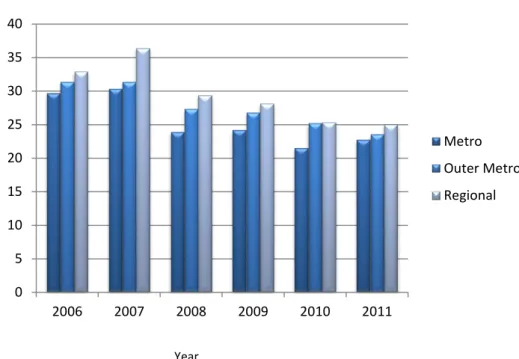
approximately two to four times greater for those aged 75 years or more compared to 45–54 year old study participants. For participants aged 55–74 the corresponding increased risk was lower at 1.2 and 1.6 times. Lewis (2015b) also provided details on annual age and sex standardised rates of chronic disease PAH for the 45 and Up Study cohort over the period 2006–2011 with stratification according to metro, outer metro and regional local health districts. These data included both private and public hospital admissions, and demonstrated reducing rates of chronic PAH in all three
geographical regions from 2007 onwards for this elderly cohort (see Figure 5 ). The significance of these changes was not addressed in the report, and it is not known whether data coding changes that impacted on state and national level data had any influence on the 45 and Up Study data. However, data for acute event PAHs demonstrated no change or small increases over the same period in the 45 and Up Study cohort (Lewis, 2015b).
Figure 5 Potentially avoidable hospitalisations for chronic conditions among the 45 and Up Study cohort between 2006 and 2011.
Source: Based on age and sex standardised data (Table 2b in Lewis, 2015b)
Ad m issi on s pe r 1 00 p er so n-yea rs fo llo w up fo r p ot en tia lly av oi da bl e ho spi ta lis at io ns fo r c hr oni c co ndi tio ns , a ll h os pi ta ls, 2006 -201 1 Year 0 5 10 15 20 25 30 35 40 2006 2007 2008 2009 2010 2011 Metro Outer Metro Regional
Table 1 Selected outcomes of the prospective observational 45 and Up Study for factors influencing rates of PAH among people with chronic disease
Reference Chronic
conditions Factors influencing PAH rates Comment (Tran et al.,
2015a)* Any Current smoking HR 1.89 (1.75-2.03) Smoking intensity and quitting smoking also influenced rates of PAH COPD Current smoking HR 6.81 (5.87-7.89)
CHF Current smoking HR 1.41 (1.14-1.74) Diabetes Current smoking HR 1.25 (1.10-1.42 Angina Current smoking HR 1.32 (1.15-1.52) (Tran et al.,
2014)** Any history or none (62% without)
Number of healthy behaviours§:
0 - HR 1.13 (0.8-1.61) 1 – HR 1.00 2 – HR 0.82 (0.73-0.92) 3 – HR 0.76 (0.69-0.85) 4 – HR 0.57 (0.51-0.63) 5 – HR 0.49 (0.44-0.54) 6 – HR 0.46 (0.41-0.52)
Individually, smoking and physical activity had the greatest impact
(Comino et al.,
2015)*** Diabetes Continuity of care HR 0.92 (0.89-0.96) Annual cycle of care HR 0.77 (0.74-0.80) GPMP/TCA preparation HR 1.04 (1.01-1.07)
GPMP/TCA review HR 0.92 (0.89-0.96) Urinary microalbumin monitoring HR 0.54 (0.53-0.56) Multidisciplinary team HR 0.92 (0.89-0.96) Diabetes educator HR 0.76 (0.68-0.86) Physiotherapist HR 0.63 (0.58-0.69) Podiatrist HR 0.98 (0.94-1.02) Exercise physiologist HR 0.75 (0.64-0.89) Dietician HR 0.86 (0.79-0.94)
Increased risk for PAH with Medicare record of claim for:
Increased GP visits, long consultation, insulin, GPMP/TCA preparation, ophthalmologist eye examination, cholesterol monitoring
Decreased risk for PAH with Medicare record of claim for:
Oral antidiabetic
medication, annual cycle of care, GPMP/TCA review, HbA1c monitoring, urinary micro-albumin monitoring, eye examination by practice nurse, multidisciplinary care (HR with individual providers as listed) (Falster et al., 2015)# from supplementary figure 3. Any or none (62% without)
Incidence rate ratios (IRR) for chronic disease PAH:
Age 45–54 1.0 (reference group) Age 65–74 years IRR 2.38 (2.22-2.54) Age 75–84 years IRR 3.15 (2.94-3.37)
Higher rates of admission associated with older age and poorer health
Reference Chronic
conditions Factors influencing PAH rates Comment Indigenous status IRR 2.06 (1.85-2.28)
Widowed or separated (versus married or partnered) IRR 1.14 (1.10-1.17) Four healthy behavioursβ (versus one) IRR 0.81 (0.76-0.86)
Self-rated health poor (versus excellent) IRR 5.38 (4.85-5.97)
One comorbidity (versus none) IRR 1.59 (1.51-1.67)
Three or more comorbidities (versus none) IRR 4.11 (3.9-4.33)
Psychological distress¥ very high (versus low) IRR 0.85 (0.79-0.93)
Functional limitationδ severe (versus none) IRR 2.32 (2.17-2.48)
* Adjusted for age, sex, BMI, education, marital status, household income, remoteness, language other than English, private health insurance, prior PAH admission in past 12 months and number of positive health behaviours. **Adjusted for age, sex, education, marital status, income, remoteness, language other than English, private health insurance, history of chronic diseases, prior PAH admission and mutually adjusted for other health behaviours.***Adjusted for age, gender, country of birth, education, household income, ARIA+, duration of diabetes and number of chronic conditions;§Healthy behaviours were non-smoking, <14 alcohol
drinks per week, ≥2.5 hours physical activity per week, ≥2 servings of fruit and 5 servings of vegetables per
day, <8 hours sitting time per 24 hours, ≥7 hours sleeping time per 24 hours; #Adjusted for all person-level
variables and area-level quintiles of full time workload equivalent GPs; HR = hazard ratio; IRR = Incident Rate
Ratio; β healthy behaviours were non-smoking, <14 alcohol drinks per week, ≥2.5 hours physical activity per
week, ≥2 servings of fruit and 5 servings of vegetables per day; ¥Psychological stress measured using the
Kessler-10 scale;δ Functional limitation measured using the Medical Outcomes Study physical functioning
scale..
With respect to the importance of management plans, retrospective examination of data for almost six thousand elderly Australian veteran patients with HF also showed a significant association between use of general practitioner management plans with team care arrangements and delayed time to next PAH for HF, Hazard Ratio = 0.77 (0.64-0.92) (Vitry et al., 2014). However, approximately 60 per cent of the intervention group reported at least one any cause hospitalisation in the previous year compared to only five per cent of controls, and as noted by Vitry et al. (2014) this between-group difference may be a source of confounding that in part explains the reported outcomes. The authors also listed a number of other potential confounders, and this reflects the non-controlled study design.
In summary, factors influencing rates of PAH (and potentially ED presentation) in the Australian context vary depending on the chronic condition, but are likely to include age, prior admission, Indigenous status, health status, functional status, comorbidity, and health behaviour. Interventions likely to impact on rates of PAH are those programmes based on access to multidisciplinary teams and general practitioner management plans. Future programmes may also benefit from addressing health behaviour and functional status. Findings on the impact of smoking are particularly pertinent to PAHs in vulnerable groups that have higher rates of smoking, such as Indigenous Australians, those living in rural/remote areas and those in lower socioeconomic status (SES) (Winstanley and White,
2012). However it should also be noted that the evidence from the 45 and Up Study highlighted here requires confirmation in other relevant cohorts and may be context specific.
Overview of findings from systematic reviews
The primary focus of this report is to identify programmes aimed at reducing rates of PAH and ED presentations for people with chronic disease, and identifying as Aboriginal and Torres Strait
Islander, and/or rural or remote resident, and/or at socioeconomic disadvantage. Systematic reviews represent high level evidence that minimises the inherent bias of single cohort studies, and pooling of studies is used to identify specific intervention- and patient-related factors likely to be relevant across different settings. Knowledge of these factors provides a framework with which to review programmes addressing PAHs and ED presentations among the target groups.
Six systematic reviews were identified relating to patient-level variables and prediction of PAH, ED presentation or readmission risk, and 12 reviews explored the relationship between primary health care or hospital-based interventions and risk for PAH, ED presentation or hospital readmission (Table 7). Assessment of the systematic reviews indicated that most were of acceptable quality, although many were restricted to English language publications and in some instances the applicability of outcomes to the Australian setting was limited by the inclusion of very few Australian studies and/or a high representation of US-based studies.
Patient-level predictors
Patient-level predictors identified in systematic reviews generally confirmed the importance of age, socioeconomic status, ethnicity, and rurality in risk for PAHs and ED presentations, and also for hospital readmission as highlighted in the previous PHCRIS review (Table 6) (Henson et al., 2015, Kansagara et al., 2011, Muenchberger and Kendall, 2010, Ross et al., 2008, van Tiel et al., 2015, Wallace et al., 2013, Katterl et al., 2012). In addition, relationship status and
comorbidity/multimorbidity is associated with higher rates of PAH, ED presentation and readmission, while mental health and alcohol or substance use were implicated in some systematic reviews. Many of the studies included in these reviews were aimed at development of predictive risk models for the purpose of risk stratification of patients according to risk for hospitalisation. As recently reviewed, the predictive accuracy of these models is modest but similar, and while targeting those at most risk can improve sensitivity and positive predictive value, this may potentially lead to health care
inequalities (Lewis, 2015a, Oliver-Baxter et al., 2015)
Interventions to reduce PAH and ED presentations
Thirteen systematic reviews were identified that addressed primary health care and hospital-based interventions aimed at reducing rates of PAH (Gibson et al., 2013, Rosano et al., 2013, Thomas et al., 2013, van Loenen et al., 2014, Stokes et al., 2015), or ED presentation (Fan et al., 2014, Flores-Mateo et al., 2012, Huntley et al., 2014, Soril et al., 2015), or hospital readmission (Benbassat and Taragin, 2013, Leppin et al., 2014, Takeda et al., 2012), or hospitalisation and ED presentation (Hickam et al., 2013). A summary of findings from these reviews is presented below.
Potentially avoidable hospitalisation (PAH)
Continuity of care with a primary health care provider was associated with reduced rates of hospitalisation in most settings (Huntley et al., 2014, van Loenen et al., 2014). However, this outcome varied depending on the presenting condition, and was supported for asthma but not diabetes or CHD, although the number of studies was small (Huntley et al., 2014).
Systematic reviews supported the relationship between improved primary health care access (or GP number) and reduced PAHs in the US and Canadian settings, but generally not in non-US health care systems such as the UK (Rosano et al., 2013, Huntley et al., 2014, van Loenen et al., 2014). An exception to this was one systematic review (Gibson et al., 2013) judged to be of lower quality, where improved access to primary health care was associated with reduced PAHs among patients with diabetes or chronic disease in non-US countries. This review also showed that an increased number of primary health care visits (primary health care use) was associated with increasing rates of PAH (Gibson et al., 2013). Associations with other factors such as workforce number and composition were inconclusive (van Loenen et al., 2014). Finally, with respect to practice characteristics,
outcomes were inconsistent. The availability of practice nurses was associated with less PAHs among COPD and asthma patients; and this was only true for diabetes patients where a community health worker was also involved (van Loenen et al., 2014, Gibson et al., 2013). In a review of outpatient case management7 Hickam et al. (2013) found no evidence that this influenced hospitalisation rates
among people with chronic disease, but did find that it was associated with reduced ED presentations for those with COPD (based on 17 studies). However, case management was associated with improved self-management particularly among those with progressive disease or serious social problems (Hickam et al., 2013). The most recent analysis of case management for ‘at risk’ patients in primary care included 36 individual studies in a meta-analysis and also found no evidence for a reduction in primary or secondary care use or total costs (Stokes et al., 2015). Separate analyses were made to account for study design, strength of primary health care orientation (characteristics of health system policy that are conducive to primary care, as well as characteristics of clinical practice), multidisciplinary team versus single case manager, type of risk tool used, and inclusion of a social worker. However, with the exception of patient satisfaction (small effect size) none of the outcomes examined reached significance even after accounting for the identified study differences. According to the authors, the evidence did point to more effective care with programmes that included multidisciplinary teams and a social worker. It was also noted by the authors that pooling the results from programmes conducted in different contexts is problematic because accounting for programme differences is very difficult and challenged by inconsistent reporting. This should be viewed as a potential limitation of meta-analysis for complex programmes. A small number of effective programmes may be masked by ineffective programmes unless the critical differences have been identified and accounted for.
One systematic review examined the impact of hospital-based interventions on PAH rates among adults (Thomas et al., 2013). This is relevant to the current review because it provides a comparative measure against which to evaluate the impact of hospital-based programmes incorporating primary health care. Findings from 10 RCTs of interventions for HF patients, found a significant impact on PAHs of specialist clinics located in hospital outpatient centres (Thomas et al., 2013). The
predominantly European studies suggested collectively that intensive monitoring over the first two months after discharge and three monthly visits thereafter resulted in a 58 per cent reduction in relative risk for emergency admission.
Emergency Department (ED) presentation
Four systematic reviews were identified that explored primary health care-related variables and ED presentations, although the applicability of outcomes to the Australian setting may be limited (Huntley et al., 2014, Flores-Mateo et al., 2012, Fan et al., 2014, Soril et al., 2015). Based on 36 weak
7 A health care service in which a single person, working alone or in conjunction with a team, coordinates services and augments clinical
to moderate quality studies, seven common elements of intervention models aimed at reducing ED presentations among elderly people were identified (Fan et al., 2014). These elements were:
• multidisciplinary team and gerontological expertise
• integrated and enhanced primary care
• integrated social and medical care
• risk screening and geriatric assessment
• care planning and management
• discharge planning and referral coordination
• follow-up and regular group visits.
Most community-based and some hospital-based intervention studies were associated with significant reductions in ED presentations (Fan et al., 2014). All of the effective community-based interventions included multidisciplinary teams and gerontological expertise.
Increased access (numbers of primary health care centres or GPs) was associated with reductions in ED presentations by as much as 40 per cent (Flores-Mateo et al., 2012). Similarly, after hours service provision was associated with ED presentation reductions, but telephone services were not, with a suggestion that they delay rather than resolve the problem (Flores-Mateo et al., 2012).
There was moderate support for the value of case management in reducing frequent ED
presentation, but limited and inconclusive evidence for individualised care plans and information sharing (Soril et al., 2015).
Evidence for practice features such as size and location, depending on setting (US versus UK) and condition (asthma versus diabetes) was inconsistent (Huntley et al., 2014). Huntley et al. summarises the current evidence base as providing no clear support for any particular policy change. Similarly a non-systematic review (Purdy, 2010) also found insufficient evidence for the impact of care plans on reducing rates of PAH.
Hospital readmission risk
Publications reporting on hospital readmission were not specifically searched for in the current review. However, an overview of relevant articles identified during the search of data sources provides an update to the previous PHCRIS report.
In a high quality meta-analysis of six studies targeting patients with HF, case management generally involving a specialist nurse was associated with a significant reduction in HF-associated readmissions at six months and 12 months (odds ratios 0.64 (0.46-0.88) and 0.47 (0.30-0.76) respectively) (Takeda et al., 2012). However, the authors concluded that it was not possible to say what the optimal components of the case management-type interventions were. Although not specific for chronic conditions, a separate analysis of 47 studies with overall low risk of bias, found that intervention characteristics associated with reduced hospital readmission included improving patient capacity for self-care, having a high degree of intervention complexity (five or more unique components), and involving two or more individuals in care provision (Leppin et al., 2014). Studies published after 2002 were found to be less effective, and the authors suggest a number of possible explanations for this including general improvement in levels of care leading to lower rates of readmission among control groups and less room for improvement, or a move towards high tech interventions with less
emphasis on human interaction. In a very comprehensive review of 57 published meta-analyses covering various patient groups, Benbassat and Taragin (2013) concluded that for people with HF, a combination of community-based interventions including discharge planning, disease
management, patient education, home visits and pharmacist care reduced rates of hospital readmission, but telephone or outpatient clinic follow-up did not. However, with the possible exception of coronary heart disease and bronchial asthma, for most other chronic conditions intervention outcomes were inconsistent or failed to reach significance.
Summary
Overall, systematic reviews of predominantly retrospective database and prospective studies confirmed the importance of age, socioeconomic status, ethnicity, and rurality in risk for PAHs and ED presentations, and also for hospital readmissions. Relationship status,
comorbidity/multimorbidity, mental health and alcohol or substance abuse were also implicated in some systematic reviews.
With respect to systematic reviews of interventions, currently available evidence from mostly controlled trials suggests that reduced rates of PAHs and ED presentations are likely with continuity of GP care, and possibly multidisciplinary disease management programmes including use of practice or specialist nurses. In the US, availability of GPs is associated with reduced rates of PAH and ED presentation, but the evidence is less consistent for other countries. In contrast, increasing number of GP visits may indicate an increased risk for PAHs; although again this may differ between health care systems depending on accessibility to specialists. However, it is important to acknowledge that these findings are largely based on intervention trials and outside of this context many patients may be hospitalised or present to ED despite having good access to a GP of their own choice, and
interventions based only on GP access may have variable impact in different ‘real world’ settings (Manski-Nankervis et al., 2014). Demonstration that outcomes are sensitive to the population or chronic condition studied, particularly where vulnerable groups are concerned, emphasises the importance of tailoring approaches aimed at characterising and targeting PAHs to the specific population and context (Purdey and Huntley, 2013).
Programmes to reduce PAHs and ED presentations
As noted above, despite all states and territories having supported implementation of chronic disease programmes, there has been little change in PAH rates among people with chronic disease over the past decade. Although this observation should be regarded with caution due to data
limitations, this is similar to the NZ experience where improved access to primary health care has not correlated with reductions in PAH (Milne et al., 2015). A large evaluation of 16 pilot programmes for integrated care in the UK also concluded that there was no evidence of a general reduction in emergency admissions for programmes that predominantly concentrated on improving horizontal integration between primary care and community-based services (RAND Europe, 2012). However, there was a significant reduction in planned admissions. As noted in a non-systematic review of programmes (Purdey and Huntley, 2013), in light of uncertainty surrounding evidence for
interventions to reduce ED presentation activity there is a need for “robust evaluation of services as they are introduced into health and social care systems” (p 340). Although numerous relevant programmes were identified through searching of literature data bases and specific website content, most did not report outcomes data or provide a rigorous evaluation and therefore were not included in the current review. In many cases, reporting was minimal for eligible programmes, and it is
recommended that future evaluation of interventions is built into programmes as was done for the NSW CDM and the ACE programmes outlined in the following sections.
Details of thirteen eligible programmes included in the current review are provided in Table 8 and Table 9 of theappendices. Due to overlap between the vulnerable population categories considered in the current review, with many participants identifying with all three, a number of the programmes