Ef
f
i
ci
ency
of
publ
i
c
s
pendi
ng
i
n
s
uppor
t
of
R&D
act
i
vi
t
i
es
Mi
chel
e
Ci
ncer
a,
Di
r
k
Czar
ni
t
zki
and
Sus
anne
Thor
war
t
h
Economi
c
Paper
s
376|
Apr
i
l
2009
EUROPEAN
ECONOMY
Economic Papers are written by the Staff of the Directorate-General for Economic and Financial Affairs, or by experts working in association with them. The Papers are intended to increase awareness of the technical work being done by staff and to seek comments and suggestions for further analysis. The views expressed are the author’s alone and do not necessarily correspond to those of the European Commission. Comments and enquiries should be addressed to:
European Commission
Directorate-General for Economic and Financial Affairs Publications
B-1049 Brussels Belgium
E-mail: [email protected]
This paper exists in English only and can be downloaded from the website
http://ec.europa.eu/economy_finance/publications
A great deal of additional information is available on the Internet. It can be accessed through the Europa server (http://europa.eu )
KC-AI-09-376-EN-N ISSN 1725-3187
ISBN 978-92-79-11187-7 DOI 10.2765/33949
Efficiency of public spending in support of R&D activities
1Michele Cincera (ULB, CEPR and JRC-IPTS)2
Dirk Czarnitzki (KUL & ZEW) Susanne Thorwarth (KUL & ZEW)
This version: 26.03.2009
1
This study was commissioned by the Directorate General Economic and Financial Affairs of the European Commission under the reference ECFIN/-325-2006/SI2.453966.
The authors are most grateful to António Afonso, Andrea Conte, Adriaan Dierx, Olivia Galgau, Fabienne Ilzkovitz, Karolina Leib, Georg Licht, Ulrike Mandl, Jan Schmidt, Pierre Therrien, Reinhilde Veugelers as well as participants at the Joint European Commission/German Presidency Workshop on the “Efficiency of spending on education and R&D”, March 12, 2007, Charlemagne Building, Brussels; the seminar on the “Evaluation et efficacité des politiques publiques”, CRP Henri Tudor, April 27, 2007, Luxembourg; the Technology and Economic Development 2nd International Conference on the Dynamics of Science and Technology Policies, University of Economics, May 25-26, 2007, Izmir; the INNO-Views Policy Workshop, “Metrics to better understand innovation performance: New approaches to measuring innovation”, Joint Research Centre of the European Commission, July 5-6, 2007, Ispra; the DULBEA conference “50 ans d’économie appliquée au service de la société”, October 11-12, 2007, Université Libre de Bruxelles; the joint EPC / European Commission Workshop on “Developing a framework for measuring efficiency and effectiveness of public spending”, Albert Borschette Conference Centre, February 12, 2008, Brussels; the Workshop on “Assessing the socio-economic impacts of public R&D investment”, Working Party on Technology and Innovation Policy (TIP), 11 June 2008, OECD, Paris; the Informal EPC Meeting on “Improving the quality of fiscal and economic policy in the context of the Lisbon-Strategy”, 26 June 2008, Potsdam; the French EU Presidency Conference on “Knowledge for Growth: European Strategies in Global Economy” 7-9 June 2008, Toulouse; the Informal EPC Meeting on “Improving the quality of fiscal and economic policy in the context of the Lisbon-Strategy”, 10 December 2008, Brussels; and an IPTS internal seminar, 15 January 2009, Seville for helpful comments and suggestions.
The findings, interpretations and conclusions expressed in this paper are entirely those of the authors and do not necessarily represent those of the European Commission. They should not be attributed to the European Commission.
2 Corresponding author. DULBEA CP140, Université Libre de Bruxelles, 50, Av. F.D. Roosevelt, B-1050 Brussels. Email:
Abstract
This study aims at assessing the level of efficiency of public R&D spending and public R&D support for private R&D and to compare efficiency scores among OECD countries, in particular EU Member states over the past two decades. The analysis rests on the concept of efficiency which is based on the relationship between public R&D spending and the additional R&D in the business sector induced by such measures. The differences observed in efficiency performance across countries is then explained in relation to control variables, e.g. exogenous framework conditions.
Given the different specifications considered and the two methods implemented, i.e. Stochastic Frontier and non-parametric Data Envelopment Analysis, results inevitably diverge and in some cases to a large extent. Some results are nevertheless robust and consistent through the different methods and model specifications.
For the efficiency scores, three groups of countries emerge. The first group refers to the most efficient countries in terms of R&D public support, namely Australia, Canada, Finland, Germany, Japan, Netherlands, New Zealand, Singapore, Switzerland, and the USA. The second group is composed by France, Hungary, Italy, Korea, Norway, Sweden, Spain and the United Kingdom. The third group of the less efficient countries in terms of R&D public spending includes China, Croatia, Czech Republic, Israel, Latvia, Poland, Romania, Russia, and the Slovak Republic.
In terms of the determinants explaining these performances, conditional efficiency scores are found to be higher in the most industrialized countries worldwide. In terms of GDP per capita, countries in an intermediate position are characterized by lower efficiency scores of their public R&D support funding. Unsurprisingly countries with the best performance in terms of innovative activities are also the ones that exhibit the highest efficiencies of their public R&D support, while higher government expenditures in percentage of total consumption are associated with lower performance in terms of efficiency. In terms of industrial structure, economies with a higher share of high-tech manufacturing sectors in the total manufacturing value added benefit from higher efficiency performance of their public R&D supporting policy instruments while economic growth does not seem to affect efficiency scores.
In terms of regulatory and macroeconomic conditions, a positive and significant impact is observed on the efficiency scores of a more favourable tax regime to international trade, of more deregulation in the labour and business markets as well as of the strength of the Intellectual Property Right System. On the other hand, access to sound money does not appear to positively affect public R&D efficiency. The share of the general government consumption in percentage of total consumption negatively affects the efficiency scores and as expected countries with high inflation rates appear to be less efficient.
Finally, there seems to be no unique public strategy that determines high efficiency levels and more general conclusions about “optimal” policy mixes with respect to public R&D would require to go beyond the pure macroeconomic level.
Keywords
Public, private R&D, (determinants of) efficiency, framework conditions, SFA, DEA.
Table of contents
List of tables List of figures Executive summary 1. Introduction
2. Survey of the empirical literature
2.1. Studies assessing the efficiency of public spending 2.2. Efficiency of R&D policies
2.3. Determinants of the efficiency of R&D activities and policies 2.4. Conclusion of the literature section
3. Efficiency and R&D: Some concepts and issues
3.1. Input, output, outcome, efficiency and effectiveness 3.2. Assessing efficiency
3.3. Issues in assessing the efficiency of public policies in general and R&D in particular
4. Empirical framework
4.1. Non parametric methods to measure efficiency 4.2. Parametric methods to measure efficiency 5. Data
5.1. Data sources
5.2. Descriptive statistics 6. Results
6.1. Guide through the empirical study 6.2. Stochastic Frontier Approach
6.2.1. Cross-sections estimates
6.2.2. Panel data estimations on BERD and R&D personnel
6.2.3. Panel data estimations: conditional mean of inefficiency term depending on covariates
6.2.4. Robustness tests 6.3. Non Parametric approach
6.3.1. DEA benchmark results and evolution over time
6.3.2. DEA results for the most recent period, New Member states and crowding out effects
6.3.3. Sensitivity analysis
6.3.4. Determinants of efficiency scores: Tobit regressions 6.3.5. Predicted efficiency scores
6.4. Comparison of efficiency scores and their determinants: SFA and DEA 6.4.1. Efficiency scores
6.4.2. Determinants 7. Conclusions
References Annexes
List of tables
Table 1 Framework conditions on Business R&D
Table 2 Average BERD Intensity and subsidies by government (BERDBYGOV) in
1980-1984, 1990-1994 and 2000-2004
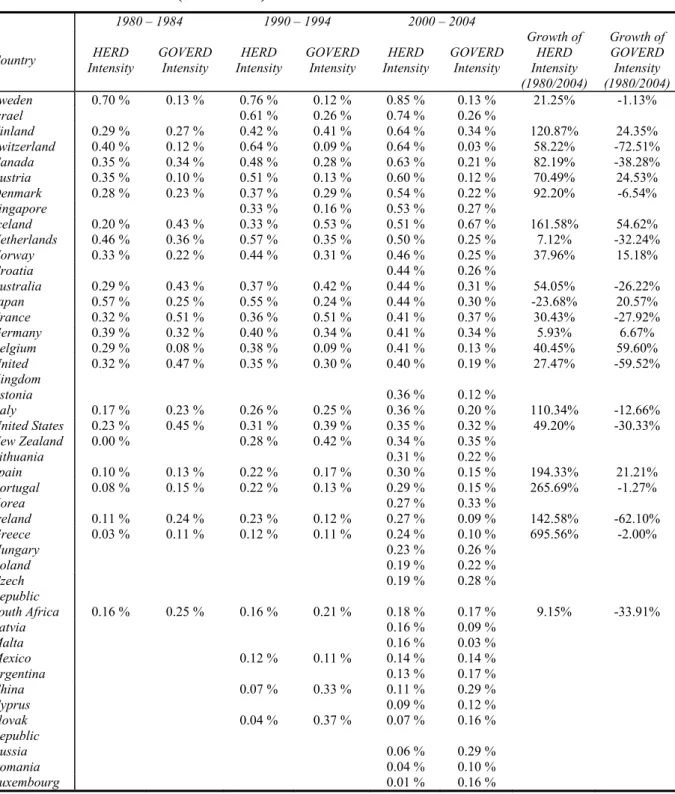
Table 3 R&D expenditure in Higher Education (HERD) and other governmental institutions (GOVERD)
Table 4 R&D personnel/GDP
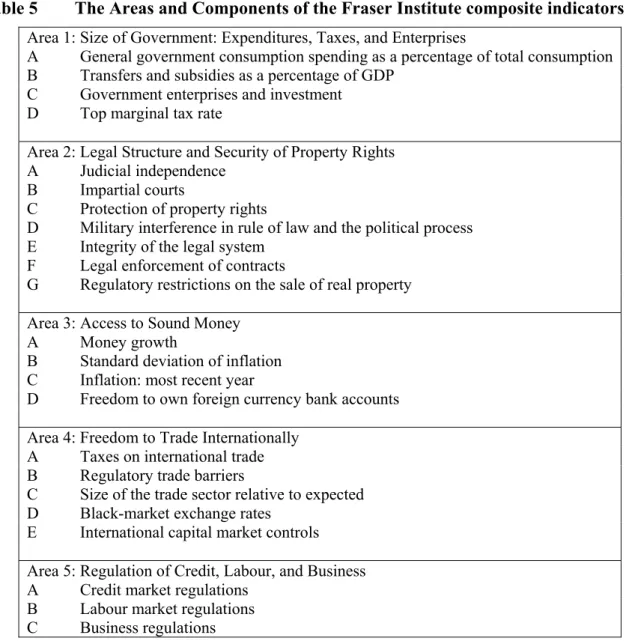
Table 5 The Areas and Components of the Fraser Institute composite indicators Table 6 Descriptive Statistics for the five area indicators of the Fraser Institute Table 7 Descriptive Statistics for Business R&D enhancing factors (1980 -1984 and
1990-1994)
Table 8 Descriptive Statistics for administrative, institutional and business R&D enhancing factors (2000 -2004)*
Table 9 Stochastic Frontier Estimation – Specification using GDP as size denominator# Table 10 Stochastic Frontier Estimation – Specification using GDP as size denominator –
Outlier corrected
Table 11 Stochastic Frontier Panel Data Estimation on R&D Personnel in the business sector
Table 12 Stochastic Frontier Estimation (1) Table 13 Stochastic Frontier Estimation (2) Table 14 Stochastic Frontier Estimation (3) Table 15 Stochastic Frontier Estimation (4)
Table 16 DEA output efficiency scores - 3 inputs (lnHERD, lnGOVERD,
lnBERDBYGOV), 1 output (lnBERD), variable returns to scale, Average over 5 sub periods, 1980-1984 until 2000-2004
Table 17 DEA output efficiency scores - 3 inputs (lnHERD, lnGOVERD,
lnBERDBYGOV), 1 output (lnBERD), variable returns to scale, 2000-2004 Table 18 Impact of different groupings of countries on DEA efficiency scores
Table 19 Impact of regulatory and macroeconomic conditions on DEA efficiency scores Panel data TOBIT regression
Table 20 Impact of administrative, institutional and business determinants on DEA efficiency scores - Panel data TOBIT regression
Table 21 Determinants of efficiency scores: Comparison of SFA and DEA methods
Table A 1 R&D personnel for three sub periods 1980-1984, 1990-1994 and 2000-2004
Table A 2 Correlation matrix
Table A 3 Stochastic Frontier Estimation – Basic specification A Table A 4 Stochastic Frontier Estimation – Basic specification B
Table A 5 Stochastic Frontier Panel Data Estimation on BERD
Table A 6 Stochastic Frontier Panel Data Estimation on R&D Personnel in the business sector
Table A 7 DEA output efficiency scores, 3 inputs (HERD, GOVERD, BERDBYGOV), 1
output (BERD)
Table A 8 DEA output efficiency scores - 3 inputs (HERD, GOVERD, BERDBYGOV),
1 output (BER vs. BERD), variable returns to scale, 2000-2004, BER vs. BERD
Table A 9 Output efficiency scores, 3 inputs (HERD, GOVERD, BERDBYGOV), 1
output (BERD), 2000-2004, Variable vs. Constant returns to scale and DEA vs. SCI and FDH
Table A 10 DEA output efficiency scores - 3 inputs (HERD, GOVERD, BERDBYGOV),
1 output (BERD), variable returns to scale, 2000-2004, Levels of variables vs. Natural logarithms and % in terms of GDP
Table A 11 DEA output efficiency scores - 3 inputs (HERD, GOVERD, BERDBYGOV),
1 output (BERD), variable returns to scale, 2000-2004, B-index
Table A 12 DEA output efficiency scores - 3 inputs (lnHERD, lnGOVERD,
lnBERDBYGOV), 1 output (lnBERD), variable returns to scale, 2000-2004 different samples
Table A 13 Correlation matrix between the variables used in the first stage (DEA analysis) and the determinants used in the second stage (Tobit regression)
Table A 14 Impact of detailed regulatory conditions on DEA efficiency scores: Panel data TOBIT regression
List of figures
Figure 1 Strengths and weaknesses of alternative methods for assessing the (in)efficiency of public spending on R&D
Figure 2 Concepts of efficiency and effectiveness Figure 3 Efficiency frontier
Figure 4 Peer group and efficiency frontier
Figure 5 Scatterplot of BERD Intensity (2000-2004) vs. growth rates of BERD Intensity (both in %)
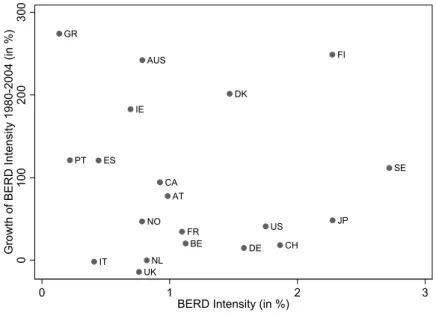
Figure 6 Scatterplot of growth rates of HERD Intensity vs. GOVERD Intensity (both in %)
Figure 7 BERD intensity vs. HERD intensity for 2000-2004
Figure 8 BERD Intensity vs. GOVERD Intensity in 2000-2004
Figure 9 BERD Intensity vs. BERDBYGOV Intensity in 2000-2004
Figure 10 Efficiency scores DEA output efficiency scores 3 inputs (lnHERD, lnGOVERD, lnBERDBYGOV), 1 output (lnBERD) variable returns to scale, 5 sub-periods (1980-2004)
Figure 11 Comparison of efficiency scores obtained from SFA vs. DEA
Figure 12 Comparison of DEA efficiency scores: R&D expenditures vs. personnel Figure A 1 BERD intensity vs. HERD intensity (both in logs) for all sub periods
Figure A 2 BERD vs. BERDBYGOV (both in logs) for all sub periods
Figure A 3 BERD vs. GOVERD (both in logs) for all sub periods
Figure A 4 Comparison of efficiency scores (DEA analysis) obtained from R&D expenditures (ln BERD) vs. R&D personnel (ln BER)
Figure A 5 Scatterplot of DEA predicted and unpredicted scores (ln berd vs. ln ber as output) based on the Fraser Institute regulatory conditions
Executive Summary
The objective of the study is to explore the possibility of using quantitative methods to assess efficiency of public R&D with respect to stimulating private R&D at the macroeconomic level. The study sought to make use of readily available indicators and statistics to measure the level of efficiency of public R&D spending and public R&D support for private R&D and to compare efficiency indices among OECD countries, in particular the EU member states. In order to do so, the study makes use of macroeconomic data from the recent two decades. The analysis rests on the concept of efficiency which is based on the relationship between public R&D spending (inputs) and the additional R&D in the business sector induced by such measures (output). As such the study can be considered as a first step of the analysis of the effects of R&D on the outcomes of such activities, e.g. output or TFP growth.
The differences observed in efficiency performance across countries can then be explained in relation to control variables. Among those are exogenous framework conditions, e.g. the nature of competition, the quality of the business environment, the IPR regime, the access to market and to external financing conditions, etc. Based on the results obtained, it is assessed whether quantitative efficiency analysis at the country level is suitable to draw conclusions on recommendations for reinforcement or retargeting innovation policy to meet the national goals of the revised Lisbon agenda.
This study uses two main methods that have been widely used in the literature, namely a parametric regression approach, the Stochastic Frontier Analysis (SFA), and a non-parametric method called Data Envelopment Analysis (DEA). Both methods relate the output, i.e. private R&D spending (BERD) and alternatively the R&D personnel employed in the business sector, to inputs. The study considers public R&D funding in the business sector including other direct payments towards R&D from government to industry (BERDBYGOV), expenditures on higher education research and development (HERD) and R&D conducted in public labs (GOVERD) as relevant input measures. Both methods estimate an efficiency term, that is, the extent of slack in government expenditures. In other words they allow the estimation of efficiency frontiers and efficiency losses.
The obtained technical efficiency scores of public R&D spending across countries can then be explained by exogenous factors or framework conditions varying across countries in a second stage. While the SFA allows to simultaneously estimate the R&D equation and the efficiency terms, Tobit models are used after unconditional efficiency scores are calculated with DEA. By applying the DEA and the SFA method, this study uses two approaches which represent the most commonly used in the literature to assess the efficiency of public spending at the macroeconomic level.
The Stochastic Frontier Analysis is conducted by estimating cross-sectional estimations, i.e. using only one-time period, as well as panel models, i.e. using all time periods at once. It turned out that the variables BERDBYGOV and HERD always have a positive impact on private R&D (BERD) and R&D personnel employed in the business sector, and that the
estimated coefficients have a reasonable and meaningful magnitude. However, the sample of countries is too small to detect statistically significant inefficiencies in a single time period. In other words the small sample size of the cross-section does not allow to estimate inefficiencies with enough precision, so that we only find insignificant estimates of the efficiency index. Even in the panel data models, the SFA does not detect significant unconditional inefficiencies, that is, if the efficiency term is not related to certain country characteristics, the SFA does not report statistically significant inefficiencies. In a final step we apply panel regressions in which we assume that the conditional mean of the inefficiency term depends on covariates. Contrary to the former results we now find interesting differences across countries’ efficiencies based on the choice of the dependent variable (BERD or R&D personnel). Results indicate that the inefficiency is highest in EU15 countries when it comes to R&D employment in the business sector as reaction to public R&D spending either as subsidies or R&D performed in the public sector.
The results improve further if we apply more structural variables rather than ad-hoc country groupings. It turns out that index variables, such as the access to sound money and the legal structure and security of property rights, point in the same direction for both dependent variables, BERD and R&D employment: the better the index, the higher is the efficiency in a country's R&D investment in the business sector as response to public R&D.
The DEA analysis which is conducted by using an one-output three-input framework leads to the result that - averaged over five time periods - 3 countries out of 21, namely Japan, Switzerland and the United States are ranked in the first position and lie on the production possibility frontier. The other countries are inefficient in the sense that given their combination of inputs they achieve a lower amount of output as compared to the efficient countries which use similar combination of inputs. Regarding the evolution of efficiency scores over time it turns out that Japan, Switzerland and the United States are the three countries which are efficient for each of the five sub-periods. This is also the case for Ireland and Iceland, except for the last sub period. For the other countries, efficiency scores appear to decline over time. This drop is more pronounced for countries like Austria, Italy, Spain and Norway. On the contrary, France, Germany and Sweden are characterized by a relative small decline of their efficiency scores. Finally, Canada and Denmark are the only two countries which improve the efficiency of their public R&D over time.
Applying the DEA over the more recent time period substantially increases the number of countries in the sample. Japan, Switzerland and the United States are still among the top efficient countries and some new Member States are listed among the most efficient countries (Cyprus, Estonia, Lithuania, Malta) and other among the less efficient ones (The Slovak Republic, Latvia and Poland). The unique situation of some of these transition economies, the crowding in effect through the wages of the R&D personnel may explain their lower efficiency performance while the small size of some of these countries tends to overestimate their efficiency.
In terms of the impact of different determinants to explain differences in DEA efficiency scores across countries, conditioning the scores on different country groupings partly confirm the crownding out/in effects. Conditional efficiency scores are also found to be higher for the most industrialized countries worldwide. In terms of GDP per capita, countries in an intermediate position are characterized by lower efficiency scores of their public R&D support funding. Unsurprisingly countries with the best performance in terms of innovative activities are also the ones that exhibit the highest efficiencies of their public R&D support, while higher government expenditures in percentage of total consumption are associated with lower performance in terms of efficiency.
In terms of regulatory and macroeconomic conditions, we observe a positive and significant impact of a more favourable tax regime to international trade as well as more deregulation in the labour and business markets on the efficiency scores. Access to sound money does not appear to positively affect public R&D efficiency. The share of the general government consumption in percentage of total consumption negatively affects the efficiency scores and conversely for the legal structure and security of property rights. Then as expected countries with high inflation rates appear to be less efficient while economic growth does not seem to affect efficiency scores.
In terms of administrative, institutional and business conditions that enhance R&D activities in the private sector and affect the efficiency of public R&D policies, results as regards the former were inconclusive. In terms of industrial structure, economies with a higher share of high-tech manufacturing sectors in the total manufacturing value added benefit from higher efficiency performance of their public R&D supporting policy instruments. The importance of public procurement advertised in the Official Journal as a percentage of GDP and as a percentage of total public procurements as well as the strength of the IPR system negatively affect the efficiency performance. Yet, as regards IPR, this result must be mitigated as a positive impact is found for the EU15 Member states and the most advanced countries in the world.
To sum up, given all these different specifications it appears that the results inevitably diverge and in some cases to a large extent. Some results are nevertheless robust and consistent through the different methods and model specifications. For the efficiency scores it has been shown that three groups of countries emerge. The first group refers to the most efficient countries in terms of R&D public support. The countries that belong to this group are Australia, Canada, Finland, Germany, Japan, Netherlands, New Zealand, Singapore, Switzerland, and the USA. The second group is composed by France, Hungary, Italy, Korea, Norway, Sweden, Spain and the United Kingdom. The third group of the less efficient countries in terms of R&D public spending includes China, Croatia, Czech Republic, Israel, Latvia, Poland, Romania, Russia, Slovak Republic. On the one hand, one can attempt to explain the differences in efficiency performance by the possible presence of crowding-in or crowding-out effects of the public R&D support depending on certain country characteristics. For example, countries with low BERD may turn out to be inefficient when the efficiency of
public spending is considered. However, a low level of wages of R&D personnel and the relatively abundant stock of researchers and scientists in these countries may result in a relatively large employment effect compared to e.g. EU15 member states (where wages are higher and unemployment among scientists may be relatively low) when public spending is extended. On the other hand, it is questionable if the results are suitable enough to draw these conclusions as, first, the DEA and SFA results are not always comparable due to different assumptions underlying the estimations (which cannot be tested), second, macroeconomic country data may not necessarily be sufficient to judge about inefficiencies without a detailed case-by-case study of the underlying policy mix, that is, a careful review of the different policy schemes at work and countries’ industry composition, the composition of the public science sector in terms of weaknesses and strengths of the research disciplines in comparison to other countries, and finally the match or mismatch between foci of business and public R&D in a country.
1. Introduction
As a matter of fact, the scarcity of public expenditures is strengthened by the increased needs stemming from the ageing of the population and by a growing tax competition among industrialized countries. Moreover, the Stability and Growth Pact prevents EU Member States to run into ‘excessive’ deficits. Since public funds are scarce, available resources should be used as efficient as possible. Therefore, governments are drawing an increased attention on how to use public resources in the most efficient and effective ways and on analyzing the main factors affecting efficiency and effectiveness of public expenditures. Then, the role of Research and Development (R&D), and more generally of technological and innovative activities on economic growth, has been examined extensively in the economic literature for several decades. The ability to understand, exploit and adapt to a rapidly changing technological environment is seen to be a key factor to improve the standards of living and the prosperity of a nation. New and better products produced by firms allow them to gain market shares, while process R&D allows firms to make cheaper products, reduce their production costs and increase the overall performance of their total factor productivity (TFP).
The objective of the study is to develop an analytical framework empirically implementable to assess the efficiency of public R&D instruments, i.e. direct subsidies, public procurement, tax incentives and R&D performed in the public sector, to support firms’ R&D and innovation related activities. The study, which can be defined within the broader context of the analysis of the efficiency of both public and private R&D spending in terms of stimulating productivity and growth, seeks to collect readily available indicators and statistics to measure the level of efficiency of these instruments and compare them in the EU-27 Member States, Japan, China and the US and over the last two decades. The study rests on the concept of efficiency which is based on the relationship between policy instruments to increase firms’ R&D activities (inputs) and the additional R&D induced by such measures (output). As such the study can be considered as a first step of the analysis of the effects of R&D on the outcomes of such activities, e.g. output or TFP growth.
The differences observed in the levels (and changes) of efficiency performance across countries can then be explained in relation to control variables among which exogenous framework conditions, e.g. the nature of competition, the quality of the business environment, the IPR regime, the access to market and to external financing conditions, etc. Based on the results obtained, conclusions and recommendations are formulated to increase the efficiency of public spending for the Member states in the context of their national targets for R&D activities following the revised Lisbon strategy of 2005.
The plan of the study is as follows. Section 2 proposes a survey of the literature assessing the performance and efficiency of public expenditure in general and R&D in particular. Section 3 defines some concepts relating to inputs, output and outcomes and discusses some issues regarding the assessment of their efficiency. Section 4 discusses the empirical framework to
assess the efficiency of public spending on R&D. Section 5 describes the data sources and indicators used in the study and presents some descriptive statistics. Section 6 presents the empirical findings based on the Stochastic Frontier Analysis (SFA) and the Data Envelope Analysis (DEA) as regards the efficiency of public expenditures to support R&D activities in the private sector as well as the results as regards the impact of the framework determinants and business conditions affecting the efficiency of the public R&D policies.
2. Survey of the empirical literature3
Several approaches for measuring the efficiency of governmental expenditures have been proposed in the literature. Studies dealing with efficiency of government spending use three main categories of methods, namely composite indicators, non-parametric methods and stochastic methods4.
2.1. Studies assessing the efficiency of public spending
Non-parametric production frontier techniques, more precisely Free Disposable Hull (FDH) analysis and/or DEA methods estimate the extent of slack in government expenditures, in other words they allow the estimation of efficiency frontiers and efficiency losses. Both methods are linear programming based techniques that are able to convert multiple input and output measures into a single comprehensive measure of productive efficiency or productivity for the particular decision making units (DMUs), e.g. firms, non-profit or public organisations. In the FDH framework, it is possible to rank the efficiency of producers by comparing each individual performance with a production possibility frontier. Along this possibility frontier it is possible to observe the highest possible level of output for a given level of input and conversely it is also possible to determine the lowest level of input necessary to attain a given level of output. Likewise, the DEA method can be conducted for calculation of technical efficiency measures. Contrary to FDH, the DEA analysis assumes a convex production function which makes DEA more stringent than FDH. Thus, a country that is efficient under FDH is not always efficient under DEA whereas a country which is efficient under DEA will be always efficient under FDH5.
Afonso et al. (2006) mention different studies that investigated the performance and efficiency of the public sector and its functions using non parametric methods. These studies find significant inefficiencies in many countries6. Most of them deal with the efficiency of
3 See Appendix 1 for a summary of the main findings of the studies presented in this section. 4 See Section 4 for further details.
5 Further details on these methods are provided in Section 4.1.
6 Studies include Gupta and Verhoeven (2001) for education and health in Africa, Clements (2002) for education
in Europe, St. Aubyn (2002) for education spending in the OECD, Afonso et al. (2006) for public sector performance expenditure in the OECD, Afonso and St. Aubyn (2005a, b) for efficiency in providing health and education in OECD countries. De Borger et al. (1994), De Borger and Kerstens (1996), and Afonso and Fernandes (2006) find evidence of spending inefficiencies for the local government sector. Afonso and St.
public spending on education and health. For example, the FDH analysis to assess the efficiency of government expenditure on education and health is used by Gupta and Verhoven (2001), St. Aubyn (2002) and Clements (2002) where the latter one only deals with the efficiency of education spending. Clements (2002) discusses the efficiency of education spending in the European Union and compares their performance with a larger set of OECD countries. His dataset consists of data from 1996 onwards for 20 countries from the OECD where 12 are from the European Union. Using two input indicators (spending per student as a share of per capita GDP and the share of educational expenditure to GDP adjusted for cross-country differences in the school age population) and two output indicators (percentage of people that completes secondary education at a normal graduation age and test scores on international examinations at the eight grade) shows that about 25 percent of education spending of countries belonging to the European Union are wasteful compared to the “best practices” observed in the OECD countries.
The FDH method is also used by Afonso et al. (2003) who examine the performance and the efficiency of the public sectors of 23 industrialised OECD countries for 1990 and 2000. Since the measurement of public sector performance (PSP) and public sector efficiency (PSE), however, is still very limited, they provide a proxy for measuring PSP and PSE. The public sector performance (PSP) indicator consists of seven sub-indicators whereas the first four look at administrative, education, health and public infrastructure outcomes and the three other sub-indicators reflect the “Musgravian”7 tasks for government, namely distribution, stability and allocation (See Appendix 2). The PSP indicator is then compiled by giving equal weight to each sub-indicator and in order to facilitate the compilation the values are normalised and the average for all indices is set equal to 1. Public sector efficiency (PSE) is calculated by weighting public sector performance by the amount of relevant public
expenditure8. Unlike the PSP indicators which show only moderate differences across
industrialised countries, there are important differences across countries in the PSE indicators suggesting diminishing marginal products of higher public spending. The results indicate that the most efficient countries are the US, Japan and Luxembourg. Furthermore, small governments tend to show better results. To be more precise and regarding the 15 EU countries the average input efficiency is 0.73 which means that these countries are able to attain the same output level using only 73 percent of their currently used input. The output efficiency score is 0.82 which indicates that with given public expenditure, public sector performance is only 82 percent of what it could be if the EU was on the production possibility frontier.
Aubyn (2005b) applied a two-step DEA/Tobit analysis to examine the efficiency of secondary education across countries.
7 The ‘Musgrave Three-Function Framework’ which was developed by Richard Musgrave in his work ‘The
Theory of Public Finance’ (1959) suggests that government activity should be separated into three functions macroeconomic stabilization, income redistribution, and resource allocation.
8 Additionally to total public spending, the average spending on goods and services, transfers, functional
spending on education and health and public investment were also taken into account. In order to compute efficiency indicators, public spending was also normalised across countries with the average taking the value of one for each of the six categories.
Both methods, FDH as well as the DEA approach are used in studies conducted by Afonso and St. Aubyn (2005b) as well as Herrera and Pang (2005). Both studies deal with the efficiency in the education and health sector. Afonso and St. Aubyn (2005b) finally arrive at the conclusion that results using DEA were broadly comparable to results using FDH. Herrera and Pang (2005) additionally use a censored Tobit regression model to analyse the relationships between the efficiency scores and environmental variables. As the dependent variable, the input efficiency score already calculated with the DEA method is used. Several variables, such as the size of government expenditure, urbanization, income distribution inequality etc. are included as independent variables. This second stage analysis of the paper verifies statistical associations between the environmental variables and the efficiency scores. Afonso et al. (2006) also extend their analysis about public sector efficiency in the new EU member states. The computed DEA output efficiency scores are used to evaluate the importance of non-discretionary inputs via a Tobit regression where output efficiency scores are regressed on several non-discretionary factors. The results confirm the authors’ hypothesis that environmental factors, such as the security of property rights, per capita GDP, the competence of civil servants and the education level of people positively affect expenditure efficiency.
Evans et al. (2000) as well as St. Aubyn (2002) also use parametric methods to examine efficiency on health and education. Evans et al. (2000) argue that since neither the maximum (frontier) nor the minimum levels of health are observable they have to be estimated. Thus, first of all a corrected ordinary least squares (COLS) procedure is then applied to estimate the minimum health level for 1997. Applying COLS a production function is first estimated using OLS and then shift up the OLS intercept parameter by the value of the largest positive residual to give the equation for the frontier. This ensures that all data points lie below the estimation frontier. In a next step a full translog model is estimated by using fixed effects. The fixed-effects model is a variable intercept model which means that there is a different intercept for each country. The country with the maximum intercept is taken as the reference country (frontier) and technical efficiency can be measured by the distance from this maximum. The results indicate that efficiency is positively related to health expenditure per capita, especially at low expenditure.
2.2. Efficiency of R&D policies
David et al. (2000) provide an extensive review of econometric studies over the 1965-2000 period on the effects of publicly-financed R&D expenditure in the private sector at different levels of aggregation. Studies at the meso- and macro levels tend towards complementarity instead of substitution (crowding out) between publicly- and privately-financed R&D-expenditure. Yet, these studies tend to overestimate the complementarity effect since they concentrate on R&D expenditures which include the upward effect (higher wages) due to the crowding out effect. Results based on studies at the micro or plant level are more mitigated. Studies focusing on US data find evidence of a substitution effect while for non US countries, a complementarity effect seems to predominate.
The cross-country study by Guellec and van Pottelsberghe (2003) suggests a complementarity between public funds to support R&D in the private sector. Furthermore, R&D expenditure performed in the public sector, in particular in the defence sector, appears to crowd out private R&D. Building up on this model, Falk and Leo (2006) investigate the effects of different public support channels on the R&D spending in the business sector of 15 Western European countries, putting a focus on the case of Austria. Contrary to Guellec and van Pottelsberghe (2003), they use four-year averages instead of annual data and estimate their approach by using the fixed effects method and the generalized method of moments (GMM) estimator. They conclude that although direct government subsidies to R&D performing firms unfold great leverage effects, the dynamics of output growth as well as the R&D prone high tech structure seem to be more important drivers of the R&D intensity in the business sector. To the best of our knowledge, studies based on non parametric methods and examining the efficiency of R&D policies at the macro level in particular have not been performed yet. Though the studies of Lee and Park (2005) as well as those by Wang and Huang (2007) and Zabala-Iturriagagoitia et al. (2007) are not directly concerned with the assessment of public R&D efficiency, it is worth surveying them since they are three of the few studies at the macro level measuring R&D productivity at the national level by using the DEA method9. Lee and Park (2005) investigate a two inputs (R&D expenditure, average number of researchers) and three outputs (technology balance of receipts, number of scientific and technical journal articles published and number of triadic patent families) framework and cover 27 countries whereas the focus lies on analysing the performance of the Asian states for the period 1994-1998 with their analysis. Lee and Park (2005) state that the objective of R&D lies in increasing outputs rather than decreasing inputs and therefore only apply the output-oriented models. Furthermore, in a second phase the 27 countries are grouped into four clusters by output-specialized efficiency, namely inventors, merchandisers, academicians and duds. The results indicate a very low R&D efficiency level of China, Korea and Taiwan and a high efficiency of Singapore which seems to be due to the high technology balance of receipts –oriented efficiency. The authors also state that Japan will be able to obtain much more outputs even with a slight improvement in R&D efficiency since it possesses a large R&D
cale.
s
Wang and Huang (2007) address the relative efficiency of R&D activities across 30 countries (23 OECD members, 7 are non-OECD economies). They treat R&D capital stocks and manpower as inputs and use patents and academic publication as output measures. Like Herrera and Pang (2005) as well as Afonso et al. (2006) they use Tobit regressions to control for the external environment. The Tobit regressions include the enrolment rate of tertiary education, the PC density and the index of English proficiency as regressors to control for the effects of higher education, PC popularity etc. on R&D efficiency. The estimation results show that an increase in the enrolment rate of tertiary education as well as better English 9 While our study is concerned with the assessment of the efficiency of R&D policies on R&D activities carried
out in the private sector, the papers of Lee and Park (2005) and Wang and Huang (2007) investigate the relationship between firms’ R&D activities and their technological and economic outcomes, while Zabala-Iturriagagoitia et al. (2007) assess the performance of regional innovation systems.
skills of a country’s R&D personnel improve the efficiency of R&D. However, the PC density variable shows no significant result which implies that the popularity of PCs in a country does not contribute substantially to reducing R&D slack directly. Using the DEA approach leads Wang and Huang (2007) to the conclusion that less than one-half of the countries are fully efficient in R&D activities. Zabala-Iturriagagoitia et al. (2007) use the DEA analysis to evaluate the regional innovation performance based on information provided by the European Innovation Scoreboard (EIS) for the years 2002 and 2003. They use several input indicators, namely higher education, lifelong learning, medium/high-tech employment in manufacturing, public R&D expenditure, business R&D expenditure and high-tech patent applications to the European Patent Office (EPO) and as an output measure regional GDP per capita. The results show that the higher the technological level of a region, the greater is the need for system coordination. They are compared with those obtained by using the Revealed Regional Summary Innovation Index (RRSII) index which is recommended by EIS to measure the progress of the EU in innovation activities. The authors show that the use of these two different approaches yield to different results, however, they conclude that different approaches should be seen as complementarities for policy makers to obtain a comprehensive picture of regional innovation systems and to enrich the knowledge base for future policy
ecision-making.
ns) will influence the attempt and desire of a firm to vest in new ideas and technologies.
cash-flow in the United States, the United Kingdom and eland than in other economies.
d
2.3. Determinants of the efficiency of R&D activities and policies
Jaumotte and Pain (2005a) use panel regressions for 20 OECD countries over the period 1982 – 2001 to assess the effects of innovation policies and framework factors on business R&D intensity and patenting. Intuitively, the performance of the aggregate economy, the level of the real interest rates, the development of the financial markets, the degree of regulation and competition as well as the international openness of an economy (see Table 1 for an overview of the variables used in their regressio
in
First of all, macroeconomic factors seem to be clearly important for the understanding of the evolution of business R&D expenditure. R&D activities are sensitive to cyclical conditions as well as to a robust output growth and a low and stable inflation which have a positive influence on the growth rate of the R&D expenditure. To sum it up, investment in R&D is fostered by a stability oriented macroeconomic framework. Jaumotte and Pain (2005b) also highlight the potential sensitivity of R&D expenditures to the availability of external as well as internal finance. Many studies suggest that capital imperfections affect investment in R&D10. Several studies also deal with the sensitivity of R&D expenditure to cash flow in the United States, Japan, the United Kingdom, and a number of countries in the European Union (Hall and van Reenen 2000). However, the results are mixed. To be more precise, R&D appears to be more sensitive to
Ir
Jaumotte and Pain (2005a) also include product and labour market regulations as well as restrictions on inward foreign direct investment in their regressions. They argue that enhanced product market competition can provide incentives to innovate and escape competition. However, this is only possible up to a certain point, after which the prospective rents from innovation begin to reduce. Labour market regulations could constrain the firms’ ability to undertake innovation-driven workplace re-organizations, but could also foster incremental process innovations since there is specialist knowledge in the workforce which has considerable company and occupation-specific experience. According to Jaumotte and Pain (2005c) many cross-country studies of economic growth emphasize the importance of the diffusion of both codified and tacit knowledge across national borders. Nevertheless, the effect of restrictions on inward foreign direct investments is also ambiguous. On the one hand they may slow the rate at which foreign knowledge is brought into national economies and on the other hand they can provide a more favourable environment for future innovators amongst national firms, especially in large economies.
Table 1 Framework conditions on Business R&D
GDP Growth
Consumer price inflation Real interest rate B-index
High level of financial development
Ratio of bank credit plus stock market capitalization to GDP Corporate profits or Profit share of GDP
Indicator of product market regulation Indicator of employment protection legislation Indicator of strength of FDI restrictions Trade openness adjusted for population size Real exchange rate
Ratio of import to weighted domestic final expenditure Ratio of (trade-weighted) foreign R&D stock to GDP Share of hi-tech industries in GDP
Share of scientists and engineers in total employment Index of strength of intellectual property rights R&D expenditures in the non-business sector (flows) Government funding of business sector R&D Business funding of non business R&D Public procurement as % of GDP
Fundamental research as % of total R&D expenditures Defence R&D in % of total R&D expenditures
Another set of important determinants which may influence business R&D are variables dealing with the influence of specific science policies and institutions, e.g. R&D in the non-business sector, direct government subsidies for private sector R&D, support for intellectual property rights, industrial structure, human resources available for science and technology etc. Jaumotte and Pain (2005a) emphasize that there might be some important trade-offs between these factors, which means that some policies lead to the crowding out of the real resources available for R&D in the business sector. The authors also conclude in another paper (2005c) that fiscal incentives can be effective, especially when firms face financial constraints, but their overall impact on innovation appears comparatively small. On average, tax relieves for private R&D are found to provide a stronger stimulus than direct government subsidies.
The strength of intellectual property rights is also an additional factor which could influence R&D and innovation. Jaumotte and Pain (2005b) have already argued that the relationship between the intellectual property rights system, patenting and innovative activity is a complex one. Firms can be encouraged to innovate by stronger intellectual property rights, but equally they can also hinder companies in accessing knowledge and thus deter cumulative innovation processes.
The share of high-tech manufacturing industries (in GDP) as well as the share of scientists and engineers in total employment can also be expected to be positively related to the level of R&D. According to Jaumotte and Pain (2005a, 2005b), differences in the number of scientists may be an important explanation for cross-country differences in R&D. Furthermore, absorptive capacity of an economy could be also affected by the number of scientists.
To briefly review, framework conditions as well as specific science policies and institutions help to support innovation independently and in interaction with each other. Furthermore, Jaumotte and Pain (2005a) conclude that there seems to be a clear evidence of policy trade-offs, in other words policies that stimulate the demand for scientists and engineers will also lead to raising costs for R&D resources, especially in the period where labour supply can adjust.
Afonso and St. Aubyn (2005b), Afonso et al. (2006) and Jaumotte and Pain (2005b) also identify several framework conditions (or environmental variables) for explaining the efficiency of public spending. Among these factors, we can mention the level of education of the population, the competence of the civil servants, the per capita GDP, the strength of the IPR systems, trade openness, and transparency in public policy, civil liberty or political rights. Another approach departs from comparing the estimated efficiency scores between countries relying on performance budgeting techniques and those ones not relying on such techniques. The former may experience better budgetary results (lower debt, deficit, better composition of government expenditures) compared to the other ones. With that respect, Joumard et al. (2004) based on a detailed survey for over two-thirds of OECD countries identify three main areas for action to enhance the effectiveness of public spending: budget process, management practices and the use of market mechanisms in the delivery of public services.
Curristine et al. (2007) investigate the institutional drivers of efficiency in the public sector. By reviewing the literature they figure out that there is indeed evidence that some institutional variables help improving efficiency. Hence, efficiency gains can be obtained by increasing the scale of operations (evidence on this was collected mainly in the education and health sector). Furthermore, functional and political decentralization (i.e. spending responsibility) to sub national governments and human resource practices (e.g. soft aspects of human resource management like employee satisfaction and morale) seem to be beneficial for efficiency. Regarding the impact of ownership, competition and agencification findings were quite inconclusive. Curristine et al. (2007) conclude as well that e-government practices may
reduce time demands which, however, come along with more technical requirements of staff members. Contradictory findings are also found for the impact of workforce diversity and representativeness on efficiency. Assessment of the role of unions in public sector efficiency is also really scarce. Although there is some empirical evidence from the United States which suggests that high levels of unionization constrain flexibility and productivity and that collective bargaining in local governments led to increased municipal expenditures, the impact of unions on efficiency and effectiveness remains unclear. Furthermore, studies conducted in Europe do not find either a positive or negative relationship (Curristine et al. 2007). In terms of attractiveness the authors also point out that the image of the public sector plays an important role as well. To sum it up, except for the first three variables which were clearly identified as key institutional drivers that improve efficiency, there is a lack of empirical evidence of the impact of institutional factors on the aspect of efficiency.
2.4. Conclusion of the literature section
Several of the studies reviewed above used the FDH approach to assess efficiency, e.g. Afonso et al. (2003), Gupta and Verhoven (2001), Clements (2003) as well as Herrera and Pang (2005). However, as Afonso et al. (2003) emphasize this approach is likely to overestimate efficiencies since countries which lie on the production possibility frontier are efficient by definition. Furthermore, public sector policies may be also effected by economies of scale being able to deliver better outcomes. These constraints could be overcome by applying another non-parametric approach, namely DEA, e.g. Afonso et al (2006), Lee and Park (2005), Wang and Huang (2007). However, studies where both methods were conducted, e.g. Afonso and St. Aubyn (2005b) have also shown that results of the two analysis were broadly comparable.
A drawback of using non-parametric approaches is that they do not statistically assess differences across countries. Non-parametric methods show a high sensitivity of the results to sampling variability, to the quality of the data and to the presence of outliers (Afonso et al. 2003). Additionally, the dynamic structure is treated inadequately given the lag between input consumption (public expenditure) and output production, e.g. health and education outcomes or referring to our study business R&D expenditures (Herrera and Pang, 2005). Nevertheless, Data Envelopment Analysis is the preferred estimator for productivity levels if development is likely to vary across countries and scale economies are not constant (van Biesebroeck, 2007). Afonso et al.(2006) as well as Herrera and Pang (2005) conduct Tobit analysis to control for non-discretionary inputs since this is not taken into account by the FDH and DEA method. This seems quite appropriate since such factors may play a relevant role in determining heterogeneity across countries and influence performance and efficiency.
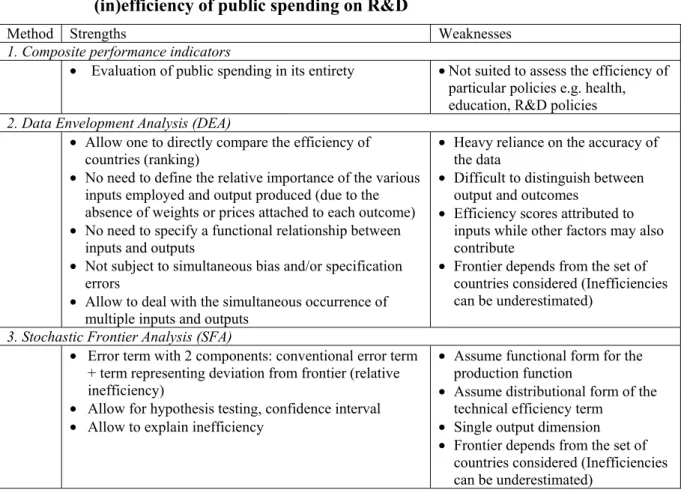
The strengths and the weaknesses of the different methods, namely composite performance indicators, data envelopment analysis and stochastic frontier analysis are shown in Figure 1. In a nutshell, methods based on composite indicators are not well suited to assess the efficiency of particular policies such as public R&D spending. The FDH method does not appear to be the most appropriate technique neither as this method tends to overestimate
efficiencies of countries. The non parametric DEA must be complemented by a Tobit regression analysis to allow for heterogeneity across countries and for examining the role played by environmental non discretionary factors to explain differences in efficiency scores across and within countries. Given the dependency of DEA towards sample composition, outliers or data quality, a sensitiveness analysis should always be carried out in order to assess the robustness of results. SFA allows for hypothesis testing and to explain inefficiencies. Yet this method is quite data demanding since the convergence of the maximum likelihood iterative procedure to perform the efficiency terms requires a quite large number of observations which is not always likely when we use macro economic data over relative short time periods. Finally and more generally, whatever the strengths and weaknesses of these different approaches, any analysis aimed at examining the efficiency of public policies should consider different methods and compare the results obtained.
Figure 1 Strengths and weaknesses of alternative methods for assessing the (in)efficiency of public spending on R&D
Method Strengths Weaknesses
1. Composite performance indicators
• Evaluation of public spending in its entirety •Not suited to assess the efficiency of particular policies e.g. health, education, R&D policies 2. Data Envelopment Analysis (DEA)
• Allow one to directly compare the efficiency of countries (ranking)
• No need to define the relative importance of the various inputs employed and output produced (due to the absence of weights or prices attached to each outcome) • No need to specify a functional relationship between
inputs and outputs
• Not subject to simultaneous bias and/or specification errors
• Allow to deal with the simultaneous occurrence of multiple inputs and outputs
• Heavy reliance on the accuracy of the data
• Difficult to distinguish between output and outcomes
• Efficiency scores attributed to inputs while other factors may also contribute
• Frontier depends from the set of countries considered (Inefficiencies can be underestimated)
3. Stochastic Frontier Analysis (SFA)
• Error term with 2 components: conventional error term + term representing deviation from frontier (relative inefficiency)
• Allow for hypothesis testing, confidence interval • Allow to explain inefficiency
• Assume functional form for the production function
• Assume distributional form of the technical efficiency term
• Single output dimension • Frontier depends from the set of
countries considered (Inefficiencies can be underestimated)
3. Efficiency and R&D: Some concepts and issues
The assessment of the efficiency and effectiveness of government expenditures is inherently difficult. The studies in the economic literature dealing with these questions are limited and conceptual and measurement issues are important. To begin with, it seems useful to clearly define the concepts of economic efficiency and effectiveness. Conceptual issues in assessing efficiency in general and efficiency of public R&D in particular are then discussed.
3.1. Input, output, outcome, efficiency and effectiveness
Since the seminal work of Farrell (1957), the term ‘efficiency’ has been extensively used in economics and refers to the optimal use of resources in production, i.e. producing the maximum quantity of output from a given quantity of input (output-oriented measure), or alternatively producing a given output with minimum quantities of inputs (input-oriented measure).
The concept of efficiency can be extended to the case where several inputs are used to generate multiple outputs. In this case, ‘technical efficiency’ is attained when the maximum amount of output is produced from a given amount of inputs or conversely a given amount of output (services) can be produced (delivered) from minimum quantities of inputs. In this case the entity producing the output is said to be technically efficient and operates on its production frontier. The optimal mix of inputs, given input prices, is obtained when the costs to produce a given amount of output are minimized. This situation refers to ‘allocative efficiency’. It is also common to use the term ‘overall efficiency’ which encompasses both technical and allocative efficiencies.
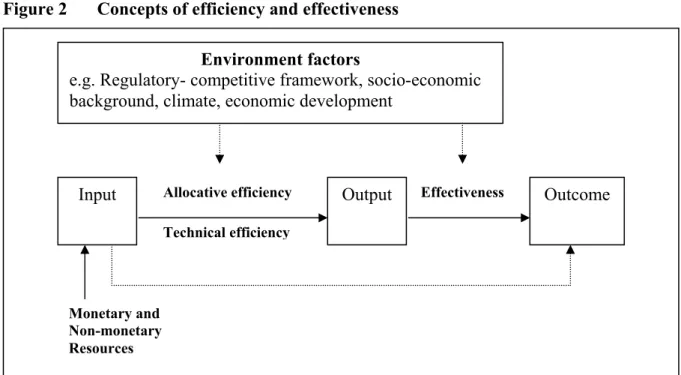
Besides efficiency, it is also common in economics to assess the effectiveness of the production or provision of public services (See Figure 2). The difference between these two terms is not always clear and many authors use them in an interchangeable way. According to Hatry (1978: p. 28), “efficiency indicates the extent to which the government produces a given output with the least possible use of resources. Effectiveness indicates the amount of end product, the real service to the public that the government is providing. Effectiveness encompasses the concept of quality and level of service provided.” Note that as illustrated in Figure 1, both efficiency and effectiveness are affected by environment factors or framework conditions. In order to better grasp the differences between these concepts, it is helpful to introduce the concept of input, output and outcomes. Referring to the example of Afonso et al. (2006: p. 15), “the output of educational spending may be school enrolments, or number of students completing a grade. The outputs of health expenditure may be the number of operations performed or days spent in a hospital bed. However, the outcomes should be based on how much students learned and how many patients got well enough to return to a productive life”.
Figure 2 Concepts of efficiency and effectiveness
Technical efficiency
Input Allocative efficiency Output Effectiveness Outcome
Monetary and Non-monetary Resources
Environment factors
e.g. Regulatory- competitive framework, socio-economic background, climate, economic development
Source: Mandl and Ilzkovitz (2007).
In the case of R&D activities, the inputs refer to the main policy instruments governments generally implement to stimulate investment in R&D in activities in both the public and private sectors. While there have been many attempts to classify the different policy instruments that affect R&D and innovation-related activities11, governments in general rely heavily on a small group of instruments which can be classified into direct policy measures and indirect support to R&D activities12. As regards the former, it is common to operate a distinction between three main categories of instruments, namely grants, subsidies and loans, public procurements as well as public funding of research performed in higher education institutions, in particular universities, and public research and technology organizations13. Indirect fiscal measures to provide incentives to firms to invest more in R&D activities mainly consist in R&D tax credit. A main difference between tax incentives and direct subsidies is that the former reduces the marginal cost of R&D while the latter increases its private marginal rate of return (David et al., 2000). Another difference rests in the fact that R&D tax credits does not affect the choice of research projects by firms which is not the case
11 “The range of policy instruments that affect R&D activities is vast and policy design is complicated by their
number, diversity and potential to interact both positively and negatively. Instruments range from highly targeted mechanisms that provide direct financial support to individual organizations to perform R&D, to broad changes in the legislative and regulatory environments of firms which can and do affect a multitude of business activities, including those related to R&D. Lying in between these R&D specific mechanisms and broader measures that affect the general business milieu are instruments that differ along many other dimensions. Some measures involve the direct transfer of funds from the public purse to private organizations, while measures such as R&D tax incentives are more indirect in that they involve the state forsaking income rather than increasing direct expenditure on R&D. Other measures are aimed at innovation-related activities other than R&D, though many seek to enhance the commercialization of R&D via improved links between R&D performing units and productive units, e.g. between universities and industry” (European Commission, 2003d: p. 31).
12 See Appendix 3 for a more detailed picture.
13 In practice, the distinction between direct subsidies and public procurement of R&D services is not easy to
operate since it is difficult if not impossible to distinguish between the channels through which subsidies are transferred.
for direct subsidies or grants since these funds are distributed by the government for specific projects in certain research areas.
The new knowledge generated in the public sector, typically the research output of universities and or public research facilities, is also considered to affect R&D activities of firms in the private sector. Indeed the output of this kind of research of a more fundamental nature and which is basically publicly funded are at the source of important and positive spillover effects for the R&D activities carried out in the private sector. Indeed, the outcomes of publicly funded R&D performed in public research institutes or higher education institutions may in turn be used by private agents in their own applied research.
In a nutshell, these different inputs affect R&D activities either by lowering the costs of doing R&D or by increasing the opportunity to engage in new research projects. Therefore, it is common to consider as the direct output of the policy intervention and the public funding of R&D in the public sector, the additional R&D activities induced by these inputs and performed by private companies. In terms of outcomes, the ultimate goal of R&D policy instruments is to help firms to improve profits and grow by creating new high value-added products, processes and services. In the literature of the economics of innovation and technology change, these outcomes are usually measured by different variables such as the number of patents, the number of innovations (product or process innovation), the share of sales due to innovations, the job creation, the growth of export or of output, changes in total factor productivity or profit increases (Cincera 1998).
As regard the determinants affecting the efficiency (and effectiveness) of public R&D measures, as the review of the literature of the previous section indicates, various indicators can be considered among which framework conditions or environmental factors affecting the business milieu and the R&D conducted as well as institutional determinants including indicators of budgetary practices reflecting the quality of internal governance, public administration, e.g. composite indicators capturing corruption, red tape and shadow economy). To this end, a distinction can be made between two components of the overall efficiency. First, the business sector efficiency, i.e. the efficiency with which the private sector uses R&D public support and, second, the administrative or institutional efficiency, i.e. the efficient management practices in the public sector. In addition, public procurement can also be considered as an environment factor affecting the efficiency of public spending.
Finally, it should be noted that in this study, the stress is put on a better understanding of the relations between R&D inputs and outputs (efficiency). Therefore the study has to be viewed as a first step of the analysis of the effects (or the impact) of R&D activities on firms economic performance, e.g. output or TFP growth (effectiveness).
3.2. Assessing efficiency
As said before, economists are concerned about the efficient use of scarce resources, in particular those regarding the spending and taxing activities of governments. Following the idea that, at a given input, the greater the output, the more efficient an activity is, the efficiency of public expenditures to support R&D can be measured by comparing the amount spent (input or cost) with the benefits (output or outcomes) of the public expenditure or supporting scheme. Note that in this study, we will stick to the generally used concepts of input, output and efficiency.
Figure 3 Efficiency frontier y
optimal output frontier A
B
observed output
0 x
The difference between the output, i.e. the level of (additional) private R&D induced from public R&D, and the costs, i.e. the amount spent on the supporting measure (tax and subsidy measures for instance), can then be compared across countries. For instance if two countries A and B experience the same level of public expenditures, but for one country, A for instance, the gap between these expenses and the benefits is higher, than this country can be defined as more efficient than the other one (see Figure 3). This concept allows one to assess the level of efficiency (and changes in these levels) of the different Member States with regards to their R&D policy instruments and subsequent innovation performance.
As emphasized by Wadhwa et al. (2005), one advantage of using DEA as compared to other methods is that it identifies peers for inefficient units. A peer is a Decision Making Unit (DMU), a country in our case, which lies on the efficiency frontier and with similar combination of inputs as that of an inefficient country14. Hence the identification of country peer groups allows to better compare countries' performances and to formulate more specific country recommendations on how to improve the efficiency. Countries A and A’ in the example illustrated in Figure 4 lie on the efficiency frontier and represent the peer group for country B as they are closest to it in terms of the combination of inputs.
14Quoting the authors, “Where two or more of these units act as peers for an efficient unit, they provide a peer group for the inefficient unit. The peer group is also known as the reference set of an inefficient unit. The characteristics of the units in the reference set provide the targets for the inefficient units to work towards”.
Figure 4 Peer group and efficiency frontier
3.3. Issues in assessing the efficiency of public policies in general and R&D in particular
Note that the framework discussed in the previous section for measuring the efficiency of public spending raises a certain number of measurement issues. These issues can be general to the assessment of any public expenditure or specific to policies aimed at supporting R&D activities.
As stressed by Afonso et al. (2006), higher public spending requires higher tax revenues which can be obtained only at progressively higher marginal costs given dead weight, administrative, compliance, opportunity and fixed costs of running a government. Then, opportunity costs15 and fixed costs associated with the government taxing activities tend to underestimate the costs of public spending activities.
Afonso et al. (2006) identify two other sources of inefficiencies of public expenditure. The first one, which they call ‘efficiency with wrong goals’ refers to the case where a government delivers efficiently in a technical sense certain services, e.g. public defence, but in a proportion which compared to other services, e.g. education, may be not efficient from a social point of view. The second source of inefficiency refers to a situation where public funds are used again in an efficient way but the budget is distorted towards the specific benefits of special pressure groups, higher wages which are not accompanied by higher productivity performance or corruption and X-inefficiency factors.
Other measurement issues still need to be mentioned. The efficiency and outcomes of public spending also depend on different environmental factors or framework conditions shaped by the economy or other public policies. It is therefore important to control for such external factors in the assessment exercise. Different methods can be implemented to address this question. These methods are discussed in the Section 4.
15 For instance the rental value of government-owned assets such as buildings, land and forest (Afonso et al.,