Educational Leadership Faculty Publications Department of Educational Leadership
Spring 2014
Value Added Methods: Moving from Univariate to
Multivariate Criteria
David Newman Florida Atlantic University Isadore Newman
Florida International University Carolyn Ridenour
University of Dayton, [email protected] Jennifer Morales
Florida International University
Follow this and additional works at:https://ecommons.udayton.edu/eda_fac_pub
Part of theEducational Assessment, Evaluation, and Research Commons, and theEducational Leadership Commons
This Article is brought to you for free and open access by the Department of Educational Leadership at eCommons. It has been accepted for inclusion in Educational Leadership Faculty Publications by an authorized administrator of eCommons. For more information, please contact
[email protected], [email protected].
eCommons Citation
Newman, David; Newman, Isadore; Ridenour, Carolyn; and Morales, Jennifer, "Value Added Methods: Moving from Univariate to Multivariate Criteria" (2014).Educational Leadership Faculty Publications. 119.
Spring and Summer 2014 99 Value Added Methods: Moving from Univariate to Multivariate Criteria
David Newman Florida Atlantic University
Isadore Newman
Florida International University Carolyn Ridenour University of Dayton
Jennifer Morales
Florida International University
Correspondence related to this article should be directed to Dr. David Newman at [email protected]
Abstract
The authors describe five value-added methods (VAM) used in school assessment as the backdrop to their main thesis. Then they review the assumptions underlying measurement and evaluation, the foundation of all assessment systems, including value-added. They discuss the traditional criterion variable used in VAM: a standardized test score. Next, they challenge the univariate assumptions of VAMs, and argue that a multivariate paradigm of VAM is more advantageous for educators and stakeholders. Finally they describe a potential scenario whereby a multivariate VAM might be implemented.
Political pressure for accountability continues to generate support for value added models to measure the effects of public schools (Chetty, Friedman, & Rockoff, 2011; Papay, 2011) both in the USA and across the globe (Timmermans, Doolaard, & de Wolf, 2011). As a result, value added models increasingly generate scrutiny by both researchers and policymakers (Briggs & Weeks, 2011; Glazerman, Loeb, Goldhaber, Staiger, Raudenbush, & Whitehurst, 2010; Jerald, 2009; van de Grift, 2009; Yeh, 2012). Previous initiatives like No Child Left Behind (2001) and now Race to the Top, School Improvement Grants, and the Teacher Incentive Funds, require schools and teachers to meet AYP (Annual Yearly Progress). This was an attempt to quantify the building/district subgroups’ success in meeting the current year’s goal toward all children being proficient in math and reading by 2014. However, policymakers are beginning to back off that goal. Nineteen states have had the requirements waived, so far, on the condition that each of those states will develop credible alternative assessment plans (Perez-Pena, 2012). Strong alternative plans at the state level might incorporate value added even more enthusiastically as state level bureaucrats attempt to earn the waiver.
It is likely, therefore, that value added models will remain an important form of accountability. At present, measures of outcomes are required by student subgroup (socioeconomic status, ethnicity, special needs). They do not, however, indicate what teacher practices work in
generating those outcomes. In other words, AYP does not identify which teachers were effective and which teachers were not effective in contributing to student growth. Teacher effectiveness is directly related to student success and subsequent school / district success. Using student test
Spring and Summer 2014 100 scores to assess teacher effectiveness, however, is one of the most controversial of educational evaluations (Caillier, 2010; Hill, Kapitula, & Umland, 2011; Sanders & Horn, 1994).
Many schools and districts have begun to use value added scores in determining teacher
effectiveness. Value-added scores (VAS) represent student growth, attributed to a specific time, agent or experience (Chetty, Friedman, & Rockoff, 2011; Gong, 2006). VAS are based on student achievement scores over time. The Department of Education’s Race to the Top initiative urges states and districts to uses this summative, high risk, evaluation to identify teachers that they want to hirer, lay off, promote, or give tenure (Goldhaber, 2010). These polices have resulted in districts using results bases accountability systems (Anderson, 2005; Murphy 2012). However, some schools have used the value added modeling in other more beneficial ways. These schools and districts have moved away from a onetime summative, high risk, evaluation of teachers and started implementing formative, low risk, evaluations. By using bench mark scores throughout the year schools have been able to identify which practices (time, agent and/or experience) are effective and which ones are not. Student assessment (and consequently student growth) can be used as a tool for educational improvement. By identifying where teachers are weak, professional development can be designed to target specific teacher needs. Combining the professional development with the best practices identified by the data, schools are better able to implement these practices for improving student growth and thus leading to more effective schools (Burnett, Cushing, Bivona, 2012).
Calculation of VAS seems straightforward because they are based on student growth; but, there is not one standardized value-added model (VAM) that policy makers, educators, and
educational researchers can agree upon. In fact the models vary widely. Individual models attempt to correct for the weaknesses of other models. All strive to use student growth to calculate teacher/school/district effectiveness. The challenge is to attempt to control for all possible variables that covary with teacher instruction. One of the major criticisms of VAMs is their unidimensional limitation. In other words, none of the VAMs are multi-dimensional, i.e., incorporate more than one outcome measure: change in student test scores.
Purpose
The purpose of this paper is to (1) discuss five value-added methods (VAM) used in school assessment, (2) review the assumptions underlying measurement and evaluation, (3) discuss options for the criterion variable and how the criterion variable is selected, (4) challenge the univariate assumptions of VAMs, and (5) argue that a multivariate paradigm of VAM is more consistent with the principles of good measurement, more helpful to accountability purposes, and more likely to increase the meaning of results for educators. Regarding this fifth purpose, we extend one of the conclusions of Timmerman et al. (2011) in this journal, i.e., that the
Netherlands school system, among others, might include multiple outcomes that go beyond only cognitive measures. In our discussion, we also propose ways that a school district might
implement such a plan.
Spring and Summer 2014 101 In A Review of Value-Added Models Hibpshman (2004) reviewed four of the most common value added models for the Kentucky Education Professional Standards Board. These four basic models are discussed next.
In Hibpshman’s (2004) review, the first of the four most common models is the fixed effects model (FEM) where teachers, classes, and schools are treated as fixed effects. Fixed effects means that the variable’s error term is based on the assumption that the independent variable has no variability and that it is not a sample of a larger population. The advantage of this model is simplicity. One can think of this as a simple fixed effects analysis of variance model, where the dependent variable is the state test and the independent variable could be teachers, classes or schools. This VAM tends to answer research questions pertaining to significant growth of students that can be accounted for by teachers or schools. The FEM does not assume that the teachers or school are a sample of a population of teachers or schools, but, instead, assumes that the growth is for these specific teachers and schools.
The second model is a simple fixed effects model (SFEM). It is different from the FEM. In this model, the effect size of one building in a district is analyzed and compared to another building in the same district. The SFEM model does not employ data on confounding factors and is intuitive in nature. The research question answered by this model focuses on the effect from differences between schools without taking into account differences in teachers or students. The third model is the layered mixed effects model (LMEM), the model used by Sanders and Horn (1994, 1998) in the TVAAS. The LMEM uses student change scores with randomized school effect. A randomized effect means that the variable’s error term is based on the assumption that the independent variable is a sample from a population. This model assumes that it accounts for confounding variables because these variables are actually nested within each student and are therefore controlled for by multiple measurements of each student. The research question that this type of model answers is very similar to the FEM except that it treats schools as random. The LMEM also looks at layers, such as a school layer or a classroom layer.
The fourth VAM structure is the hierarchical linear model (HLM), which also assumes a random school effect. The HLM allows for one to control for covariates at both the school level and the student level. In addition, HLM also tends to assume random effects at the district level, teacher level, and student level. Like the LMEM, the HLM answers the question of school or teacher effect on student growth, but instead of treating only the school as random it can also treat teachers and students as random. This model allows the researchers to examine and control the relationship between nested groups. For instance, students are nested within classrooms, teachers are nested within schools, and schools are nested within districts.
A fifth type of VAM, constructed by The Reading First Ohio Center (RFOC), is an addition to those in Hibpshman’s (2004) review. Including that here adds to the background discussion on VAMs. Similar to a fixed-effects model as discussed above, but, instead of focusing on the effects at teacher level it focuses on the effects at a program level.
RFOC was interested in the programmatic effects that were results of the professional
Spring and Summer 2014 102 separated into three groups: At Risk, Some Risk and Low Risk groups. These designations were assigned to students based on their most recent Dynamic Indicators of Basic Early Literacy Skills scores (DIBELS) (Good & Kaminski, 2002). Growth was simply calculated as the difference between the two most recent DIBELS scores. To get the clearest picture of how effective the program was, this information was disaggregated by grade, by schools, by district typology (urban, suburban, and rural) and by race. This resulted in the following graphs.
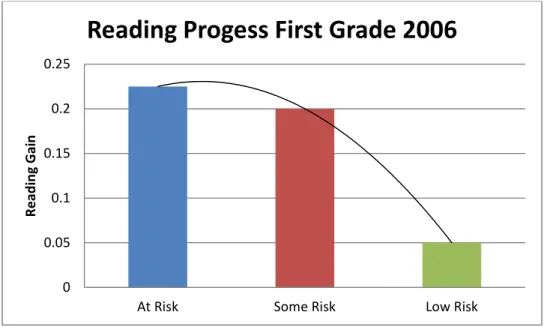
Figure 1 shows the typical shed pattern, indicating that the At Risk group has made the largest gain in reading scores. This would suggest that the RFOC money focusing on interventions for the At Risk group was well spent. Figure 2 shows a typical tepee pattern. In this figure the greatest gain in DIBELS score is with the Some Risk students. The At Risk and Low Risk students show little gain. This indicates that the teachers are teaching the curriculum but may not be differentiating based on student needs, or that the intervention support might not have been structured effectively. Figure 3 shows an upward shed pattern, the reverse of the pattern shown for the At-Risk group.
Assumptions Underlying Measurement and Evaluation
\The five value added models provide some background that provides a common understanding on which we can begin to argue for moving VAM from its limited unidimensional structure to a more beneficial multi-dimensional structure. Before making that argument, however, we need to lay out our perspectives on measurement, testing, and validity to complete that foundational understanding.
Test validity refers to the “meaningfulness and appropriateness of the uses and interpretation…of assessment results” (Linn & Miller, 2005, p. 100). Tests are not valid in isolation; they are valid for particular purposes. To assess student learning or growth with paper/pencil tests, one needs an entire battery of tests, not a single measure. At least three arguments support this need. First, one test has insufficient validity to answer the question about a student’s academic performance. One “principle of measurement validation,” according to Nitko (2004) is that only “after
combining several types of evidence” can the researcher judge it in relation to some intended use (p. 56). Second, a core tenet in measurement is the content representativeness of the domain being measured (Nitko, 2004). In other words, is whatever is being measured representative of the performance domain? For educational accountability purposes, the entire domain of what’s being measured must be considered. Third, standardized tests that are used for assessing school effectiveness are valid for drawing group conclusions but not valid for drawing conclusions about individuals. For individual students, standardized tests may be effective screening devices with scores becoming the basis for hypotheses about a student’s achievement. The hypotheses are pursued by administering other tests to confirm or disconfirm the results of the group tests. A gap separates valid measurement practice and the reality of contemporary testing programs in schools. While providing a battery of tests, rather than a single test, is necessary from a
psychometric perspective, it is rarely if ever implemented in schools, whose public purposes are sometimes antithetical to good measurement. Standardized test scores become measures of student performance for both group and individual student purposes. Parents receive summary documents about their children’s academic performance on standardized tests. There is no
Spring and Summer 2014 103 similar standardized test score that represents other types of social or emotional learning that the student has experienced over a year. School reform efforts over at least the past two decades that have resulted in state and federal laws mandating that schools be accountable for the learning of all children (despite demographic differences); however, the academic achievement test is the only required measure of that learning. Therefore, schools have no incentives to use batteries of tests. The subject matter test score stands.
For example, if a student fails the Ohio Achievement Assessments (OAA) in math but has a record of earning the highest grades in all math classes at his/her home school, that discrepancy is not explored when reporting OAA results. No further study of the discrepancy between these two measures of student’s performance is carried out. Likewise, a student who passes the same OAA in math with flying colors yet earns Ds and Fs in his/her home school math classes is unlikely to be studied further. Parents, guidance counselors and teachers cannot explain the differences without further analysis. However, for accountability purposes, the standardized test score stands.
The Criterion Variable in Value Added Models
The VAMs reviewed so far use a test score, or the difference between two test scores, as the dependent or criterion variable in calculating the value-added score. Most VAMs include some combination of school factors and/or non-school factors as independent variables. School factors are those that schools can control, such as class size or teacher salary. Non-school factors are those that schools cannot control, such as ethnicity or socioeconomic status of the students. How valid is the single test score, the criterion variable, in representing a student’s growth? To
reiterate, standardized test scores are the sole measure of student achievement.
Standardized test scores do not capture growth in other school or non-school areas such as self-efficacy, organizational skills, critical thinking, and emotional skills. However, schools target such skills in their mission statements and strategic plans. Buildings implement programs to address these school and non-school domains of learning. This being the case, researchers admit that adequate assessment of student growth requires a battery of tests (not just one test). As a result, researchers are necessarily led to multivariate analysis to quantify student growth. None of the VAMs discussed so far use multivariate analysis.
Considering Multiple Criterion Variables in a Value Added Model: One Example Statistical analysis is a way of partitioning variance to look at it more completely, to better understand the variability in the dependent variable. The problem with all of the VAMs is that they are unidimensional. Every VAM derives its impact or its effect as measured against one specific test score. The test might be the Ohio Achievement Assessments, or in the case of RFOC, the DIBELS, but all VAMs are based on scores from one test. This limits the scope of the generalizability of these models. A multivariate technique might provide a more
comprehensive and accurate model. For instance, if one includes other factors such as grade point average, a measure of portfolio presentation, emotional stability, and skills in critical thinking, there would no longer be one factor (test score) but as many as four or more factors that could then be utilized to create a much more comprehensive and representative value-added
Spring and Summer 2014 104 score. Burnett et al. (2012) stated that since teaching by its nature is multifaceted and therefore a multiple measure approach would better capture the teacher’s true effectiveness. The Measures of Effective Teaching project found that it was a combination of teacher observations, student feedback, and the VAS that provided the indicator of teacher effectiveness (Kane & Staiger, 2012).
This multivariate conceptualization can be expressed symbolically using a general linear model (McNeill, Newman & Fraas, 2012). For discussion purposes, consider adding an index, called an “affective index,” as a criterion variable (not a predictor variable) to the calculation of value-added scores for teachers. In this multivariate approach Affective Index could represent a number of the non-school variables previously discussed. It could also include some school variables. For sake of simplicity, we add only one variable in this example.
Using LMEM (Field, 2005; Raudenbush & Bryk, 2002, Singer & Willett, 2003), the sequence of test scores for a student who is first tested in 1997 in the third grade is assumed to satisfy the following equations for testing between 1997 and 1999, from grade 3 to grade 5:
Y3 97 + AffectiveIndex 3 97 = b 3 97 + u 3 97 + e 3 97 Y4 98 + AffectiveIndex 4 98 = b 4 98 + u 3 97 + u 4 98 + e 4 98 Y5 99 + AffectiveIndex 5 99 = b 5 99 + u 3 97 + u 4 98 + u 5 99 + e 5 99
Where Ykt = test score in year t, grade k, Affective Indexkt = those variables determined relevant
for determining a teacher’s value-added score for year i, bkt = district mean test score in year t,
grade k, ukt = contribution of the grade k teacher to the year u test score and ekt = student level
components in year t, grade k. Building and classroom index are omitted here for simplicity (Ballou, Sanders, & Wright, 2004).
The teacher value-added scores for one year would then be calculated as follows: (Y4 98 + AffectiveIndex 4 98 ) – (Y 3 97 + AffectiveIndex 3 97 ) = (b 4 98 + u 4 98 + u 3 97 + e 4 98 ) – (b 3 97 + u 3 97 + e 3 97 ) Since u973 - u973 = 0, u4 98 = (Y 4 98 – Y 3 97 ) – (AffectiveIndex 4 98 – AffectiveIndex 3 97 ) – (b 4 98 – b 3 97 ) – (e 4 98 – e 3 97 )
The teacher effect (u) is what remains of the year-to-year gain after removing the district mean gain (b), the Affective Index gain, and the contribution of factors unique to the student (e). If we think of (Y4 98 – Y 3 97 ) – (AffectiveIndex 4 98 – AffectiveIndex 3 97 ) – (b 4 98 – b 3 97 )
As the residual gain at the student level, quantifying teacher effects is a matter of determining how much of the residual gain to attribute to student specific factors, to the Affective Index, to the influence of the teacher or to school factors. Adding the Affective Index to the model will incorporate into the teacher effectiveness score a measure of student growth identified through
Spring and Summer 2014 105 ways other than a single test score. It will more accurately reflect all the skills the classroom teacher addresses on a daily basis.
Options for Criterion Variables
Including the one factor, Affective Index, in the above multivariate approach to VAM is a simple example to demonstrate how a multivariate value-added model might be developed. The
Affective Index could be a number of factors or constructs, both school and non-school. Many examples support the need to move to multidimensional VAM. First, Bandura’s (1993) findings that students’ perceived self-efficacy influences cognitive, motivational, affective, and selection processes could be a first step in determining the factors or constructs to include as criteria. Bandura states that “children’s intellectual development cannot be isolated from the social relations within which it is imbedded or from its social consequences. It must be analyzed from a sociocultural perspective.” (p. 137-138). In addition he explores the effect of teacher efficacy on student cognitive development, which may be quite important in student growth. Another example comes from Bar-On and Parker (2000). They document the importance of classroom experiences in contributing to student achievement. Further evidence comes from the
conclusions of Hubbard and Datnow’s (2005) ethnographic studies of single sex schools in California. Educators, they surmised, must “make emotional and social as well as academic knowledge explicit” (p. 128). Emotional and social learning goals are integral to school success. These and other research findings suggest student behaviors and teacher behaviors that impact cognitive development and that would produce the emergence of additional criterion variables that might be used in a multivariate approach to VAMs.
The most popular VAM, TVAAS, proposes that the school and non-school factors are accounted for in the VAM because the student is used as his/her own control. TVAAS does include the teacher effect in the model; in fact it is a persistent teacher effect over time. The reason more school/non-school effects are not included is that it is unlikely that the school/non-school factors for a child will change much over a year. It is assumed that the school/non-school effects are represented in the student level effects.
Franco (2006) analyzed VAS from Ohio (TVAAS model) to study their relationships among school/non-school factors. Correlation tables quantified relationships that exist between the independent variables (school/non-school factors) and dependent variables (value-added scores). For example, correlations for each independent variable, say percent of students with free and reduced lunch (%FRL), were determined for grade 3 reading value-added scores, for grade 3 mathematics value-added scores. Highly correlated factors were then used in a GLM to further study the relationships. Analyses revealed that some non-school and school factors do have significant relationships with the VAS. VAMs that do not include school/non-school factors may not be accurately representing student growth.
How might the vision of a multidimensional value added model be put into practice? When a school district is convinced that there is not one criterion variable, but many criterion variables, one scenario might suggest the following process. For example, the superintendent of the district could form a committee representative of all major stakeholders of the district. The committee might represent, for example, students, teachers, administrators, curriculum personnel, parents,
Spring and Summer 2014 106 as well as stakeholders in the business, medical, legal, clerical, and social services sectors.
Conducting focus groups with these stakeholders, a list of important criterion variables could be drawn up as the groups attempt to identify the important outcomes of their schools. Having accomplished that, they then generate the estimates (or measures) of each of those outcomes. As has been discussed earlier, criterion variables (educational outcomes) such as emotional
intelligence, social skills, and self-efficacy, teacher-made exams, GPA, are possibilities. Once these variables are identified, student data on these measures form a dataset. The dataset could be factor analyzed to produce orthogonal constructs that represent the outcomes identified by focus groups. Because these dimensions are orthogonal, they are zero-correlated. The
stakeholder focus group could weight each factor based on its importance to the community they represent. Perhaps factor 1, for example, is judged as twice as important as factor 2. Each factor is weighted relative to other factors. Next, a value added assessment is calculated on each factor separately. Each value added calculation is weighted according to the educational community’s judgment. Combining these weighted scores would produce a composite value added score. To summarize what has been accomplished in this scenario: the school district has moved from a value added calculation using one criterion (standardized test scores) to a value added calculation using multiple criterion variables that have been identified and weighted by a group of
stakeholders as the criteria they most highly value. The value added results are specific to this district because the criterion variables were locally identified and measured. Such a scenario increases the validity of the value added assessment tool to more thoroughly measure the educational outcomes of that district.
Summary
This proposal to consider a multivariate model for VAMs does not mean that VAMs are not functional, but that development of VAMs should be expanded to reflect what research has shown about teachers’ impact on student progress. A test score alone does not accurately reflect student growth that could be a result of teacher/school or building interactions. In some districts, the VAS are incorporated into high stakes decisions such as teacher performance evaluation, salary increases or even restructuring of buildings. Educators from the classroom level to the district level criticize such high stakes decisions based on VAS because VAS fail to capture all facets of student growth. Educational researchers agree that VAS are not appropriate tools for high stakes decisions.
Academic intelligence is important for student success in further education and employment. Moreover, social and emotional intelligence, i.e., EQi (Bar-On, 2000), is also important for students to become contributing members of our society. Matthews, Zeidner, and Roberts (2002) explain that academic intelligence is essential to classroom success but everyday
problem-solving requires practical intelligence as well. Measurement methodology requires that educators include other intelligences in value-added models that schools use to quantify school effects. Specific building or district accountability ratings are used by the public to compare building or district effectiveness. As long as effectiveness ratings are based on a single test score, such comparisons may not be appropriate. For example, schools vary widely from district to district. Social contexts produce wide differences in students’ lived experiences. Among other dynamics, schools vary widely in levels of parent involvement and financial support. The EQi’s differ for
Spring and Summer 2014 107 the student and community of learners in different types of districts. For accountability
purposes, a VAS that incorporates more evidence about the students overall academic, social and emotional growth will be more helpful when determining teacher, building or district
effectiveness than a VAS that incorporates only one test score.
Work should be done to determine what criterion variables should be added to the standardized test scores in calculating a more accurate and more valid value-added score. VAS that reflect the overall student growth and not just the academic test score growth will have more meaning to educators as well as to stakeholders.
References
Anderson, J. A., (2005). Accountability in education. Paris: International Institute for Educational Planning, & The International Academy of Education. Retrieved from http://www.unesco.org/iiep/PDF/Edpol1.pdf
Ballou, D., Sanders, W., Wright, P. (2004). Controlling for student background in value-added assessment of teachers. Journal of Educational and Behavioral Statistics, 29(1) 2004,
131-134.
Bandura, A. (1993). Perceived self-efficacy in cognitive development and functioning.
Educational Psychologist, 28(2), 117-148.
Bar-On, R., & Parker, J. D. A. (Eds.). (2000). The handbook of emotional intelligence: Theory, development, assessment, and application at home, school and in the workplace. San Francisco: John Wiley & Sons.
Briggs, D. C., & Weeks, J. P. (2011). The persistence of school-level value-added. Journal of Educational and Behavioral Statistics, 36(5), 616-637.
Burnett, A., Cushing, E., & Bivona, L. (2012). Use of multiple measures for performance-based compensation.Washington, DC: Center for Educator Compensation Reform. Retrieved
September 12, 2013, from http://0-cecr.ed.gov.opac.acc.msmc.edu/pdfs/CECR_Multi-pleMeasures.pdf
Caillier, J. (2010). Paying teachers according to student achievement: Questions regarding pay- for-performance models in public education. Clearing House, 83(2), 58-61.
Chetty, R., Friedman, J. N., & Rockoff, J. E. (2011). The long-term impacts of teachers: Teacher value-added and student outcomes in adulthood: Executive Summary. Washington DC: National Bureau of Economic Research Working Paper No. 17699.
Spring and Summer 2014 108 Franco, M. S. (2006). The relationships among building level school/non-school factors and value-added scores in Ohio. (Doctoral dissertation, University of Cincinnati, 2006). Embargoed by University of Cincinnati.
Glazerman, L., Loeb, S., Goldhaber, D., Staiger,D., Raudenbush, S., & Whitehurst, G. (2010).
Evaluating teachers: The important role of value-added. Washington, DC: The Brown Center on Education at the Brookings Institute, 1-12.
Gong, B (2006, January 25). Considering student growth for school accountability decisions: In the context of the NCLB growth models pilot. Retrieved February 20, 2006 from
http://www.ccsso.org/content/pdfs/StudentGrowthGong012506.ppt
Goldhaber, D. (2010). When the Stakes Are High, Can We Rely on Value-Added?: Exploring the Use of Value-Added Models to Inform Teacher Workforce Decisions. Center for American Progress. Retrieved on September 12, 2013 from
http://cdn.americanprogress.org/wpcontent/uploads/issues/2010/12/pdf/vam.pdf
Good, R. H., & Kaminski, R. A. (2002). DIBELS oral reading passages for first through third grades (Technical Report No. 10). Eugene, OR: University of Oregon.
Hibpshman, T. (2004). A review of value-added models. Frankfort, KY: Kentucky EducationProfessional Standards Board.
Hill, H. C., Kapitula, L., & Umland, K. (2011). A validity argument approach to evaluating teacher value-added scores. American Educational Research Journal, 48(3), 794-831.
Hubbard, L., & Datnow, A. (2005). Do single-sex schools improve the education of low-income and minority students? An investigation of California’s public single-gender academies.
Anthropology and Education Quarterly, 36(2), 115-131.
Jerald, C. (2009). The value of value added data. Educational Trust, 1-7.
Kane, T.J., Staiger, D.O. (2012). Gathering feedback for teaching: Combining high-quality observations with student survey and achievement gains. Seattle, WA: Bill & Melinda Gates Foundation. Retrieved June, 6 2013. From http://www.metproject.org/ downloads/MET_ Gathering_ Feedback_Practioner_Brief.pdf
Linn, R. L., & Miller, M. D. (2005). Measurement and assessment in teaching, 9th ed. Upper Saddle River, NJ: Pearson.
Matthews, G., Zeidner, M., & Roberts, R. D. (2002). Emotional Intelligence: Science and Myth.
Boston: Massachusetts Institute of Technology.
McNeil, K. A., Newman, I., & Fraas, J. (2012). Designing general linear models to test research hypotheses. Lanham, MD: University Press of America.
Spring and Summer 2014 109 Murphy, D. (2012). Where is the Value in Value-Added Modeling? [White paper]. Retrieved October 15, 2013 from, Pearson:
http://educatoreffectiveness.pearsonassessments.com/downloads/viva_v1.pdf
Nitko, A. J. (2004). Educational assessment of students, 4th ed. Upper Saddle River, NJ: Pearson. No Child Left Behind Act, 20 U. S. C. § 6301(2001).
Papay, J. P. (2011). Different tests, different answers: The stability of teacher value-added estimates across outcome measures, American Educational Research Journal, 48(1), 163-193. Perez-Pena, R. (May 29, 2012). Waivers for 8 more states from ‘No Child Left Behind.’ Retrieved: http://www.nytimes.com/2012/05/30/education/eight-more-states-get-waiver from-no-child-law.html?_r=1
Raudenbush, S. W., & Bryk, A. S. (2002). Hierarchical linear models: Applications and data analysis methods, 2nd ed. Thousand Oaks, CA: Sage.
Sanders, W. L., & Horn, S. P. (1994). The Tennessee value-added assessment system (TVAAS) mixed-model methodology in educational assessment. Journal of Personnel Evaluation in Education,8, 299-311.
Sanders, W. L., & Horn, S. P. (1998). Research findings from the Tennessee value-addeda ssessment system (TVAAS) Database. Implications for educational evaluation and research.
Journal of Personnel Evaluation in Education, 12(3), 1998. 247-256.
Singer, J. D., & Willett, J. B. (2003). Applied longitudinal data analysis: Modeling change and event occurrence. Oxford: Oxford University Press.
Timmermans, A C., Doolaard, S., & de Wolf (2011). Conceptual and empirical differences among various value-added models for accountability. School Effectiveness and School Improvement, 22(4), 393-413.
van de Grift, W. (2009). Reliability and validity in measuring the value added of schools. School effectiveness and School Improvement, 20(2), 269-285.
Yeh, S. T. (2012). The reliability, impact, and cost-effectiveness of value-added teacher assessment methods. Journal of Education Finance, 37(4), 374-399.
Spring and Summer 2014 110
Figure 1. Typical Shed Pattern demonstrating most gains in the “at risk” group in the Reading First Ohio Center (RFOC) study.
.
Figure 2. Typical Tepee Pattern demonstrating most gains in the “some risk” group in the Reading First Ohio Center (RFOC) study.
. 0 0.05 0.1 0.15 0.2 0.25
At Risk Some Risk Low Risk
R e ad in g G ai n
Reading Progess First Grade 2006
0 0.05 0.1 0.15 0.2 0.25
At Risk Some Risk Low Risk
R e ad in g G ai n
Spring and Summer 2014 111
Figure 3. Typical Upward Shed Pattern demonstrating most gains in the “low risk” group in the Reading First Ohio Center (RFOC) study.
-0.25 -0.2 -0.15 -0.1 -0.05 0 0.05 0.1
At Risk Some Risk Low Risk
R e ad in g G ai n