University of Central Florida University of Central Florida
STARS
STARS
Electronic Theses and Dissertations, 2004-20192011
Curriculum-embedded Reading Tests As Predictors Of Success
Curriculum-embedded Reading Tests As Predictors Of Success
On Florida Comprehensive Assessment Test In Reading
On Florida Comprehensive Assessment Test In Reading
Nicole JohnsonUniversity of Central Florida
Part of the Education Commons
Find similar works at: https://stars.library.ucf.edu/etd University of Central Florida Libraries http://library.ucf.edu
This Masters Thesis (Open Access) is brought to you for free and open access by STARS. It has been accepted for inclusion in Electronic Theses and Dissertations, 2004-2019 by an authorized administrator of STARS. For more information, please contact [email protected].
STARS Citation STARS Citation
Johnson, Nicole, "Curriculum-embedded Reading Tests As Predictors Of Success On Florida
Comprehensive Assessment Test In Reading" (2011). Electronic Theses and Dissertations, 2004-2019. 1854.
CURRICULUM-EMBEDDED READING TESTS AS PREDICTORS OF SUCCESS ON FLORIDA COMPREHENSIVE ASSESSMENT IN READING
by
NICOLE JOHNSON
B.S. University of Central Florida, 2004
A thesis submitted in partial fulfillment of the requirements for the degree of Master of Education,
in the Department of Teaching, Learning, and Leadership in the College of Education
at the University of Central Florida Orlando, Florida
Summer Term 2011
ii
iii
ABSTRACT
With the passing of the No Child Left Behind legislation (2001), individual states have been required to administer standardized tests to measure students’ academic achievement in several academic areas, including reading comprehension. Many schools are using curriculum embedded reading comprehension tests to assess students’ progress in achieving grade level
expectations before the administration of state standardized test. This study used de-identified student data on curriculum embedded reading comprehension tests and the state standardized reading test, FCAT 2.0 to assess the correlation between a specific curriculum-based measure and the FCAT 2.0. The researcher used Pearson and Spearman Correlation to assess the
predictive relationship of the curriculum-embedded reading tests and FCAT 2.0 reading. Strong correlations were found between the two assessments which educators may find useful when planning and differentiating reading comprehension instruction throughout the school year.
iv
TABLE OF CONTENTS
LIST OF FIGURES ... v
LIST OF TABLES ... vi
LIST OF ACRONYMS/ABBREVIATIONS ... vii
CHAPTER ONE: INTRODUCTION ... 1
CHAPTER TWO: REVIEW OF RELATED LITERATURE ... 5
Connecting Oral Reading Fluency to Reading Performance ... 7
Connecting Reading Comprehension to Reading Performance ... 7
Predictive Validity Research Methods ... 8
Correlational Studies on Predicting Standardized Reading Test Scores ... 9
CHAPTER THREE: METHODOLOGY ... 11
Context ... 11
Participants ... 12
Data Sources ... 12
Data Analysis ... 15
CHAPTER FOUR: RESULTS ... 18
CHAPTER FIVE: DISCUSSION ... 24
v
LIST OF FIGURES
Figure 1 Box Plots of Reading Data ... 19 Figure 2 Scatter Plots of Reading Data ... 20
vi
LIST OF TABLES
Table 1: FCAT Developmental Scale Scores ... 14 Table 2: Assumption of Normality Tests ... 19 Table 3: Spearman Correlations Between FCAT 2.0 and Curriculum-Embedded Reading Tests 21 Table 4: Pearson Correlations Between FCAT 2.0 and Curriculum-Embedded Reading Tests .. 22
vii
LIST OF ACRONYMS/ABBREVIATIONS
FCAT 2.0: a criterion-referenced Florida state standardized assessment that measures student achievement of the Next Generation Sunshine State Standards (http://fcat.fldoe.org/fcat2/).
Curriculum Based Measure: a progress monitoring tool used to measure students’ progress in
specific academic areas including reading, math, science, and writing. (http://www.studentprogress.org/families.asp).
Spearman Correlation: a type of statistical correlation when both variables are ordinal (Lomax, 2007).
NCLB: No Child Left Behind Act of 2001, is federal legislation that mandates stronger
accountability, freedom for states, proven scientific-based instructional methods, and choices for parents. (http://www2.ed.gov/policy/elsec/leg/esea02/index.html)
Predictive Relationship: According to Fraenkel, Wallen, and Hyun (2012), exploring predictive relationships in a correlational research study that states “if a relationship of sufficient magnitude
exists between two variables, it becomes possible to predict a score on one variable if a score on the other variable is known.” (p. 333).
1
CHAPTER ONE: INTRODUCTION
With the passing of the No Child Left Behind legislation (2001), individual states were and are still required to administer standardized tests to measure students’ academic achievement in several academic areas, including reading comprehension. Standardized tests were designed to meet the needs of the policy-makers, which include high reliability, relatively low costs, as well as provide concise data, thus yielding a system of accountability (Calfee & Hiebert, 1996). These tests have shifted the educational landscape to a more assessment-driven nation in which meeting adequate yearly progress is a top priority for many educational leaders within each school
(Robinson & McKenna, 2008).
To ensure that the state of Florida is complying with the federal NCLB legislation, educational leaders have established New Generation Sunshine State Standards to measure students’ understanding of reading comprehension and specific reading benchmarks. FCAT 2.0,
a criterion-referenced test is one major assessment used to measure students’ understanding of the various standards within each grade level, beginning in 3rd grade through 10th grade. FCAT 2.0 is also used to assess or evaluate teachers, administrators, and overall school success. Based on the International Reading Association’s definition of a high stakes test, “high-stakes testing
means that the consequences for good (high) or poor (low) performance on a test are
substantial.” FCAT 2.0 would be considered a high stakes standardized test. According to the Florida Department of Education’s website, student’s promotion, retention, or graduation is
based solely upon a passing score on the reading portion of FCAT 2.0. Other consequences such as school sanctions, staff changes, and teachers’ salaries are also dependent upon students’ success on FCAT 2.0 each year.
2
Although there are disadvantages for only relying upon FCAT 2.0 to make important decisions affecting students, teachers, parents, and administrators, standardized tests such as this one can provide crucial information to all stakeholders involved. Hopkins, George, and Williams (2005) posit that standardized reading tests have substantial concurrent validity, meaning that tests administered relatively around the same time, yield similar results. Dr. Richard Allington (2012) also proposes that “group achievement tests are more appropriate for estimates of school
effectiveness because the error inherent in the tests is largely ameliorated with large samples of student scores” (p. 26). Despite the negative consequences attached to high-stakes tests known as
FCAT, this test does provide the public with a sense of how well schools are achieving state reading standards, therefore placing accountability on all educational stakeholders to raise student achievement and help develop strong readers.
To ensure that all NCLB’s goals are met and to eliminate the achievement gap, and ensure that all students are proficient by 2014, the government has mandated that scientifically proven, research-based instructional methods and assessments be implemented within the classroom (National Institute of Child Health and Human Development, 2000). Many
educational institutions are relying on formative and summative assessments to screen, diagnose, progress monitor, inform, and predict students’ success on standardized tests.
Formative assessments are used within the classroom to monitor students’ progress toward specific learning objectives and help inform educator’s instructional plans (Buffum,
Mattos, and Weber, 2009). On the other hand, Guskey and Bailey (2001) define summative assessments as cumulative, comprehensive measurements that assess students’ overall learning at the end of a unit of study or end of year. Both assessments are implemented for the sole purpose of collecting students’ knowledge or understanding of grade level benchmarks or learning
3
material. Although both assessments evaluate students’ proficiency of various standards, the
purpose and implementation of formative and summative assessments are different. According to Buffum, Mattos, and Weber, formative assessments are teacher-created, short, standard-based assessments that are administered to students frequently throughout various units of study. These assessments are designed to provide feedback to both students and teachers. Students learn how well they are acquiring various learning objectives while teachers use the formatives to help identify struggling students and plan for further instruction or intervention. On the contrary, Guskey and Bailey (2001) posit that “summative assessments tend to be broader in scope and usually cover a larger portion of the course than do the individual formative assessments” (p. 100). Summative assessments are used to assign grades or demonstrate students’ level of proficiency of material.
General progress monitoring tests or curriculum-based measurements are used to determine if a student is meeting predictability schedules for their grade level and future grade levels (Diamond, 2005). These tests are formative in nature in that they are used to determine appropriate instruction to ensure student success. A form of curriculum-based measurement is the curriculum-embedded reading tests. These tests have evolved from criterion-referenced tests, which are defined as outcome measurements that determine students’ knowledge of specific
benchmarks or standards (Reutzel & Cooter, 2011). These curriculum-based measurements serve to provide students with practice on the format of multiple-choice and provide teachers with information regarding whether or not their students are learning what is taught (Calfee & Hiebert, 1996, Diamond, 2005, & Torgesen, 2006).
The major purpose of this correlation or predictive relationship study is to determine whether or not a positive or negative relationship exists between student’s performance on
4
curriculum-embedded reading assessment and their summative score on the FCAT 2.0 reading assessment. If a strong correlation exists between the two variables, curriculum embedded reading test and FCAT 2.0 scores, then educators throughout the district can utilize the curriculum-embedded reading assessments to help inform and strengthen their reading comprehension instruction. On the contrary, if the study reveals that no relationship exists
between the two reading assessment, then the school district must consider discarding or revising the curriculum-embedded reading assessments.
5
CHAPTER TWO: REVIEW OF RELATED LITERATURE
NCLB or the Elementary and Secondary Education Act (2001) mandated that all states develop academic standards and assessments aligned to grade-level benchmarks. To ensure accountability, states were also required to design criterion-referenced assessments to measure students’ knowledge of academic learning standards in the area of reading, math, writing and
science. Florida developed Sunshine State Standards and FCAT (Florida Comprehensive Assessment Test) to meet the requirements of this federal legislation. In 2007, Florida adopted even more rigorous standards known as the Next Generation Sunshine State Standards and also updated FCAT to FCAT 2.0, a criterion-referenced assessment aligned with the new state standards. According to the FCAT 2.0 Reading Test Item Specifications, “the purpose of the
FCAT 2.0 Reading is to measure student achievement in constructing meaning from a wide variety of texts.” In April 2011, students were administered FCAT 2.0 and expected to read
different genres of literary and informational passages and answer multiple choice reading comprehension questions ranging from vocabulary, reading application, literary analysis, and informational text/research process. To develop competency of these tested reading skills, schools have adopted reading series to ensure that students are acquiring reading comprehension strategies, skills, and grade level reading expectations and are assessed throughout the year using curriculum-embedded reading tests and state standardized tests.
Based on the Florida Department of Education, FCAT 2.0 provides stakeholders
including parents, teachers, policy makers, students, and community members with data on how well 3rd through 11th grade students are acquiring the New Generation Sunshine State Standards.
6
According to the Assessment and Accountability Briefing Book, FCAT is a highly reliable test, ranging from .87 to .92, a score of 0 indicates zero reliability. These high reliability scores indicate that FCAT does measure students’ knowledge of standards consistently. Also, because
FCAT measures content from the Sunshine State Standards there exists content validity as well. Therefore the Florida Department of Education states that “the evidence of reliability and
validity supports the claim that FCAT is technically sound and meets or exceeds the professional standards for standardized achievement tests” (p. 27).
As a result of the NCLB, legislation mandating states to implement scientifically proven, valid, and reliable assessments to measure student’s reading skills, or reading comprehension,
FCAT and FCAT 2.0 state assessments have been created and administered on a yearly basis. Scores on these assessments determine whether or not schools meet (AYP) adequate yearly progress. If schools fail to meet AYP, as determined by FCAT or FCAT 2.0 scores, schools face government sanctions such as staff replacement or school restructuring. Due to the high stakes attached to students’ performance on FCAT 2.0, school leaders are desperate to locate effective methods, strategies, or assessments that will help boost test scores. Unfortunately, measuring reading comprehension is a complex issue that poses many challenges such as lack of reliability and unfeasibility for classroom teachers (Invernizzi, Landrum, Howell, &Warley, 2005). Many researchers have relied upon narrow, multiple choice reading comprehension items or
curriculum-based measurements such as Oral Reading Fluency passages (ORF) to measure the relationship between oral reading accuracy and reading comprehension.
7
Connecting Oral Reading Fluency to Reading Performance
In 2003, Buck and Torgesen conducted a study in the state of Florida to determine a correlation between curriculum-based measurements (ORF) and the comprehension portion of the reading Florida Comprehensive Assessment Test. Their research showed that 91% of students reading 110 words per minute or more received a score of level 3 or above on FCAT while 81% of students reading below 80 words per minute scored at a level 1 or 2 on FCAT-not meeting sunshine state standards or reading comprehension standards on the standardized test. Other researchers, Roehrig, Petscher, Nettles, Hudson, and Torgesen (2008), also found similar moderate to strong predictive correlations of .70 and .71 between Dynamic Indicators of Basic Early Literacy Skills (DIBELS) ORF test and two reading comprehension measures-FCAT and SAT 10 standardized tests.
Connecting Reading Comprehension to Reading Performance
Positive predictive relations between oral reading fluency and reading comprehension studies have not been limited to the state of Florida. Researcher Keller-Margulis, Shapiro, and Hintze (2008) conducted a long-term diagnostic study of 1st graders to determine if their ORF or CBM assessments predicted success on their 3rd grade Pennsylvania System of School
Assessment reading comprehension test. This study showed moderate to strong prediction power relation between CBM assessments and reading comprehension. A similar longitudinal study was also conducted in a district in Texas using DIBELS oral reading fluency probes and TAKS-Texas Assessment of Knowledge and Skills to determine a predictive validity between the two
8
measurements (Warizek, Robers, Linan-Thompson, Vaughn, Woodruff, and Murray). The study confirmed that ORF assessments were a reliable predictor of performance of standardized tests.
With the study results showing a correlation or predictive relationship between oral reading fluency and comprehension, Wiley and Deno (2005) further investigated whether or not a comprehension curriculum-based measurement could predict students’ success on standardized reading comprehension tests. They used maze tasks; an assessment which contains a deletion of every nth word with multiple choice answers that a student must correctly identify to make the passage comprehensible. The researchers assessed 3rd and 5th grade English language learners and Non-English language learners to participate in the study. The study indicated that the maze task was a better predictor of student success on the Minnesota Comprehensive Assessment, an assessment similar to the FCAT, in reading than the ORF measurement.
Predictive Validity Research Methods
Fraenkel, Wallen, and Hyun (2009) suggest that researchers who conduct correlational studies can determine a relationship as well as a prediction between two variables, “If a
relationship of sufficient magnitude exists between two variable, it becomes possible to predict a score on one variable if a score on the other variable is known” ( p. 333). As previously
mentioned, several researchers have designed studies to determine if a particular reading skill can predict success on standardized reading measurements. In order to conclude a strong
correlation or prediction between the two variables, researchers used a statistical analysis, known as Pearson or Spearman correlation coefficient to measure a relationship between oral reading fluency and reading comprehension.
9
Correlational Studies on Predicting Standardized Reading Test Scores
According to Lomax (2007), a researcher who calculates a Pearson or Spearman
correlation coefficient will determine a negative or positive relationship as well as the strength of the relationship between two factors. Any score close to -1.0 or +1.0 indicates a solidly, strong correlation, however, if a score falls closer to 0 this would indicate a weak relationship. Buck and Torgesen, (2003) utilized the Pearson correlation and scatter plot to determine both a relationship and a prediction of scores on the FCAT reading assessment. These two researchers obtained 1,102 3rd graders’ ORF (oral reading fluency) and reading FCAT scores from a Florida school district, determined the median ORF score, calculated the correlation, and plotted the data on a scatterplot. The study produced a strong correlation of .70 between ORF scores and FCAT reading scores. The researchers also utilized a scatterplot in their study. Lomax (2007) explains that scatterplot illustrates data points and a regression line; if data points are scattered around the line then a strong relationship or prediction can be concluded. Based on Buck and Torgesen’s
study, data points showed that students with high ORF scores passed FCAT reading with a level 3 or higher and those students with a lower ORF score were more likely to fail FCAT with a level 2 or 1. Roehrigh, Petcher, Nettles, Hudson, and Torgesen, also conducted a correlational study using DIBELS (Dynamic Indicators of Basic Early Literacy Skills) oral reading fluency measurements and FCAT reading. Based on their statistical analysis or Pearson correlation scores, it was determined that ORF reading scores were a strong predictor of student’s success on
the Florida reading standardized assessment with a correlation score of .70 and .71, same results as Torgesen and Buck.
10
Another study by Wiley and Deno (2005) utilized Pearson correlations to determine relationships and predictive relationship amongst reading fluency and comprehension measures. These two educational researchers administered oral reading and maze curriculum-based
measurements to 36 third graders and 33 fifth graders in the fall semester of 2001 and then obtained students Minnesota Comprehensive Assessment scores in the spring. In order to determine a relationship, researchers used the Pearson correlation to determine a relationship between the three variables. The researchers found that maze comprehension measure was a stronger predictor of student success on MCAT with a correlation of .73 for both 3rd and 5th grade non-English learner students.
The evidence demonstrates the strong correlation or ability to predict oral reading fluency and reading comprehension as measured on state standardized reading tests. Unfortunately¸ the use of curriculum-embedded reading tests as a predictor of performance on standardized tests have not been reported in literature. The purpose of this study is to determine whether or not a comprehension curriculum-embedded reading assessments can predict students’ success on FCAT reading comprehension.
What is the predictive relationship, if any, of curriculum-embedded reading tests and state standardized tests? Does students’ performance on curriculum-embedded reading tests correlate positively or negatively with their scores on reading FCAT?
11
CHAPTER THREE: METHODOLOGY
This was a correlation study designed to determine a predictive relationship between curriculum-embedded reading comprehension assessments and reading achievement scores on FCAT 2.0 reading assessment. Participants for this study included third grade students from a small, Title-I elementary school in Deland, Florida. De-identified testing data was collected from sixty-two students and were analyzed to determine if a correlation or predictive relationship existed between the two assessments.
Context
Volusia County schools district is the 13th largest school district in the state of Florida, serving approximately 62,000 students. The district is responsible for 83 schools including 45 elementary, 13 middle, 10 high, 7 alternative, and 8 charter schools. Volusia County is one of the largest school organizations in the state and has maintained an A or B status according to the school accountability reports provided by the Florida Department of Education. The overall student population within the district is successful on achieving on FCAT, there are some schools within Volusia County that have difficulties meeting high standards on the state assessment. The specific school used in this study struggles to meet AYP or have high percentages of students passing the reading portion of the FCAT test. According to the state accountability report, within the past seven years this school has only met AYP once in 2005-2006. Only 58% of the 3rd, 4th, and 5th grade population earned a level 3 or higher on the reading portion of FCAT in 2009 and 2010.
12 Participants
62 third grade students out of the429 students attending this Title 1 elementary school participated in this study. According to the school accountability report, 86% of the student population receives free or reduced lunch services. 19% of the student body is exceptional education students, 27% are English Language Learners, and 2% are migrant children. The school is made up of a diverse population with 26% Caucasian, 33% African-American, 33% Hispanic, and 6% multiracial children. The researcher is a 3rd grade teacher at this educational institution making this a convenience sampling method.
Data Sources
From August 2010 to April 2011, two types of reading comprehension assessments were administered to students to measure reading comprehension-curriculum-embedded reading assessments and Florida Comprehensive Assessment Test (FCAT 2.0). The curriculum-embedded reading assessments were created by a team of teachers and district reading
specialists. Reading passages were taken from Harcourt and Macmillan basal reading tests, cold reads that students had never been exposed to before. The comprehension questions and multiple choice answers attached to the reading passages were formulated by the reading test team. All questions were modeled after the FCAT 2.0 released tests items from the FCAT 2.0 Reading Test Item Specifications booklet. Each test included 3 or 4 passages with three or four reading questions from each FCAT 2.0 reading reporting category including vocabulary, reading application, literary analysis, and informational text or research process. A total of 30-40
13
questions were created to represent each reading New Generation Sunshine State Standard that would be tested on FCAT 2.0. The curriculum-embedded reading assessments were designed to align with the same type of content assessed on the summative, end-of year FCAT 2.0
assessment. These assessments were administered every six weeks to measure students’
proficiency levels on third grade level reading benchmarks. Assessments were given in class by classroom teachers and scanned through the district scantron program, Achievement Series. Students were scored on a 0-100 point scale.
Another reading comprehension instrument used to measure students’ reading
comprehension was the FCAT 2.0 standardized reading test. FCAT 2.0 is a criterion-referenced assessment designed to measure students’ achievement level on New Generation Sunshine State
Standards in reading. The reading benchmarks that were assessed were clustered around 4 major reading categories including vocabulary, reading applications, literary analysis, and
informational text or research process. According to the Test Item Specifications Grades 3-5 booklet, “the purpose of the FCAT reading is to measure student achievement in constructing
meaning from a wide variety of texts (p. 3). Third grade FCAT 2.0 contains 60% literary text and 40% informational text of an average of 500 words per text. The multiple-choice test measures grade level reading benchmarks, each test question reflecting different levels of cognitive complexity, low, moderate, or high demands on students’ thinking. This test was administered the second week of April to all third grade students. Students’ teachers administered the
assessment in a formal, standardized classroom. All students bubble sheets were scored by state contractors. Approximately a month and a half after the FCAT 2.0 test date, students’ scores were released and sent to each school site. School administrators exported students’ de-identified
14
FCAT reading scores are reported as a continuous developmental scale score and achievement level score. Achievement level scores are based on a 5 point scale used to describe student’s performance on the state standardized test. Florida Department of Education released a report entitled, Understanding FCAT 2.0 Reports, to explain each academic level:
Level 5 indicates success with the content on the FCAT by answering most questions correctly.
Level 4 indicates success with the content on the FCAT by answering most questions correctly, except for the most challenging questions.
Level 3 indicates partial success with the content on the FCAT.
Level 2 indicates limited success with the content on the FCAT.
Level 1 indicates little success with the content on the FCAT.
http://fcat.fldoe.org/fcat2/pdf/11ufrfinal.pdf
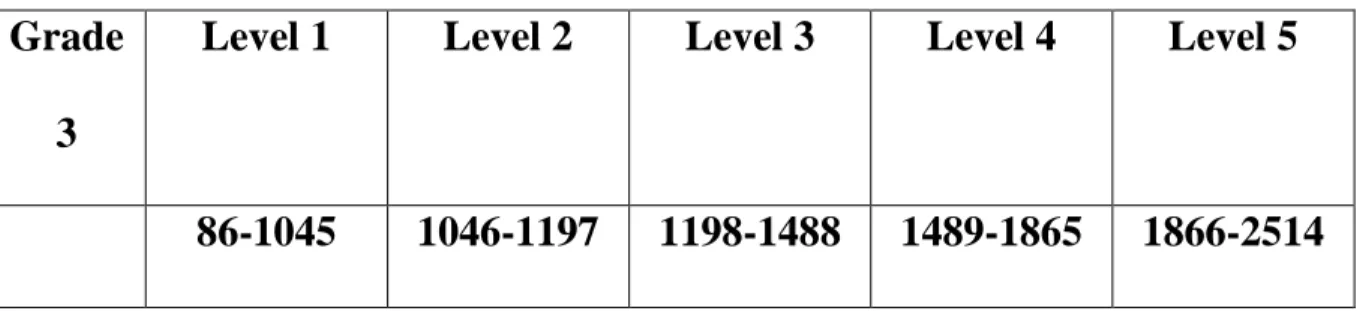
Each achievement level is based on students’ developmental scale score which is described
within the table below. FCAT developmental scale scores are used to show student’s progress as they move up the grade levels.
Table 1: FCAT Developmental Scale Scores
Grade
3
Level 1
Level 2
Level 3
Level 4
Level 5
86-1045
1046-1197
1198-1488
1489-1865
1866-2514
According to the Florida Department of Education website, all 3rd grade students are required to pass the FCAT Reading test with an achievement level score of 2 or above. If
15
students do not achieve the state’s criteria score and do not meet one of the six state exemptions
then mandatory retention will result for that particular student. Students’ FCAT scores also play a role in the NCLB’s accountability mandates in regards to school improvement and closing the
achievement gap amongst all students. Student achievement data are calculated to determine individual school’s school grades and annual yearly progress. According to the
http://schoolgrades.fldoe.org/pdf/0910/Guidesheet2010SchoolGrades.pdf website, each school is awarded one point for every student achieving a Level 3, 4, or 5 on FCAT reading. Learning gains from previous school years are also taken into account and are based on FCAT scores. For example, any student scoring a level 1 in 3rd grade but earn a level 2 or higher in 4th grade will earn additional points for their school site-raising the opportunity to achieve a higher letter grade. The more points a school attains the higher their school letter grade will be and obtaining
Adequate Yearly Progress (AYP) will also be achieved.
Data Analysis
The data in this study were analyzed using the statistical procedures Pearson product-moment correlation, a parametric test and Spearman correlation, a nonparametric test. According to Lomax (2007), Pearson correlation is utilized when both variables in the study are continuous in nature, either interval or ratio. On the other hand, if one variable is either rank or ordinal then a Spearman correlation should be used. In this particular study, scores from both assessments were continuous or interval scales of measurement, 0-100 points on the curriculum embedded- reading tests and 86-2514 scale scores on the FCAT 2.0. However, FCAT achievement level scores 1-5 are ordinal scales of measurement, indicating that a level 1 score would be the lowest
16
score and a level 5 achievement score would be considered the highest score on the FCAT. Due to the varying scales of measurements, the researcher decided to calculate the correlations of the assessment data using Pearson and Spearman.
Gay, Mills, and Airasian (2009) also propose another reason to select a nonparametric test, Spearman correlation, over a parametric test. Parametric tests require specific assumptions of normality, meaning that the variable must be normally distributed and if this is violated then a nonparametric test should be used. Fraenkel, Wallen, and Hyun (2012) also recommended that researchers “use both parametric and nonparametric techniques to analyze data and when the
results are consistent, interpretation will thereby be strengthened” (p. 259). Therefore, both statistics were used to cross-validate the results and to determine a correlation or predictive relationship between scores on curriculum-embedded reading tests and FCAT 2.0.
De-identified scores from both assessments were collected from the participating school. Curriculum-embedded reading test scores and FCAT 2.0 scores from each third grade classroom were exported from the district’s data collection program into an Excel sheet and then inputted in
the SPSS statistical computer program. The researcher then analyzed the data using the two bivariate correlations, Pearson and Spearman, and calculated to determine a correlation coefficient. Initially, the researcher used a Pearson correlation to determine a relationship between the two continuous measurement scales of the curriculum-embedded reading tests and FCAT scores but because some of the assessment data was not normally distributed a Spearman correlation analysis was also calculated to cross-validate the findings.
Curriculum-embedded reading tests’ scores and , performance on FCAT 2.0 reading assessments-FCAT achievement levels and scales scores were both computed and analyzed to
17
determine if a weak, moderate, or strong correlation existed between the two assessments. A strong correlation was determined based on statistician Jacob Cohen’s findings (1988), a
correlation of .5 or higher. Therefore if the correlation between the various formative reading tests and FCAT 2.0 scores were higher than .5, the researcher could infer that the two
assessments are related to each other. The researcher could also determine if students’
performance on the curriculum-embedded reading tests could predict success on the FCAT 2.0 Reading.
18
CHAPTER FOUR: RESULTS
The purpose of this research was to determine if a correlation or predictive relationship existed between curriculum-embedded reading assessments and students’ performance on FCAT 2.0-developmental scores ranging from 86-2514 or achievement level scores ranging from level 1-5. Through statistical analysis, the researcher wanted to determine if student’s performance on formative reading assessments throughout the year could accurately predict students’ success on
the cumulative, state standardized test at the end of the students’ third grade year. The following information presented in this chapter explains the rationale for the utilization of the
nonparametric test, Spearman and the parametric test, Pearson product-moment correlation test by presenting the violations of linearity and normality. The results from both the Pearson and Spearman correlation statistics calculated through the SPSS statistics program are displayed to indicate whether or not a strong correlation or predictive relationship exists between the two types of reading assessments and to cross-validate both data results.
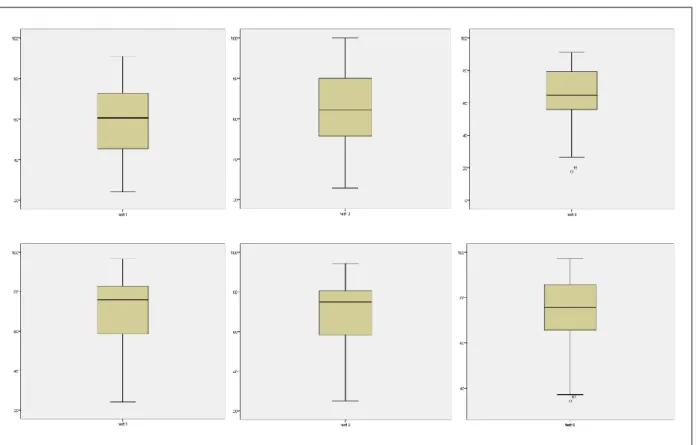
Although Pearson’s correlation is typically used to examine the relationship between two continuous variables, the data for this study violated statistical assumptions for this analysis. The assumption of normality was tested for both reading curriculum-embedded reading tests and FCAT 2.0 assessment using Shapiro-Wilk’s, stem and leaf plots, and box plots. Evidence from the Shapiro-Wilk’s test for normality ranged from W=.905 to .977 and p < .001 to .395 indicated that some of the reading tests were not normally distributed. Table 1 displays the Shapiro-Wilk’s test indicating a violation of normality. The researcher also examined graphical methods such as the stem and leaf plots and noticed that all of the assessments did not show a normal distribution. Box plots also indicated that several assessments had outliers or scores outside of the various
19
distributions for many of the assessments. According to Dr. Andy Field, “A case that differs substantially from the general trend of the data is known as an outlier and if there are such cases in your data they can severely bias the correlation coefficient.” (p. 1). Table 2 presents box plots that show outliers or scores outside of the data.
Table 2: Assumption of Normality Tests
Variables Shapiro-Wilk Skewness Kurtosis
Test 1 p= .395 W=.977 -0.063 -0.66 Test 2 p= .383 W=.977 -0.123 -0.713 Test 3 p= .027 W=.951 -0.651 0.486 Test 4 p= .020 W=.948 -0.639 -0.202 Test 5 p= .002 W=.923 -0.954 0.539 Test 6 p= .000 W=.905 -0.841 -0.278 FCAT p= .079 W=.961 0.326 2.339 p < .05 is non-normal
20
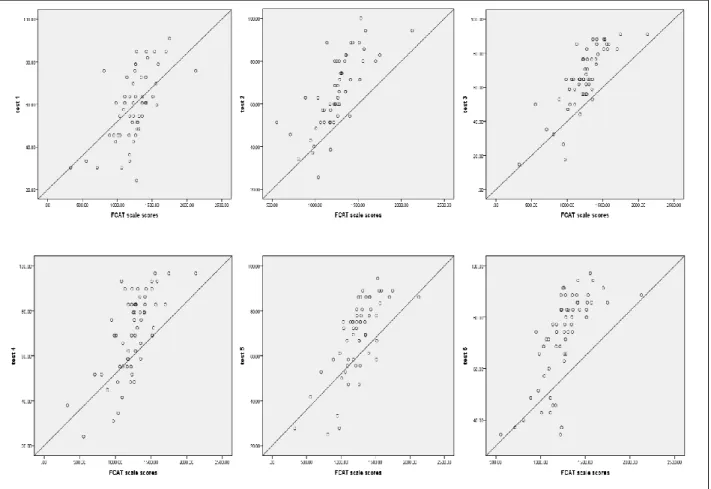
Further examination showed that tests also violated assumptions of linearity. Lomax (2007) explains, “the relationship among X and Y is determined by the scatter of the points on a scatterplot.” (p. 179). There is a strong relationship if the data points fall close to the regression
line, on the other hand, if the data points are scattered all around the line, then this denotes a weak relationship between the two variables. Lomax further asserts (2007), “the linearity
assumption means that a straight line provides a reasonable fit to the data. If the relationship is not a linear one, then the linearity assumption is violated.” (p. 186). Table 3 displays scatterplot
data from all six curriculum-embedded reading tests and FCAT scores clearly indicating that data is nonlinear or violates assumptions of linearity.
21
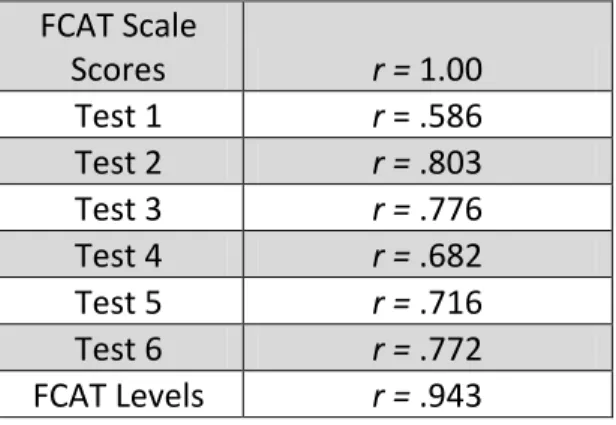
As a result of violating statistical assumptions, a nonparametric statistic was also utilized to cross-validate results and determine a correlation or predictive relationship between the two variables within this study. Based on the statistical Spearman correlation analysis as reported in Table 4, strong, positive correlations or predictive relationships were found between all reading curriculum-embedded tests and FCAT 2.0 ranging from r=.586 to .803 with a p < .05. Table 5 also displays strong, positive Pearson correlation coefficients for all reading scores, ranging from
r = .602 to .793 with a p < .05. Based on Jacob Cohen’s statistical criterion (1988), a correlation of .5 or higher is deemed as a high correlation or relationship between variables. Therefore, all of the Spearman and Pearson correlation coefficients indicate high, positive predictive relationships between the two reading assessments. The probability is less than 5% that the relationship
between the two variables is due to chance alone, indicating a strong relationship.
Table 3: Spearman Correlations Between FCAT 2.0 and Curriculum-Embedded Reading Tests
FCAT Scale Scores r = 1.00 Test 1 r = .586 Test 2 r = .803 Test 3 r = .776 Test 4 r = .682 Test 5 r = .716 Test 6 r = .772 FCAT Levels r = .943
22
Table 4: Pearson Correlations Between FCAT 2.0 and Curriculum-Embedded Reading Tests
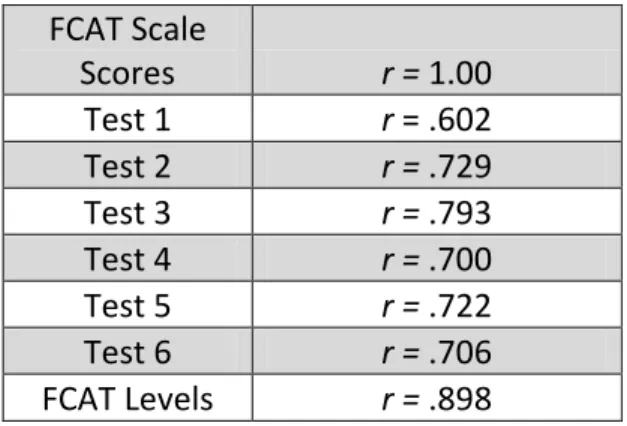
Throughout the year, the predictive relationships between the two assessments varied, some stronger than others. Test 1, administered in the fall of 2010, resulted in the weakest correlation of r=.586 or r= .602. This can be attributed to summer reading loss and lack of reading comprehension instruction of all third grade level benchmarks as assessed on the measurement instruments. On the other hand Test 2, had the highest Spearman correlation coefficient of r=.803 with a p < .05 or a higher Pearson correlation than Test 1 at r=.729. Students were placed in targeted, differentiated skill groups and immersed in independent and instructional reading books that resulted in higher test scores on this particular curriculum-embedded reading test.
Test 3 and Test 4 Spearman correlation coefficients were r=.776 and r = .682 or Pearson correlations of r=.793 or r=.700 with p < .05 indicating a strong relationship between
performance on both the district and state assessment. This decrease in
Spearman and Pearson correlation coefficients between tests 3 and 4 can be credited to several factors including different genres of text and challenging content. These assessments included genres not tested in test 1 and test 2 including informational nonfiction texts with text features
FCAT Scale Scores r = 1.00 Test 1 r = .602 Test 2 r = .729 Test 3 r = .793 Test 4 r = .700 Test 5 r = .722 Test 6 r = .706 FCAT Levels r = .898
23
and longer passages and traditional folktales with different narrative elements. Students’ lack of background knowledge and understanding of genre and text features decreased overall students’
population score average resulting in a lower predictive relationship between the two reading assessments. Test 4, assessment with the lowest Spearman correlation of r=.682 or Pearson correlation of r = .700 was administered a couple of weeks after a two-week student holiday vacation which may have affected students’ performance.
The two curriculum-embedded reading assessments administered closest to the FCAT testing period were Tests 5 and 6. The predictive relationship or correlation coefficient increased from test 4. Test 5 had a Spearman correlation coefficient of r=.716 and test 6 had a higher predictive relationship of r =.772 with a p < .05. Pearson correlations for tests 5 and 6 were r
=.722 or r =.706 with a p < .05. At this particular part of the year, students had been immersed in third grade curriculum and taught all third grade reading comprehension benchmarks as assessed on FCAT. Students also had previous practice with curriculum-embedded reading tests from tests 1 through 4 and been provided differentiated, targeted, skills-based instruction.
Throughout the 2010-2011 school year, curriculum-embedded reading assessments were administered to help inform reading comprehension instruction and predict students’ success on the summative state assessment FCAT at the end of the third grade year. Based on the
Spearman’s and Pearson’s correlation calculation, all six curriculum-embedded reading
assessments had a correlation coefficient greater than .5 indicating a significantly high predictive validity (Cohen, 1988). Therefore, the researcher can conclude that the curriculum-embedded reading assessments are strong predictors of success on the FCAT test in reading.
24
CHAPTER FIVE: DISCUSSION
This research study supports the idea that there is a correlation or predictive relationship between students’ reading comprehension performance on curriculum-embedded reading assessments and FCAT 2.0. Previous correlational studies between fluency and reading comprehension as measured by state standardized assessments have been conducted in many states nationwide. All of these studies have shown significant correlations or predictive relationships between students’ fluency levels and their ability to pass reading comprehension measurements. The studies have suggested that if students’ are reading at or above grade level
expectations that they have a higher reading comprehension abilities and are able to pass state standardized tests. Conversely, the research studies indicate that if students’ fluency levels are
below grade level benchmarks then students’ achieve lower performance levels on reading achievement measurements. Although these studies indicate strong predictive relationships between fluency and reading comprehension, the fluency measurements do not assess students’
reading comprehension skills as measured by state standardized tests. The significance of this particular research illustrates that curriculum-embedded reading assessments can also predict students’ achievement on state test such as FCAT 2.0.
Predicting students’ achievement on state standardized assessments is beneficial to
educational institutions’ stakeholders. Scores from FCAT 2.0 determine grade promotion, state sanctions, financial resources, and teachers’ evaluations for all public educational institutions. As a result educators are constantly seeking instructional strategies and assessments that measure and progress monitor students’ proficiency levels of grade level benchmarks as measured by
25
students’ ability levels, resulting in intervention and remediation of skills before a summative
assessment such as FCAT 2.0 is given. This study shows that curriculum-embedded reading assessments aligned with FCAT 2.0 benchmarks can provide teachers with valuable insight and allow them to modify reading instruction to fit individual student’s reading comprehension needs.
Findings from this study provide important implications for district and school-based leadership, educators, parents, and students. The results from the correlational statistics indicate that all of the assessments have strong predictive relationships between the reading assessment and the FCAT 2.0 given at the end of the instructional school year. Therefore, results from each assessment throughout the school year can be monitored and analyzed for a plethora of district and school-based decision-making. Professional development opportunities, coaching sessions, instructional methods, intervention and remediation programs, parental involvement, and student goal setting can be formulated throughout the year based on the results from these curriculum embedded assessments.
The curriculum-embedded reading assessments are administered six times to all third through fifth grade students in the Volusia County schools before FCAT 2.0 testing period. After the first six weeks of school, administrators from the district can collect and analyze data from these reading assessments. Based on students’ results, the district can organize and create professional development opportunities to support teachers’ efforts at helping students’ achieve
grade level benchmarks. Reading specialists can develop instructional workshops targeting specific instructional strategies or reading comprehension skills or strategies that will assist teachers in instruction. The data from the assessments can also target struggling schools that are performing poorly on the curriculum-based assessments and ensure that reading specialists are
26
providing coaching opportunities to those schools in need.
School-based leadership can analyze data from curriculum-embedded reading
assessments in professional learning communities with educators. Principals and reading coaches can also provide grade level support to struggling teachers with professional development
opportunities, coaching or modeling sessions. Effective reading comprehension instructional strategies or methods can be shared amongst all teachers within grade levels. Data from these meetings can also help to design remediation and intervention based-groups for students. If a particular group of students are not reaching proficiency on specific benchmarks as assessed by the curriculum-embedded reading tests, then students can be placed in differentiated grouping assignments to help them achieve grade level expectations.
The results from the curriculum-embedded reading tests can inform or drive instruction. Teachers can analyze data and plan more effectively. Teachers can use the assessments to plan whole group, small group, and individual instruction based on specific, targeted grade level benchmarks. The curriculum-embedded reading tests are aligned with FCAT 2.0 so teachers can ensure that they are providing students with the same type of rigor and content as measured by the state standardized test throughout the year. Teachers can also use the assessments as a progress monitoring tool and modify students’ instruction accordingly.
The Assessment and Accountability Briefing Book data, reliability findings of .88 to .91 and concurrent validity between FCAT and Norm Referenced Tests of .84 and .85, show that FCAT is a valid and reliable assessment. This research study also found a strong relationship or correlation between the curriculum-embedded reading tests and FCAT 2.0, indicating that the CBM is a valid measure of students’ reading comprehension and new generation standard
27
make instructional decisions that will benefit their students. Teachers can analyze the test results from the curriculum-embedded reading tests and look for patterns of difficulty. For example, if a student is consistently missing main idea or author’s purpose questions, then a teacher can focus
on these skill areas during reading conferences or small group instruction. If a teacher notices that the whole class is struggling with a particular reading benchmark then the teacher can intervene and plan differentiated lessons focusing on that particular skill to improve students’
achievement.
Information from these curriculum-embedded reading assessments can also play a significant role in parent communication and student involvement. Teachers can convey to the parents throughout the year the strong relationship between students’ performance on the
curriculum-embedded reading tests and their achievement level on FCAT 2.0. Parents can support their teachers’ and students’ efforts at achieving grade level expectations by supporting
students at home. Students can also take ownership over their performance on these assessments and establish personal goals to achieve. Students can monitor their own individual progress and establish specific plans of actions on how they can improve their proficiency levels on specific reading comprehension benchmarks.
Although the findings from this study suggests a strong predictive relationship between performance on curriculum-embedded reading tests and FCAT 2.0, there are several limitations within this study that should be strengthened in future research. Two of the limitations include the convenience sampling method and small sample size. Although de-identified data was collected for this particular study, the researcher selected student data from their personal teaching site. Also, the sample size was limited to sixty-two participants in one particular grade level, 3rd grade. One cannot overgeneralize its findings to a larger population.
28
Another limitation to this study is relying upon a multiple choice assessment to measure reading comprehension. Invernizzi, Landrum, Howell, and Warley (2005) suggest that multiple choice tests are “quick and easy and can be constructed reliably” but “content validity (an
indicator of the extent to which the questions actually measure reading comprehension) may be sacrificed for internal consistency (a measure of the reliability of the items).” (p. 201). Dr. Richard Allington also opposes the use of group standardized tests to measure individual reading comprehension or growth. “Every major research and measurement organization, as well as the National Research Council, has opposed using standardized test data in making decisions about an individual students’ achievement.” (p. 26). Teachers are cautioned against teaching to the test
but teaching the reading skills and strategies that boost reading comprehension. Within Kelly Gallagher’s book Readicide (2009), the author proposes that “when
teachers and student spend their energies preparing for shallow high-stakes assessments, deeper learning suffers” (p. 21). Many schools are narrowing their curriculum and only teaching their
students what is tested on multiple choice tests. Test preparation is also an emphasis in schools, replacing instruction and engaged reading experiences for children. Guthrie (2002) suggests that too much test preparation can harm students’ performance and that assisting students with increasing their reading ability is the most effective test preparation, “If we look at standardized test performance in grade 3,4, 5, or 6, the strongest predictor of achievement is amount of reading” (pg. 382). Therefore if we want our students to be successful readers who perform well
on standardized reading tests, teachers must provide comprehensive long-term instruction in reading strategies and skills as well as opportunities to read widely and frequently to boost their reading abilities.
29
important to remember that there are many other measures of student learning during the course of the year. International Reading Association (1999) recommends that educators rely upon other assessments such as student interviews, conferences, observations, anecdotal records, work samples, and inventories to gauge how students are performing or growing as readers. Pat Cunningham and Allington (2011) suggest that teachers utilize informal reading inventories to measure students’ oral reading fluency and accuracy and determine comprehension needs based on their retelling and ability to answer literal or inferential questions. Teachers may implement the use of anecdotal records or checklists of comprehension strategies. As teachers are
conferencing with students, they can record students’ words and application of comprehension strategies, evaluate students’ learning, and plan instruction accordingly. Chris Tovani (2011) advices teachers against relying upon standardized scores to inform instruction, “targeting specific needs is difficult because measuring critical thinking is sacrificed in the name of
efficient scoring” (p.11). Tovani emphasizes the use of formative assessments such as annotated texts, double-entry diaries, inner-voice sheets, and response journals to help measure students’ comprehension strategies or skills. All of these different types of reading measurements can immediately inform teacher’s instruction and provide feedback for students instead of waiting six weeks to administer a multiple choice summative or yearly standardized test.
Although FCAT and curriculum-embedded reading tests are reliable measurements of students’ knowledge of specific next generation sunshine state reading standards and can provide a an overall picture of school achievement, educators must not place a heavy emphasis on
multiple choice assessments. We must assess children’s reading progress in multiple ways and develop a love of reading in our students instead of a class of exemplary multiple choice test takers. Use the results from all assessments as ways to inform, modify, and plan for instruction.
30
It is important for educators to understand Guthrie’s (2002) statement, “One of the most well-established findings in reading research is that reading comprehension is an outgrowth of a wide range of purposeful, motivated reading activities” (pg. 382) and establish a comprehensive assessment system balancing formal with informal assessments.
Future researchers should examine a larger population size and also expand the research to include other grade levels. Different samples of grade levels and schools may suggest different conclusions or provide varied results. Future research would analyze a larger sample size,
examining all grade levels or schools in Volusia County that administer these curriculum-embedded assessments. Researchers may also consider researching effective instructional methods or intervention programs that help to increase students’ reading comprehension or
proficiency of reading benchmarks based on results from the curriculum-embedded reading tests throughout the year. Other reading assessments such as the statewide FAIR, Florida Assessments for Instruction in Reading could also be analyzed to determine whether or not a correlation or predictive relationship exists between the computerized reading comprehension test and FCAT 2.0.
31
REFERENCES
Allington, R. (2012). What really matters for struggling readers: Designing research-based programs. Boston, MA: Pearson Education, Inc.
Buck, J. & Torgesen, J. (2003). The relationship between performance on measure of oral reading fluency and performance on the Florida Comprehensive Assessment Test. (Tech. Rep. No. 1) Tallahassee, FL: Florida Center for Reading Research. Available at
http://www.fcrr.org/technical reports/Technical report.pdf.level1or2onFCAT. Buffum, A, Mattos, M., & Weber, C. (2009). Pyramid response to intervention: RTI,
professional learning communities, and how to respond when kids don’t learn.
Bloomington, IN: Solution Tree.
Calfee, R. & Hiebert, E. (1996). Classroom Assessment in Reading. In R. Barr, M. Kamil, P. Mosenthal, & P. Pearson (Eds.), Handbook of Reading Research Volume II (pp. 281-309). Mahwah, NJ: Lawrence Erlbaum Associates, Inc.
Cohen, J. (1988). Statistical power analysis for the behavioral sciences. Hillsdale, NJ: Erlbaum. Diamond, L. (2005). Assessment-driven instruction: A systems approach. Perspectives, Fall, pp.
33-37.
Field, A. (2000). Research Methods I: SPSS for Windows Part 5. Retrieved from http://statisticshell.com/correlations.pdf
Florida Department of Education. (2010). FCAT 2.0 Reading Test Item Specifications Grades 3-5. Tallahassee, FL: Office of Assessment.
Florida Department of Education. (2004). Assessment and accountability and briefing book.
32
Florida Deparment of Education. (2011). Understanding FCAT 2.0 Reports. Retrieved from http://fcat.fldoe.org/fcat2/pdf/11ufrfinal.pdf
Florida Department of Education. (2010). Grading Florida’s public schools, 2009-2010.
Retrieved from http://schoolgrades.fldoe.org/pdf/0910/Guidesheet2010SchoolGrades.pdf Fraenkel, J., Wallen, N, & Hyun, H. (2012). How to Design and Evaluate Research in
Education. New York, NY: McGraw-Hill.
Gallagher, K. (2009). How schools are killing reading and what you can do about it: Readicide. Portland: ME: Stenhouse Publishers.
Gay, L., Mills, G., & Airasian, P. (2009). Educational Research: Competencies for Analysis and Applications. Upper Saddle River, NJ: Pearson Education, Inc.
Guskey, T. & Bailey, J. (2001). Developing grading and reporting systems for student learning.
Thousand Oaks, CA: Corwin Press.
Guthrie, J. (2002). Preparing students for high-stakes test taking in reading. In A. Farstrup & S. Samuels (Eds.), What research has to say about reading instruction (pp. 370-391). Newark, DE: International Reading Association, Inc.
Hopkins, George, & Williams. (2005). The concurrent validity of standardized achievement tests by content area using teachers’ ratings as criteria.Journal of Educational Measurement,
22, pp. 177-182.
International Reading Association. (1999). High-Stakes Assessments in Reading. Position Statement. Retrieved from
http://www.reading.org/Libraries/Position_Statements_and_Resolutions/ps1035_ high_stakes.sflb.ashx
33
Invernizzi, M., Landrum, T., Howell, J., & Warley, H. (2005). Toward the Peaceful Coexistence of Test Developers, Policymakers, and Teachers in an Era of Accountability. In R.
Robinson & M. McKenna (Eds.), Issues and Trends in Literacy Education (pp. 198-209). Boston, MA: Pearson Education, Inc.
Keller-Margulis, M., Shapiro, C. & Hintze, J. (2008). Long-term diagnostic of curriculum-based measures in reading and mathematics. School Psychology Review, 37 (3), pp. 374-390. Lomax, R. (2007). An Introduction to Statistical Concepts. New York, NY: Lawrence Erlbaum,
Associates, Inc.
Mclane, K. (2011). What is curriculum-based measurement and what does it mean to my child? Retrieved from http://www.studentprogress.org/families.asp
National Reading Panel Report. (2000). Teaching Children to Read: An Evidence-based Assessment of the Scientific Research Literature on Reading and its Implications for Reading Instruction. Retrieved: March 13, 2011 from
http://www.nichd.nih.gov/publications/nrp/upload/smallbook_pdf.
No Child Left Behind Act of 2001, Pub. L. No. 107–110.
Robinson, R. & McKenna. (2008) Assessment-Driven Instruction. In R. Robinson & M. McKenna (Eds.) Issues and Trends in Literacy Education. (pp. 195-197). Boston, MA: Pearson Education, Inc.
Roehrig, A., Petscher, Y., Nettles, S., Hudson, R., and Torgesen, J. (2008). Accuracy of the DIBELS oral reading fluency measure for predicting third grade reading comprehension outcomes. Journal of School Psychology. 46 pp. 343-366.
Reutzel, D. & Cooter, R. (2011). Strategies for reading assessment and instruction: helping every child succeed. Boston, MA: Pearson Education, Inc.
34
Torgesen, J. K. (2006) A comprehensive K-3 reading assessment plan: Guidance for school leaders. Portsmouth, NH. RMC Research Corporation, Center on Instruction
Tovani, C. (2011). So what do they really know? Assessment that informs teaching and learning. Portland, ME: Stenhouse Publishers.
Warizek, J. Roberts, G. Linan-Thompson, S., Vaughn, S. Woodruff, A., and Murray, C. (2010). Differences in the relationship of oral reading fluency and high stakes measures of reading comprehension. Assessment for Effective Intervention. 35 (2). pp. 67-77.
Wiley, H & Deno, S. (2005). Oral reading and maze measures as predictors of success for English learners on a state standards assessment. Remedial and Special Education. 26, (4). pp. 207-214.