Journal of Information Technology Management
ISSN #1042-1319
A Publication of the Association of Management
TOWARDS IMPLEMENTING TOTAL DATA QUALITY
MANAGEMENT IN A DATA WAREHOUSE
G. SHANKARANARAYANAN
INFORMATION SYSTEMS DEPARTMENT
BOSTON UNIVERSITY SCHOOL OF MANAGEMENT
ABSTRACT
Poor quality of data in a warehouse adversely impacts the usability of the warehouse and managing data quality in a warehouse is very important. In this article we describe a framework for managing data quality in a data warehouse. This framework is of interest to both academics and practitioners as it offers an intuitive approach for not just managing data quality in a data warehouse but also implementing total data quality management. The framework is based on the information product approach. Using this approach it integrates existing metadata in a warehouse with quality-related metadata and proposes a visual representation for communicating data quality to the decision-makers. It allows decision-makers to gauge data quality in context-dependent manner. The representation also helps implement capabilities that are integral components of total data quality management.
Keywords: Data Quality Management, Data Warehouse, Information Product, Metadata
INTRODUCTION
Data quality is an important issue in decision environments due to the large data volumes and the complex, data-intensive decision-tasks that they support. In organizations, capital losses and heightened risk exposure are increasingly being attributed to data quality issues such as accuracy, consistency, completeness and timeliness. Decision support in such environments demands efficient data quality (in this paper data quality and information quality are used interchangeably) management. Here we describe a framework for managing and evaluating data quality in one such environment, the data warehouse (DW). Data quality issues are common in data warehouses and administrators are concerned about the usability of this decision environment [5]. Although research has examined several approaches for managing data quality, very few have addressed data quality management in data warehouses.
Jarke et al. propose a quality meta-model for a warehouse [5]. The meta-model allows users to define abstract quality goals for the content of a warehouse and offers a method to translate these goals into analysis queries that can be executed against the quality measurements. Although it does not explicitly address the evaluation of data quality, this research recognizes the “subjective” nature of the evaluation, i.e., the quality of data in a data warehouse is dependent on users and the decision-tasks it is used for. The same data may be evaluated differently by different users and even by the same user for two different decision-tasks. It is hence important that decision-makers must be permitted to gauge data quality in the context of the decision-task. Existing methods for evaluating data quality adopt an impartial (or objective) view that perceives data quality to be independent of all other factors including users and decision-tasks. Such impartial measurements of data quality associated with some data are not directly useful to the decision-maker who must be able to gauge data quality in the context of the decision-task that the same
data is used for. We use the terms “contextual” and “impartial” to describe the two different approaches to evaluating data quality. The objective of the framework presented in this paper is to communicate quality-related information (including impartial measurements) and enable the decision-makers to gauge (or evaluate) data quality in the context of the decision-task.
Neely presents a framework for analyzing data quality in source databases [9]. This research proposes a methodology for understanding data quality. Helfert and von Maur describe a data quality management system for a DW that incorporates the concepts of total data quality management (TDQM) [2]. Research, such as the above, dealing with data quality in a data warehouse provide different perspectives for examining data quality but do not address the evaluation of data quality in a warehouse. The framework described here assists in evaluating data quality and takes a step towards implementing TDQM in a data warehouse.
Data quality is typically evaluated along one or more of several quality dimensions [11]. Jarke et al. describe a set of quality dimensions for a warehouse [5]. The multi-tiered model specifies that data quality is a higher-order dimension that is composed of and can be evaluated using a set of secondary dimensions: interpretability, usefulness, accessibility, and believability. Each of these secondary dimensions (e.g. believability) in turn can be evaluated using a set of primitive dimensions (e.g. completeness, consistency, credibility, and accuracy). One such primitive dimension, accuracy, is used as an example in this paper for the purpose of illustrating two properties of the proposed framework: (1) how the framework can incorporate data quality dimensions and (2) how the framework can be used to evaluate data quality along such data quality dimension. The framework can hence supplement and improve existing methods for managing data quality in a data warehouse.
The foundation for this framework is the information product map (IPMAP), based on managing information as a product (IP-approach), and defined using the constructs proposed in [12]. The data in a data warehouse is created by using data from multiple different data sources and uses a variety of different processes (referred to as extraction, transformation, and loading or ETL processes) for extracting the data, cleansing it, transforming it, aggregating it at different levels of granularity and across multiple different dimensions. Further, the warehouse data may undergo several more transformations using additional processes (also referred to as ETL) prior to its delivery to a decision-maker. To
how the quality of data at each processing stage is impacted by its quality at previous stages. Further, the framework must help the decision-maker gauge data quality not only at the final stage but also at any of the preceding intermediate stages. To do so, it must help communicate “metadata” associated with each stage to the decision-maker. All of these requirements mandate a systematic approach for understanding the back-end and front-end processes as well as managing the metadata at each stage in a data warehouse. Although useful, conventional approaches to data quality management such as data cleansing [3], data tracking and statistical process control [11], data source calculus and algebra [7], and dimensional gap analysis [6] do not offer a systematic approach for managing data quality. They suffer from two key drawbacks: (1) these methods attempt to evaluate data quality in an impartial manner regardless of the decision-context that the data is used for. (2) These methods do not permit the evaluation of data quality at one specific stage using data quality measurements associated with one or more preceding stage. In a data warehouse where data is processed in stages, and where the quality of data at one stage is dependent on the data quality measurements associated with preceding stages, it is difficult to use these techniques for managing data quality. Further, these techniques do not support the requirements for TDQM such as managing quality at source and the abilities to trace-back or predict the impacts of data quality problems observed /identified at some data processing stage.
The information product (IP) approach takes the view that an “output” (e.g. a management report) of an information system is a product that is “manufactured” by the system [13]. The IP approach has gained acceptance for several reasons. First, manufacturing an IP is akin to manufacturing a physical product. Raw materials, storage, assembly, processing, inspection, rework, and packaging (formatting) are all stages in its manufacture. Typical IPs are “standard products” and can be “assembled” in a production line. Components and /or processes of an IP may be outsourced to an external agency (ASP), organization, or a different business-unit that uses a different set of computing resources. Second, IPs, like physical products, can be “grouped” based on common “manufacturing stages” permitting the “group” to be managed as a whole, i.e., multiple IPs may share a subset of processes and data inputs, and be created using a single “production line” with minor variations that distinguish each. Finally, proven methods for total quality management successfully applied in manufacturing can be adapted for TDQM.
loaded into the warehouse. At each stage, an IP is created that forms the input to the next stage. Decision-makers use this loaded data (also an IP) and create their own “outputs” (also IPs) by combining, analyzing, aggregating this data and defining convenient visual schemes to view it. To understand the implications of poor-quality data, it is necessary to trace a quality-problem in an IP to the manufacturing stage(s) that may have caused it, and predict the IP(s) impacted by quality issues identified at some manufacturing step(s). The IP-approach and the graph-like IPMAP representation make it amenable for incorporating such capabilities. It helps communicate the metadata on processing performed in a data warehouse thereby informing the user and allowing him/her to gauge
data quality in the context of each decision-task that he/she is using the data for. It allows administrators to visualize the manufacture of the warehouse by treating a warehouse as an information product. It makes it easier to identify problems with data (quality) in a warehouse and trace each problem to its one/more causes.
To describe the framework we first define the metadata requirements for managing data quality in a warehouse. We then describe the IPMAP representation for capturing the metadata and communicating it to decision-makers. We also define the associations between the IPMAP and the corresponding warehouse metadata. We then show how data quality may be evaluated in the IPMAP using accuracy as a sample. Finally we describe the capabilities for implementing TDQM using the
IPMAP.
FRAMEWORK FOR TDQM IN A
DATA WAREHOUSE
The IPMAP modeling scheme offers six constructs to represent the manufacturing stages of an IP: (1) data source (DS) block that is used to represent each data source/provider of raw data used in the creation of the IP, (2) a processing (P) block that is used to represent any manipulations and/or combinations of data items or the creation of new data items required to produce the IP, (3) a storage (S) block that represents a stage where data may wait prior to being processed, (4) an information system boundary (SB) block to represent the transition of data from one information system to another (e.g. transaction data in legacy file systems transferred to a relational database after some processing), (5) a data consumer (DC) block to represent the consumer, and (6) an inspection (I) block that serves to represent pre-determined inspections (validity checks, checks for missing values etc., authorizations, approvals etc.). Though it may be viewed as a process, this block is used to differentiate a transport/transformation process from the inspection/validation process. The arrows between the constructs represent the raw/component data units that flow between the corresponding stages. An input obtained from a source is referred to as a raw data unit. Once a raw data unit is processed or inspected, it is referred to as a component data unit.
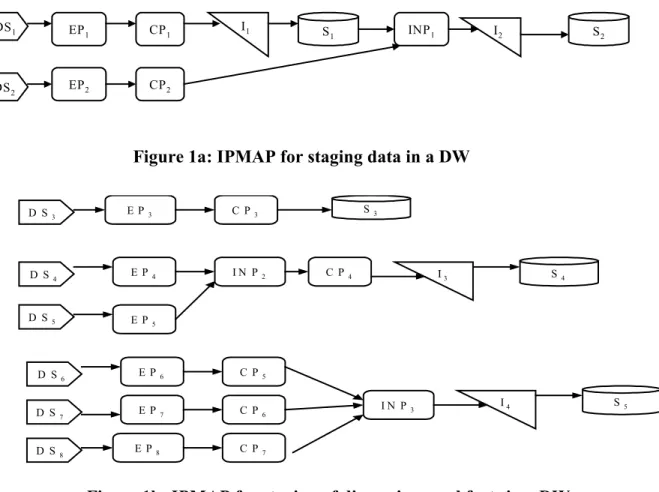
Consider a warehouse having (say) three dimensions and a set of facts (or measures). A generic, high-level, sequence of steps that result in the warehouse is represented by the IPMAP in figure 1, parts a, b, and c. The data from data sources (DS1 and DS2) are extracted
by extraction processes (EP1 and EP2), and cleansed (CP1
and CP2). The cleansed data from DS1 is inspected
(manual or automated process I1) and stored (S1). This is
combined with the cleansed data from DS2 by an
integration process (INP1), inspected for errors (I2), and
staged in storage S2. The staging of the other data
(dimensions and facts) can similarly be represented as shown in figure 2. The staged fact data (in S5) may then
be combined with the staged dimension data (in S2, S3,
and S4) by a transformation process (TP) and loaded into
the DW by the process (LP1). Though the transformation
may be a single process it is shown as multiple stages in figure 1c.
Iverson states that in order to improve data quality the metadata attributes must include process and procedure documentation such as data capture, storage, transformation rules, quality usage and metrics, and data-tips on usage and feedback [4]. Access to this metadata must be layered to support better communication. So each construct in the IPMAP is supplemented with metadata about the manufacturing stage that it represents. The metadata includes (1) a unique identifier for each stage, (2) the composition of the data unit when it exits the stage, (3) the role and business unit responsible for that stage, (4) individual(s) that may assume this role, (5) the processing steps to complete that manufacturing step, (6) the business rules /constraints associated with it, (7) a description of the technology used at this stage, (8) and the physical location where the step is performed. These help the decision-maker understand what is the output from this step, how was this created including business rules and constraints applicable, where (both physical location and the system used), and who is responsible for this stage in the manufacture in addition to when (at what stage) an operation was performed.
Figure 1a: IPMAP for staging data in a DW
Figure 1b: IPMAP for staging of dimensions and facts in a DW
Figure 1c: IPMAP representing the transformation and loading of a DW
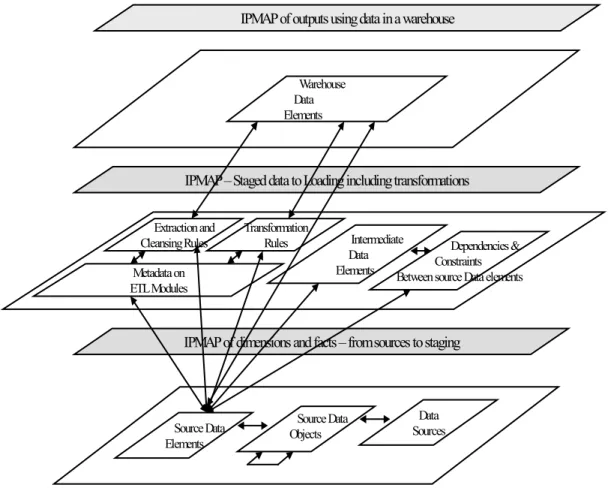
Further, metadata in a warehouse repository includes metadata on data sources, objects within each source (schema), and data elements in each. To assist data integration, the dependencies, constraints, and mappings between the source data elements are also maintained.
The different pieces of metadata along with the
associations and inter-relationships between these pieces (also metadata) are shown in figure 2. In addition to these metadata elements, for the purpose of managing data quality in the warehouse, we need additional metadata elements (items #1, 2, 3, 4, and 7 listed in the previous paragraph). TP2 S6 S5 S4 TP1 S2 TP3 S3 LP1 DS1 DS2 EP1 EP2 CP1 CP2 I1 S 1 INP1 I2 S2 E P3 C P3 S3 S4 D S3 D S4 D S5 E P4 C P4 I3 E P5 I N P2 S5 D S6 D S7 E P6 C P5 I4 E P7 I N P3 E P8 D S8 C P6 C P7
Figure 2: Layered Conceptual Representation of DW and IPMAP metadata
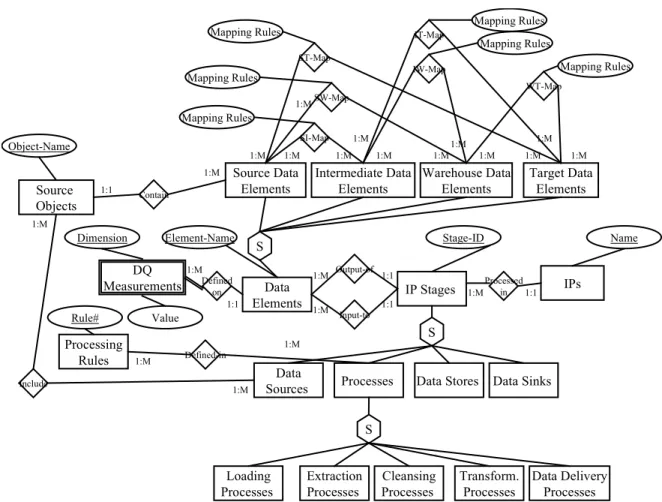
When implementing the TDQM framework in a warehouse, the DQ-metadata repository will link to and reuse the metadata elements that already exist in the warehouse repository besides capturing and managing the additional metadata elements. A conceptual data (ER)
model of the DQ-metadata repository is shown in figure 3. For clarity, only the identifiers of entity classes and certain key attributes are shown. The complete list of attributes is in table 1. Source Data Elements Data Sources Extraction and
Cleansing Rules Dependencies & Constraints Between source Data elements Transformation Rules Metadata on ETL Modules Warehouse Data Elements Source Data Objects Intermediate Data Elements
IPMAP of dimensions and facts – from sources to staging IPMAP –Staged data to Loading including transformations
Figure 3: Conceptual Data Model of Metadata Elements for TDQM in a DW
Data Elements S S Target Data Elements Warehouse Data Elements Intermediate Data Elements Source Data Elements Source Objects Processing Rules Contain Input-to IP Stages IPs SI-Map Processed in SW-Map ST-Map IW-Map IT-Map WT-Map S Data StoresProcesses Data Sinks
Output-of Data Sources Include Defined-in Loading Processes Transform. Processes Processes Cleansing Extraction Processes Data Delivery Processes Mapping Rules Mapping Rules Mapping Rules Mapping Rules Mapping Rules Mapping Rules
Element-Name Stage-ID Name
Rule# Object-Name 1:1 1:M 1:M 1:M 1:M 1:M 1:M 1:M 1:M 1:1 1:1 1:1 1:M 1:M 1:M 1:M 1:M 1:M 1:M 1:M 1:M 1:M 1:M 1:M DQ Measurements Dimension Value Defined on 1:M 1:1
Table 1: Metadata elements for TDQM in a DW
Metadata Entity Class Attributes (or metadata items) tracked by the entity class
Warehouse Data Elements Date loaded, Date updated, Currency (old/current) in the warehouse, associated data sources, associated extraction, cleansing, and transformation processes, whether (still) available in the data source, associated staged data elements, staged data sources
Data Sources ID or Unique name, Format type, Frequency of update, Active Status Source Data Objects (e.g.
tables if source is relational)
Object name, Aliases, Business Entity name, Business rules associated, Owner Source Data Elements Element name, Units, Business rules, Computation method(s), business
name/alias, data type, data length, Range-Max, Range-Min, Date/time when it was included, [Constraint and participating source elements]
Staged Intermediates /Target Objects (these are typically relational tables or object classes)
Object name, Aliases, Business Entity name, Business rules associated, Owner, Creation date, Object Status, Administrator,
Intermediate/Target Data Elements
Element name, Units, Business rules, Computation method(s), business name/alias, data type, data length, Range-Max, Range-Min, Date/time when it was included or became effective, [Constraint and participating source elements]
Source Element to Target Element Mappings & Constraints
Derivation and business rules, assumptions on default and missing values, associations between source and target data elements
ETL Process Modules ID and/or Unique name, Creation date, Effective date, Owner, Role/Business Unit responsible, Modification date, Modified by, reason for modification, system/platform associated, location in file system, execution commands, Run Date, Error Codes/messages
Extraction Process Applicable source data element(s), extraction rules, business restrictions/rules, Last Run Date, Error Codes/Messages, output data elements
Cleansing Process Applicable source data element(s), sanitizing rules, business restrictions/rules, output data elements
Transformation Process Input data element(s), transformation rules, business rules, output data elements Load Process Input data element(s), format/transformation rules, business rules, output
warehouse data elements
EVALUATING DATA QUALITY
To illustrate the evaluation of data quality in an IPMAP using accuracy as an example we treat accuracy as a perceived measure that may be evaluated subjectively. In certain situations, it is possible to evaluate accuracy in an objective manner. For instance, an objective measure of accuracy in databases might be computed as [Accuracy = 1 – (# of data items in error / Total # of data items)]. For individual data elements it could be computed as [Accuracy = 1 – {(Correct Value – Actual Value Used) / Correct Value}]. In these situations,the actual value of the data element is known and is used in the assessment of error and computation of accuracy. However, in most decision-tasks, the actual value of a data element is unknown at the time when it is used in the decision-task. Further, how accurate a data element needs to be is also dependent on the decision task at hand. For example, a ballpark figure of the enrollment in a course may be sufficient to determine how many textbooks should be ordered. A more accurate enrollment figure is necessary when deciding which classroom (seating capacity) is appropriate for this course. In both cases, the correct value is unknown when the decision is made.
The raw data units that come in from data source blocks are assigned an accuracy value by the provider or by the decision-maker. The value assigned is between 0 and 1, with 1 indicating a very accurate value. Inspection blocks do not affect the accuracy of the data unit(s) that flows through these blocks but may improve completeness.
A processing block may combine raw and/or component data units to create a different component data unit. The accuracy of the output data element in a processing block is dependent on the processing performed and the determination of a functional formula to express accuracy of the output data element is difficult. The formula proposed here is based on a generic process that combines together (collates) multiple data elements to create an output. It does not take into account the processing errors (affecting accuracy) that might be introduced by the process itself. For more complex processes that perform mathematical operations and can introduce process-errors that affect accuracy, statistical techniques such as those proposed by Morey [8] can be used to calculate the accuracy of the output data element instead of the formula proposed. To compute the accuracy of the output data element from a processing block, the decision-maker may assign weights (continuous between 0 and 1) to each input of the processing block and the output accuracy is a weighted average of the accuracy of the inputs. For example, let there be n data elements flowing into one processing stage (say, x). Let Aidenote
the specified (would be a computed value if it is a component data element) accuracy of raw data element i. Let us further state the decision-maker’s perceived importance of the data element i in the context of the decision-task is ai. The accuracy of the output data element of stage x is:
Ax = [Σi =1, n (ai * Ai)] / [Σi = 1, n (ai)]
For instance, in figure 1(a) let AS1 and ACP2 be the
accuracy measurements associated with the two inputs into process INP1. The accuracy
In case of inspection and storage blocks, the accuracy of the output elements is the same as the accuracy of the corresponding input elements. For additional data elements introduced during the inspection, the inspector can assign new values for accuracy.
The absence of an objective measure can result in the custodian of some data element (say, k) inflating the specified accuracy (Ak) of that data element due to
vested interests. The perceived accuracy ak of that data
element that is assigned by the decision-maker allows the decision-maker to adjust for such biased values. Organizations need to have some incentive schemes to
Capabilities for Managing Data Quality
The IPMAP offers three distinct capabilities for managing data quality and for implementing TDQM. These are: (1) estimating time-to-deliver, (2) determining reachability, and (3) determining traceability. The time-to-deliver an IP (or any component data) is defined as the time to completely generate the IP (or component data) from any other processing stage in the IPMAP. It is often necessary to estimate the time it takes for some work-in-process (component data) to move from some intermediate stage in the IPMAP to a different stage in the same IPMAP. Consider a case where a required component data is unavailable resulting in an unacceptable product quality. Decision-makers may consider substitutes to increase product quality to acceptable levels. They can now evaluate the alternatives to identify the most suitable one based on time constraints. To facilitate this, the IPMAP supports metadata that defines the processing time associated with each stage in the IPMAP. The processing time can be a deterministic value or stochastic based on some distribution. Using these time-tags, time-to-deliver may be estimated using proven operations management techniques such as the Critical Path Method (CPM) or the Project Evaluation and Review Technique (PERT) (details in appendix).Reachability in IPMAP is the ability to identify all production stages of an IP that can be reached from a (any) given stage in the IPMAP. Stage y is reachable from stage x if there is a defined sequence of stages that constitute a path from x to y in the IPMAP corresponding to that IP. Reachability plays an important role in identifying impacts of quality errors. For example, if a data unit at some stage in the IPMAP is of poor quality it would affect all the stages in the manufacture of one or more IPs that are “reachable” from this stage. To implement reachability we first map the IPMAP onto its corresponding graph, IP-graph. The IP-graph is a directed graph. Each stage in the IPMAP is represented as a node in its corresponding graph. At this time we do not distinguish between the different types of blocks in the IPMAP. Each flow in the IPMAP from one stage (start) to another (end) is represented as a link between the two corresponding nodes in the graph with the associated direction. Given any IPMAP I, it can now be represented as an IP-graph G (N, L). Each node n∈∈∈∈N represents a block in I, and each link l∈∈∈∈ L is defined by the ordered pair (x, y) where x, y ∈∈∈∈ N. This mapping process generates a mapping set P. Each member of P is an ordered-pair <b, n> where b ∈∈∈∈ I, n ∈∈∈∈G. Associated
algorithm for implementing it are provided in the appendix.
Traceability in the IPMAP is defined as the
ability to identify (trace) a sequence of one or more stages that precede any stage. The administrator/decision-maker can trace the source of a quality error in an IP to one or more preceding steps in its manufacture. The individual /role /department responsible can be identified using the metadata associated with each stage. This permits implementing quality-at-source, an integral part of TDQM. All of the above capabilities for TDQM can be implemented on the IPMAP using graph-based algorithms. Proofs of correctness and implementation are shown in the appendix.
Benefits of the DQ Framework
T
he framework proposed is for proactively managing data quality in a data warehouse. It defines the metadata requirements for managing data quality and then proposes a representation scheme, the IPMAP, for capturing and communicating these requirements to the decision-makers. We also show how this quality-related metadata supplements the existing metadata in a DW. This framework assists an organization implement TDQM in a in a warehouse by offering several capabilities. First it helps warehouse administrators represent and visualize the manufacture of not just the warehouse but also the products (analytical reports) generated from it. The representation offers a convenient tool for communicating the metadata (on quality, sources, and manufacturing processes) to the makers. It permits decision-makers evaluate data quality along accuracy, completeness, and timeliness and also gauge source-credibility. This, in turn, will improve the usability of the warehouse, or at the least, help administrators pinpoint the causes of data quality problems and effectively target remedial measures. It facilitates the implementation of several capabilities such as traceability, reachability, and time-to-deliver, all of which are necessary for TDQM.The specific questions that need to be answered to evaluate the usefulness of this framework are: (1) does the ability to view information about the “manufacture” of the decision-product impact the (perceived) quality of decisions made using that product? (2) Does the ability to evaluate product quality using quality dimensions impact the (perceived) quality of the decisions made? (3) Can the data quality evaluated using this framework be used as a measure for understanding the performance of a DW? The framework is incorporated into a prototype decision support system (IPView) for managing data quality. IPView supports a GUI that permits decision-makers to
create and visualize the IPMAP(s) and access to the metadata associated with each stage. IPView is being used to evaluate the usefulness of this framework and to answer the questions listed earlier. The preliminary evaluation indicates that it is more useful to certain types of decision-makers (experts more than novices) and is more used for certain types of decision-tasks (more involved/data-intensive compared to simple). In such tasks, the provision of the IPMAP or process metadata (data about the “manufacture” of the product) does have an impact on the outcome of the decision-task. This effect does not appear to be direct but seems to be mediated by the efficiency of the decision-process. The initial findings also indicate that the provision of quality metadata (impartial measurements of data quality along data quality dimensions) has a positive impact on the decision-outcome, though the link does not appear as strong as its counterpart, process metadata. These findings appear to support the need for decision-makers to gauge quality using contextual factors and process metadata does play a role in this evaluation process. It is also evident from our preliminary findings that the two pieces of metadata as a set has a stronger influence on the outcome of the decision-task than either of them, individually. These findings are yet to be confirmed.
REFERENCES
[1] Ballou, D., P., Wang, R. Y., Pazer, H., & Tayi, G., K, (1998). Modeling Information Manufacturing Systems to Determine Information Product Quality. Management Science, 44(4), 462-484
[2] Helfert, M. and von Maur E. (2001), A Strategy for Managing Data Quality in Data Warehouse Systems, In the Proceedings of the International Conference on Information Quality, 2001, Boston, MA.
[3] Hernadez, M. A., & Stolfo, S. J. (1998). Real-world Data is Dirty: Data Cleansing and the Merge/Purge Problem. Journal of Data Mining and Knowledge Discovery, 1(2).
[4] Iverson, Dane S. (2001), Meta-Information Quality – Keynote Address in the International Conference on Information Quality by the Senior VP Enterprise Information Solutions –Ingenix, Boston, MA. [5] Jarke, M., Jeusfeld, M., Quix, C., & Vassiliadis, P.
(1999) – Architecture and Quality in Data Warehouses: An Extended Repository Approach, Information Systems, Vol. 24, No. 3, pp. 229-253 [6] Kahn, B. K., Strong, D. M., & Wang, R. Y. (2002).
Information Quality Benchmarks: Product and Service Performance. Communications of the ACM, 45(4), 184-192.
[7] Lee, T., Bressen, S., & Madnick, S. (1998). Source Attribution for Querying Against Semi-structured Documents. Paper presented at the Workshop on Web Information and Data Management, ACM Conference on Information and Knowledge Management
[8] Morey, R. C. (1982). Estimating and Improving the Quality of Information in the MIS. Communications of the ACM, 25(5), 337-342. [9] Neely, M. P. (2001). A Proposed Framework for
the Analysis of Source Data in a Data Warehouse, In the Proceedings of the International Conference on Information Quality, 2001, Boston, MA.
[10] Parssian, A., Sarkar, S., and Jacob, V. S. (1999). Assessing Data Quality for Information Products. Proceedings of the International Conference on Information Systems, 1999, Charlotte, North Carolina
[11] Redman, T. C. (Ed.). (1996). Data Quality for the Information Age. Boston, MA: Artech House. [12] Shankaranarayanan, G., Wang, R. Y., and Ziad, M.
(2003). Managing Data Quality in Dynamic Decision Environments: An Information Product Approach. Journal of Database Management, 14(4), October-December 2003
[13] Wang, R. Y., Lee, Y. W., Pipino, L. L., and Strong, D. M. (1998) Manage Your Information as a Product, Sloan Management Review, 39(4), Summer 1998.
Acknowledgements
This research was funded in part by Boston University Institute for Leading in the Dynamic Economy (BUILDE).
AUTHOR BIOGRAPHY
G. Shankaranarayanan obtained his Ph.D. in Management Information Systems from The University of Arizona and is an assistant professor in the Information Systems Department in Boston University School of Management. His research areas include schema evolution in databases, heterogeneous and distributed databases, data modeling requirements and methods, and structures for and the management of metadata. Specific topics in metadata include metadata implications for data warehouses, metadata management for knowledge management systems/architectures, metadata management for data quality, and metadata models for mobile data services. His work has appeared in Decision Support Systems, Journal of Database Management, and in the Communications of the ACM.