NASA/TM-2006-
214319
Wind Tunnel Application of a Pressure-Sensitive
Paint Technique to a Double Delta Wing Model
at Subsonic and Transonic Speeds
Gary E. Erickson
Langley Research Center, Hampton, Virginia Hugo A. Gonzalez
Naval Air Systems Command, Patuxent River, Maryland
The NASA STI Program Office ... in Profile Since its founding, NASA has been dedicated to
the advancement of aeronautics and space science. The NASA Scientific and Technical Information (STI) Program Office plays a key part in helping NASA maintain this important role.
The NASA STI Program Office is operated by Langley Research Center, the lead center for NASA’s scientific and technical information. The NASA STI Program Office provides access to the NASA STI Database, the largest collection of aeronautical and space science STI in the world. The Program Office is also NASA’s institutional mechanism for disseminating the results of its research and development activities. These results are published by NASA in the NASA STI Report Series, which includes the following report types:
• TECHNICAL PUBLICATION. Reports of completed research or a major significant phase of research that present the results of NASA programs and include extensive data or theoretical analysis. Includes
compilations of significant scientific and technical data and information deemed to be of continuing reference value. NASA counterpart of peer-reviewed formal professional papers, but having less stringent limitations on manuscript length and extent of graphic presentations.
• TECHNICAL MEMORANDUM.
Scientific and technical findings that are preliminary or of specialized interest, e.g., quick release reports, working papers, and bibliographies that contain minimal annotation. Does not contain extensive analysis.
• CONTRACTOR REPORT. Scientific and technical findings by NASA-sponsored contractors and grantees.
• CONFERENCE PUBLICATION. Collected papers from scientific and technical conferences, symposia,
seminars, or other meetings sponsored or co-sponsored by NASA.
• SPECIAL PUBLICATION. Scientific, technical, or historical information from NASA programs, projects, and missions, often concerned with subjects having substantial public interest.
• TECHNICAL TRANSLATION. English-language translations of foreign scientific and technical material pertinent to
NASA’s mission.
Specialized services that complement the STI Program Office’s diverse offerings include creating custom thesauri, building customized databases, organizing and publishing research results ... even providing videos.
For more information about the NASA STI Program Office, see the following:
• Access the NASA STI Program Home Page at http://www.sti.nasa.gov
• E-mail your question via the Internet to [email protected]
• Fax your question to the NASA STI Help Desk at (301) 621-0134
• Telephone the NASA STI Help Desk at (301) 621-0390
• Write to:
NASA STI Help Desk
NASA Center for AeroSpace Information 7121 Standard Drive
NASA/TM-2006-
214319
Wind Tunnel Application of a Pressure-Sensitive
Paint Technique to a Double Delta Wing Model
at Subsonic and Transonic Speeds
Gary E. Erickson
Langley Research Center, Hampton, Virginia Hugo A. Gonzalez
Naval Air Systems Command, Patuxent River, Maryland
National Aeronautics and Space Administration Langley Research Center Hampton, Virginia 23681-2199
Acknowledgements
The authors would like to thank Dr. Blair B. McLachlan and Dr. James H. Bell of NASA Ames Research Center for their contributions that led to the establishment of a pressure-sensitive paint system at the NASA LaRC 8-Foot TPT. Their assistance in the definition, installation, and operation of the PSP system and the provision of the PAINTCP image processing software are greatly appreciated and respectfully acknowledged.
The authors would also like to thank the PSP team headed by Mr. Clifford J. Obara at NASA LaRC, who provided technical assistance throughout the PSP testing at 8-Foot TPT. In particular, the contributions of Mr. Amir J. Jagharghi, Mr. B. Scott Sealey, Mr. Cecil G. Burkett, and Mr. Bradley D. Leighty are acknowledged with gratitude.
Special thanks are extended to the research and technical staff assigned to the 8-Foot TPT who supported the PSP testing in 1994 and, in particular, to Mr. Brent L. Bates and Mr. Sean M. Britton, who served as PSP system specialist and lead technician, respectively. Their professionalism and support are appreciated and respectfully acknowledged.
Available from:
NASA Center for AeroSpace Information National Technical Information Service
7121 Standard Drive 5285 Port Royal Road
Hanover, MD 21076-1320 Springfield, VA 22161
Abstract
A pressure-sensitive paint (PSP) technique was applied in a wind tunnel experiment in the NASA Langley Research Center 8-Foot Transonic Pressure Tunnel to study the effect of wing fillets on the global vortex-induced surface static pressure field about a sharp leading-edge 76o/40o double delta wing, or strake-wing, model at subsonic and transonic speeds. Global calibrations of the PSP were obtained at M∞= 0.50, 0.70, 0.85, 0.95, and 1.20, a Reynolds number per unit length of 2.0 million, and angles of attack from 10 degrees to 20 degrees using an in-situ method featuring the simultaneous acquisition of electronically-scanned pressures (ESP) at discrete locations on the model. The mean error in the PSP measurements relative to the ESP data was approximately 2 percent or less at M∞= 0.50 to 0.85 but increased to several percent at M∞=0.95 and 1.20. The PSP pressure distributions and pseudo-colored, planform-view pressure maps clearly revealed the vortex-induced pressure signatures at all Mach numbers and angles of attack. Small fillets having parabolic or diamond planforms situated at the strake-wing intersection were respectively designed to manipulate the vortical flows by removing the leading-edge discontinuity or introducing additional discontinuities. The fillets caused global changes in the vortex-dominated surface pressure field that were effectively captured in the PSP measurements. The vortex surface pressure signatures were compared to available off-surface vortex cross-flow structures obtained using a laser vapor screen (LVS) flow visualization technique. The fillet effects on the PSP pressure distributions and the observed leading-edge vortex flow characteristics were consistent with the trends in the measured lift, drag, and pitching moment coefficients.
Introduction
Pressure-sensitive paint (PSP) is an optical-based technique that is frequently used for global surface static pressure measurements in wind tunnel testing of atmospheric flight and ground-based vehicle configurations. References 1 and 2 describe some of the early applications of PSP for field measurements in aerodynamic testing. A PSP system based on the work described in reference 2 was established in the NASA Langley Research Center (NASA LaRC) 8-Foot Transonic Pressure Tunnel (8-Foot TPT) in 1994. Reference 3 describes an application of the 8-Foot TPT PSP system in mid-1994 featuring a scientific-grade digital camera to measure the surface static pressures on a slender, faceted missile model. The current report summarizes the results obtained in early 1994 using a
developmental system with a conventional video camera in which the vortex-induced surface pressure field was imaged on a sharp leading-edge, 76o/40o double delta wing model. The primary objectives of this experiment were two-fold: (1) to develop experience in the application of a global pressure measurement system in a transonic testing environment and (2) to manipulate the vortex flows about a generic double delta wing with small fillets located at the leading-edge sweep discontinuity. The latter objective is based on the belief that affecting the vortex shedding process at the wing planform juncture offers potential control of the vortex trajectories, mutual interactions, and breakdown characteristics. The topology of the vortex-dominated flow field about the 76o/40o double delta wing model is applicable to atmospheric flight vehicles that develop vortical flows in
and take-off and landing. Reference 4 provides a review of some of the more recent fundamental studies of double-delta wing vortex flows, including experimental and computational studies of the current 76o/40o double delta wing geometry with baseline, parabolic, and diamond planform fillets. The present investigation was part of a cooperative vortex flow research program initiated in the 1990’s involving NASA Langley Research Center in Hampton, Virginia and the United States Naval Air Warfare Center in Warminster, Pennsylvania (now consolidated with the Naval Air Systems Command). PSP, ESP, six-component forces and moments, and laser vapor screen flow visualization results are summarized in Reference 4 in which the 76o/40o double delta wing model was tested with baseline, linear, parabolic, and diamond fillets at subsonic speeds in the NASA Langley Research Center 7- by 10-Foot High Speed Tunnel. This cooperative investigation was extended to transonic speeds in two experiments performed in the 8-Foot TPT. The first experiment, designated Test 1052, featured the acquisition of ESP and six-component force and moment measurements on the unpainted model with the full inventory of linear, parabolic, and diamond fillets. Laser vapor screen (LVS) flow visualization was also conducted on the model with baseline fillet at the transonic Mach numbers. The second experiment, designated Test 1060, focused on PSP applications to the baseline double delta wing model and a selected fillet from each of the parabolic and diamond families. The results from Test 1060 are the subject of the current report, which focuses on the global calibrations of the PSP using discrete measurements from an onboard ESP module; comparison of the calibrated PSP distributions obtained on the baseline, parabolic, and diamond fillets; comparison of the pressure distributions with available LVS images from Test 1052 and from reference 4; and correlation of the PSP surface pressure measurements and LVS images with the trends in the model lift, drag, and pitching moment coefficients. It is noted that the PSP system used in the 8-Foot TPT was transferred to the NASA LaRC Unitary Plan Wind Tunnel (UPWT) upon the closure of the
former facility in 1995. Consequently, the description of the PSP system presented herein provides relevant historical material on the upgraded system currently in use at UPWT. Details of the UPWT PSP system are provided in reference 5.
Nomenclature
b reference span, 16.325 inches
c reference chord, 16.000 inches p
C
upper surface static pressure coefficient,(
p−p∞)
q∞v p
C
, vacuum pressure coefficient,−
2
γ
M
∞2*
p
C pressure coefficient corresponding to the local speed of sound,
(
)
⎪⎭
⎪
⎬
⎫
⎪⎩
⎪
⎨
⎧
−
⎥
⎦
⎤
⎢
⎣
⎡
+
+
−
∞ ∞1
1
2
1
2
2 3.5 2γ
γ
γ
M
M
( ) p PSP C PSP pressure coefficientESP electronically-scanned pressure i
ESP
pressure measurement ati
thorificeLVS laser vapor screen
∞
M free-stream Mach number
MRC moment reference center, M.S. 11.723
M.S. model station, inches
N number of ESP taps
p
local static pressure, pounds per square foot (psf)0
p
stagnation pressure, psf∞
p free-stream static pressure, psf
PSP pressure-sensitive paint i
PSP
pressure measurement at PSP pixel location corresponding toi
th ESP calibration orifice∞
q free stream dynamic pressure, psf
Re Reynolds number per foot
s local semispan measured from the wing centerline to the leading edge, inches ref
S
reference area, 111.178 square inches0
T
stagnation temperature, degrees Fahrenheitx local axial distance measured along the wing centerline chord from the wing apex, inches
y local semispan distance measured from the wing centerline, positive to the right, inches
α angle of attack, degrees
ε mean relative error, percent
γ
ratio of specific heatsModel Description and Test
Apparatus
The model used in this test was a generic double delta wing configuration that was designed and fabricated for surface pressure and force and moment testing in subsonic and transonic wind tunnel facilities. The 0.375-inch-thick stainless steel wing featured a flat upper surface and sharp, beveled leading, side, and trailing edges. The leading-edge sweep angles of the highly-swept forward section, or strake, and the main wing panel were 76o and 40o, respectively. A fiberglass housing was attached to the lower surface of the wing and served as a protective cover for the electronically-scanned pressure and six-component strain-gage balance instrumentation. Planview and sideview illustrations in figures 1 and 2 show the dimensional details of the model with the baseline fillet. The moment reference center (MRC) was located at M.S. 11.723, or 73.27 percent of the wing centerline chord. The MRC location coincided with that used in references 6 and 7 on a similar double delta wing planform. Three series of strake-wing intersection fillet shapes were fabricated to manipulate the double delta wing vortex flows and were categorized based on planform: linear, parabolic, and diamond. The linear and diamond fillets added additional leading-edge discontinuities, from which additional vortices were expected to originate, while the parabolic fillets removed the strake-wing junction discontinuity. Three fillet sizes based on the total fillet area (left and right fillets) expressed as a percentage of the model reference area were fabricated: 0.5%, 1%, and 2.5% for linear and diamond, and 0.5%, and 1% for parabolic. (A 2.5% parabolic fillet was
and 4 contain the geometry details of the 1% parabolic and diamond fillets. The 1% parabolic and diamond fillets were selected for the PSP experiment, since previous experience (ref. 4) indicated that these fillet shapes, considered with the baseline configuration, would provide three distinctly-different flow fields and, therefore, serve as reasonable benchmarks to assess the PSP effectiveness. The photographs in figures 5 and 6 show the model installed in the wind tunnel test section, and figure 7 is a close-up photograph of the model lower surface and the fiberglass instrumentation housing. A photograph of the model with PSP coating applied to the upper surface is presented in figure 8.
The model incorporated a total of 47 static pressure orifices having 0.012-inch diameter distributed in three spanwise rows on the wing upper surface. The three rows were on the left-hand side of the wing at nondimensional axial locations, x/c, of 0.25, 0.75, and 0.90, which correspond, respectively, to 25%, 75%, and 90% of the distance, x, measured from the apex along the wing centerline chord, c. The orifice nondimensional semispan location, y/s, is expressed in terms of the semispan distance, y, measured from the wing centerline divided by the wing local semispan, s. Consequently, y/s
values of 0.0 and –1.0 correspond to the wing centerline and the left wing leading edge, respectively. Listings of the pressure orifice locations at the three measurement stations are provided in Tables I, II, and III.
The model surface pressures were measured using a single internally-mounted, 48-port ESP module. The shape of the lower surface instrumentation housing was dictated by the volumetric requirements of the ESP module and its electronics cable; the ESP calibration and reference lines; and the bundle of flexible tubing that jumpered the 47 stainless steel pressure lines from the model to the slant-line tubing on the ESP module head. The ESP module was a 10 pounds per square inch differential (psid) pressure transducer which was referenced to the tunnel plenum pressure. Full on-line
calibrations of the ESP transducers were performed at each change in the free-stream Mach number. The manufacturer-specified uncertainty in the pressure measurement as a percent of full-scale was +/-0.05 percent for the 10 psid module. The mean error in the PSP pressure measurements relative to the ESP data and PSP error bands corresponding to 95% confidence intervals are presented in the Discussion of Results section.
Port M.S., in. x/c y, in. y/s
1 4.0 0.25 0.0 0.0 2 4.0 0.25 -0.1 -0.1 3 4.0 0.25 -0.2 -0.2 4 4.0 0.25 -0.4 -0.4 5 4.0 0.25 -0.5 -0.5 6 4.0 0.25 -0.6 -0.6 7 4.0 0.25 -0.7 -0.7 8 4.0 0.25 -0.8 -0.8 9 4.0 0.25 -0.9 -0.9
Table I. Pressure orifice locations at x/c=0.25.
Port M.S., in. x/c y, in. y/s
10 12.0 0.75 0.0 0.0 11 12.0 0.75 -1.285 -0.2 12 12.0 0.75 -1.927 -0.3 13 12.0 0.75 -2.184 -0.34 14 12.0 0.75 -2.441 -0.38 15 12.0 0.75 -2.698 -0.42 16 12.0 0.75 -2.955 -0.46 17 12.0 0.75 -3.212 -0.50 18 12.0 0.75 -3.468 -0.54 19 12.0 0.75 -3.725 -0.58 20 12.0 0.75 -3.982 -0.62 21 12.0 0.75 -4.239 -0.66 22 12.0 0.75 -4.496 -0.70 23 12.0 0.75 -4.753 -0.74 24 12.0 0.75 -5.010 -0.78 25 12.0 0.75 -5.267 -0.82 26 12.0 0.75 -5.524 -0.86 27 12.0 0.75 -5.781 -0.90 28 12.0 0.75 -6.038 -0.94
Table II. Pressure orifice locations at x/c=0.75.
Port M.S., in. x/c y, in. y/s
29 14.0 0.90 0.0 0.0 30 14.0 0.90 -1.633 -0.2 31 14.0 0.90 -2.449 -0.3 32 14.0 0.90 -2.775 -0.34 33 14.0 0.90 -3.102 -0.38 34 14.0 0.90 -3.428 -0.42 35 14.0 0.90 -3.755 -0.46 36 14.0 0.90 -4.082 -0.50 37 14.0 0.90 -4.408 -0.54 38 14.0 0.90 -4.735 -0.58 39 14.0 0.90 -5.061 -0.62 40 14.0 0.90 -5.388 -0.66 41 14.0 0.90 -5.714 -0.70 42 14.0 0.90 -6.041 -0.74 43 14.0 0.90 -6.367 -0.78 44 14.0 0.90 -6.694 -0.82 45 14.0 0.90 -7.020 -0.86 46 14.0 0.90 -7.347 -0.90 47 14.0 0.90 -7.673 -0.94
Table III. Pressure orifice locations at x/c=0.90.
Transition grit was not applied to the model, since the flow was assumed to separate at the sharp leading edges at all conditions of interest in the current experiment. In addition, a suitable gritting strategy based on the criteria in reference 8 to cause transition of the boundary layer associated with vortex-induced reattached flow on the wing upper surface has not been established. Reference 9 summarizes many of the challenges associated with transition grit applications for high angle-of-attack experimentation.
The model was instrumented with an internally-mounted, strain-gage balance to measure the six force and moment components. An adapter block was mounted to the wing lower surface to allow the installation of the balance. The rearward extent of the instrumentation housing was based on a requirement to shield the entire length of the balance during wind-on conditions. Balance and ESP measurements were obtained simultaneously with the PSP image acquisition. Numerous check loads were applied at prescribed locations on the model using a
hand-held force gage or calibrated weights to verify that the ESP electronics cable and reference and calibration lines that spanned the balance were not affecting the balance output.
Balance chamber pressures were not recorded and, consequently, the axial force was not corrected to a condition of free-stream static pressure acting over the model chamber area. Corrections for test section flow angularity were not applied, since previous testing of models of comparable size in the 8-Foot TPT indicated these effects to be negligible. Blockage and wall interference corrections were not applied to the test data because of the relieving effect of the test section slots.
Wind Tunnel Facility and Test
Conditions
The investigation was conducted in the NASA LaRC 8-Foot TPT. This wind tunnel facility was designed for operation as a continuous-flow, closed-return, variable-pressure wind tunnel with control capability to independently vary Mach number, stagnation pressure, stagnation temperature, and humidity. The test section was square with corner fillets and a cross-sectional area approximately equivalent to that of an 8-foot-diameter circle. The top and bottom walls of the test section were axially slotted to permit a continuous variation of the test section Mach number from 0.2 to 1.2; the slot-width contour provided a gradient-free test section 50 inches long for Mach numbers equal to or greater than 1, and 100 inches long from Mach numbers less than 1. The stagnation pressure could be varied from 0.25 to 2 atmospheres. Reference 10 provides a detailed description of the 8-Foot TPT. Note that this facility was permanently closed in 1995.
The PSP testing was performed at free-stream Mach numbers of 0.50, 0.70, 0.85, 0.95, and 1.20 at a Reynolds number of 2.0 million per foot and a stagnation temperature of 80 degrees Fahrenheit. The ESP measurements and the processed PSP images that are presented in
this report were acquired at angles of attack from 10 degrees to 20 degrees in 2-degree increments at all Mach numbers. The test conditions are summarized in Table IV. The model angle of attack and angle of sideslip were determined via appropriate Euler angle transformations using the output from an accelerometer mounted in the base of the main sting support, output from a potentiometer installed in a yaw coupler mechanism, and angular deflection of the model, balance, and sting support system determined from pre-test calibrations.
The majority of the LVS flow visualization images that are presented in this report were obtained in 8-Foot TPT Test 1052. Flow visualization was performed only on the unpainted double delta wing model with baseline fillet at M∞= 0.85, 0.95, and 1.20. LVS flow visualization was not conducted at
∞
M = 0.50 and 0.70, since the estimated amount of water injection to promote local condensation of water vapor in the 8-Foot TPT test section was prohibitive. LVS flow visualization results obtained on the model with baseline, 1% parabolic, and 1% diamond fillets in reference 4 in the NASA LaRC 7- by 10-Foot High Speed Tunnel at M∞= 0.50 and 0.70 are also presented. The tunnel stagnation pressure was set by atmospheric conditions in this facility. The corresponding Reynolds numbers at
∞
M = 0.50 and 0.70 were approximately 3.0 million per foot and 3.6 million per foot, respectively. ∞ M q∞ (psf) ∞ p (psf) 0
p
(psf)Re
(10
−6) 0T
(0F
) 0.50 206 1175 1398 2.0 80 0.70 273 793 1102 2.0 80 0.85 314 619 995 2.0 80 0.95 337 532 953 2.0 80 1.20 379 375 913 2.0 80Table IV. Test conditions for the double delta wing model experiment in the NASA LaRC 8-Foot TPT.
Experimental Techniques
Pressure-Sensitive Paint Technique
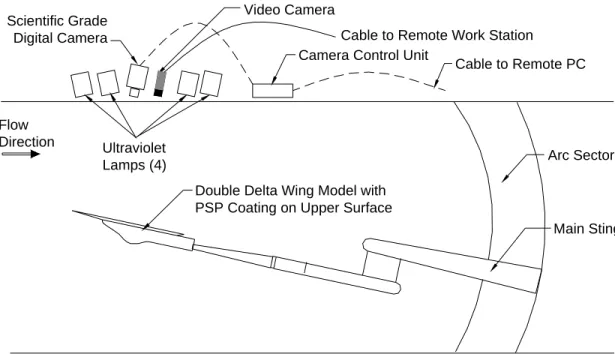
The PSP method is based on the oxygen-quenching characteristics of certain luminescent materials. The emitted light intensity varies inversely with the local oxygen partial pressure and, therefore, the air pressure, since oxygen is a fixed mole fraction of air. A PSP formulation typically consists of three components. The luminescent material (luminophore) is the sensor component. For oxygen quenching to occur, the luminophore must be soluble in a suitable binder material. Finally, a compatible solvent is used for the application of the paint, via a spray gun, to the test article. Prior to the paint application, the model surface is primed with white paint. The white undercoat to the PSP coating serves a critical function in that it amplifies the PSP emission signal (reference 2). Certain characteristics of PSP coatings induce measurement error: photodegradation and temperature sensitivity. Specifically, the emission response of the PSP decreases with time of exposure to the excitation radiation, and the luminescence intensity is sensitive to changes in the temperature. A formulation that was successfully applied at the 8-Foot TPT was designated IEMA/PtT(PFP)P, which used a proprietary University of Washington copolymer (IEMA). Laboratory calibrations at LaRC indicated that the Stern-Volmer characteristics (reference 2) were very linear, and photodegradation was reduced compared to prior-generation paints. This formulation was not the most advanced in use by other facilities at that time; however, it proved a robust and responsive formulation for use at the low static pressures typical of the transonic testing at the 8-Foot TPT.The intensity of the light emitted by the PSP is proportional to the excitation light that is absorbed. A stable illumination source must be used that is tailored to the absorption wavelength band of the PSP coating. Ultraviolet long wave (365 nm), 250-watt lamps connected to a regulated power supply were used in continuous mode to provide the illumination source in the
8-Foot TPT system. The optical filters attached to these lamps allowed passage of light at the absorption wavelength of the coating but prevented transmission of light at the luminescence wavelengths that could compromise the images acquired by the PSP camera. Figure 9 presents a simplified sketch of the main components of the 8-Foot TPT PSP system.
Electronic CCD imaging devices of two types were used in Test 1060: conventional video and scientific grade digital cameras. The PSP system in use at 8-Foot TPT at the time of this test featured an 8-bit resolution image acquisition and processing system using a standard NTSC format video camera. The PSP pressure distributions that are presented in this report were obtained using this camera. A second system featuring a thermoelectrically-cooled CCD digital camera of 14-bit resolution and 1024 x 1024 pixel array was installed in parallel with the 8-Foot TPT hardware. This system was independently operated by personnel from an instrumentation research organization at NASA LaRC and provided an initial evaluation of a superior camera having low noise, excellent linear response, and good signal-to-noise ratio. The conventional video cameras continued to be used as monitoring devices in later tests with an 8-Foot TPT PSP system that was upgraded with a scientific-grade digital camera. In this capacity, the standard video cameras had the advantage of providing real-time viewing of the PSP response to aerodynamic flow changes induced, for example, by vortices and shock waves.
A dark-level correction was applied to all wind-off and wind-on images to subtract out the CCD dark current and “noise” of the overall imaging system. Optical filters centered about 650 nm were installed on the conventional video and scientific-grade digital cameras to permit the passage of the luminescence emission wavelengths, while preventing the transmission of the excitation light source wavelengths to the acquisition cameras. The incursion of extraneous sources of light from the plenum area
into the test section was prevented by turning off all light sources within the plenum and sealing all optical view ports into the plenum with “light-tight” coverings.
Acquisition of the PSP images using the conventional video system was controlled by a high-end workstation in the 8-Foot TPT control room. A personal computer (PC) with a proprietary interface was used to control the scientific-grade digital camera system. The cable run length between the host computers and the cameras installed above the test section was approximately 100 feet. The power supply for the conventional video and the electronic control and liquid cooling units for the digital camera were positioned in proximity to the cameras. Consequently, the primary imaging system components were exposed to the low-pressure environment in the plenum chamber surrounding the test section. PSP images were stored on the workstation hard disk and on a high-capacity optical disk on the PC for off-line processing and archiving. Image processing and paint calibrations were performed primarily on the workstation using the software package described in reference 11 and referred to as PAINTCP. The images that were obtained with the digital camera were in a proprietary format that was incompatible with PAINTCP. Consequently, a developmental version of a PC-based PSP image processing application described in reference 12 was used to provide higher-quality pseudo-colored ratioed images. These qualitative results from the digital camera supplement the calibrated PSP pressure distributions derived from the conventional video camera that are presented in this report.
Optical access to the 8-Foot TPT test section was provided by several schlieren windows on both sidewalls and three identical 4-inch wide by 16-inch long optical-quality windows positioned along the centerline of the test section ceiling. The imaging cameras and ultraviolet light sources were installed in the test section ceiling in order to image the upper surface of the double delta wing model at high angles of attack. Thermally-controlled enclosures were used to
safeguard the imaging cameras. Temperature control within the enclosures was achieved by vortex-tube coolers attached to each unit. Coolers were also installed to the four UV lamp heads to avoid temperature-induced damage to the electronic circuitry that might occur in the low-pressure environment within the plenum region. In addition, vortex coolers were used to provide cooling air along the optical windows to avoid thermal stresses induced by the UV lamps, which were in proximity to the window surface. A total of four 250-watt UV lamps were installed along the ceiling centerline, two in front of and two behind the imaging cameras. Metal shields were placed between the cameras and lamps to prevent electromagnetic interference that could damage the camera’s sensitive electronic components. This situation might arise as the result of power cycling of the UV lamps while the cameras were operational. Previous testing experience at the 8-Foot TPT indicated the vibration level within the ceiling region was sufficiently low so that preventative measures for safe operation of the digital camera were unnecessary. The imaging and illumination devices were attached to regulated power sources, which could be independently controlled (on/off) from the wind tunnel control room. A partial view of the complex hardware installation on top of the wind tunnel test section is revealed in the photograph in figure 10. The host computer system used to control the conventional video camera is shown in figure 11.
The paint application and curing process required one working shift to complete. This operation required a skilled painter equipped with protective gear, including full face mask and a continuous air supply. The double delta wing model was instrumented with discrete surface static pressure orifices plumbed to an internal, 10 psid ESP module. The pressure rows were masked off with 0.10-inch wide tape during the painting process, since an ESP module with purge air capability was not available at the time of this experiment. Approximately 4 hours were required for the curing of the base coat, and a comparable period
of time was allotted after the PSP coating was applied. The PSP image registration process required that reference marks, or control points, be placed on the model. The locations of these registration marks were defined by placing on the fully-cured PSP coating a transfer sheet containing a 1:1 scale drawing of the double delta wing with pre-punched holes. After the hole centers were marked, the template was removed and black dots were drawn on the model using a plastic circle template and marker pen. Latex gloves were worn during this process to avoid contamination of the PSP coating.
Wind-off images were acquired at several angles of attack with the test section pumped down to a low pressure of approximately 300 psf. This condition was more representative of the static pressure levels that existed on the painted model during wind-on runs, and it provided an opportunity to define a suitable integration time for the PC-based digital camera system.
Wind-on data acquisition consisted of the discrete pressures measured from the ESP taps and the PSP images at the desired angles of attack. Full on-line calibrations of the ESP modules were performed at each change in the Mach number, since the acquisition of high-quality ESP data was essential to the in-situ PSP calibrations performed during the off-line image processing. The PSP illumination sources could not be shielded during the transitional phases of tunnel operation such as Mach number and angle of attack changes and ESP calibrations. Consequently, run times were kept to a minimum in order to limit the overall exposure time of the PSP coating. PSP image acquisition was performed independently of the data acquisition performed by the wind tunnel host computer. The test conditions, ESP data, and other parameters were obtained off-line for use in input files required by the PSP image processing software. A repeat set of wind-off images and dark images were acquired after the wind-on runs. Comparisons of the initial and final wind-off pixel intensities at the same camera integration times provided an indication
of the level of photodegradation that had occurred.
Image processing featured the subtraction of the dark image from the wind-off and wind-on images, identification of wind-off and wind-on control points, image registration and ratioing, resection transform, and global calibration. Registration, or spatial alignment, of the two model images was performed to correct for nonalignment caused by model motion. Wing deformation was assumed to be negligible A second-order biquadratic transform was used to align the wind-on and wind-off images. This process depended on finding the respective registration marks, which were used to determine the transform coefficients. The wind-off and wind-on intensity field images were ratioed, and the intensity field of the resultant image was proportional to pressure (Stern-Volmer relation). A resection transform based on photogrammetry techniques was performed next, which related each point in the final intensity ratio image plane to a corresponding point on the model surface. The effectiveness of this transform depended on an accurate determination of the spatial locations of the model registration marks. The image mapping performed in this experiment was exclusively a 2-D plane view representation of the double delta wing model. Quantification of the pressure field in the final intensity ratio image required a calibration of the paint to determine the Stern-Volmer sensitivity coefficients. An “in situ” calibration method was applied, where the paint intensity was calibrated from the pressure tap data at spatially corresponding locations. The in-situ calibration process was iterative, since the first pass through the calibration rarely provided a completely satisfactory global match between the ESP and PSP pressure data. Because of the masking approach that was used during the paint process, the paint could not be calibrated at pixel locations adjacent to the pressure orifices. This required that the PSP image pixel locations used for calibration be offset from the orifices. In some instances, apparent nonuniformity of the paint thickness near the masking lines required additional offsets during the calibration procedure.
Laser Vapor Screen Technique
The vapor screen method of flow visualization has been used in wind tunnel testing for several decades to visualize vortices, vortex sheets, lines of flow separation and reattachment, and shock waves at subsonic, transonic, and supersonic speeds. Water is injected in sufficient quantity into the tunnel circuit, typically downstream of the supersonic nozzle or the diffuser section, to cause condensation of water vapor in the test section. At supersonic speeds, the temperature drop from the expansion in the supersonic nozzle causes the water vapor to condense into a fine fog. A laser is often used to produce an intense sheet of light that is projected into the test section in a plane perpendicular to the longitudinal axis of the tunnel or to the body axis of the model. The distribution of condensed water vapor and, consequently, the amount of scattered light within the plane of the light sheet is affected by the flow disturbances created by the model. This phenomenon permits the observation and documentation of vortex cross sections, for example, at high angles of attack. Condensation first appears in the free stream at supersonic speeds, so the vortical flows appear as dark regions in the absence of scattered light surrounded by a light background. At subsonic and transonic speeds, condensed water vapor generally first appears near the central region of the vortices, so the vortex cross sections appear as light regions within a darker background. A combination of the two light-scattering patterns often occurs at transonic speeds.
A fiber-optic-based laser vapor screen (LVS) system was established in the 8-Foot TPT in 1990 (reference 13) to visualize the vortex-dominated flow fields about small-scale models of fighter aircraft, commercial transport airplanes, and missiles at subsonic and transonic speeds. A simplified sketch of the 8-Foot TPT system is shown in figure 12, and a detailed description of this system is provided in reference 13. A fiber optic cable delivered a beam from an argon laser located outside the tunnel plenum to a light sheet optics package located in the ceiling of the test section. The
optics package occupied the same region required by the PSP hardware, so the setup of the two techniques was mutually exclusive in this facility. Consequently, application of the two techniques was performed in separate phases of the experiment. The fiber-optic-based beam delivery system contained five principal components: laser-to-fiber coupler, armored fiber optic cable, remote light sheet generator, rotating mirror, and optics motor controller. The system was designed to be used with virtually any argon-ion laser system operating in either continuous wave (CW) or multimode with beam diameters from approximately 0.0315 inches to 0.0709 inches. The light sheet optics package allowed variation of the sheet thickness, divergence or spread of the light sheet, and sheet rotation relative to the model. A 3- by 3-inch mirror mounted onto a rotational stage with 360 degrees of continuous rotation directed the light sheet through the optical window and to the desired station on the model. The light sheet was aligned to be perpendicular to the model surface at mid body length and an angle of attack of 16 degrees. Because the light sheet swept in an arc along the model, it was nonorthogonal with respect to the model surface at all other conditions.
Water was injected into the tunnel circuit from a 150-gallon tank of deionized water located in a room on top of the plenum shell to an array of six atomizer nozzles installed in the ceiling region of the diffuser section. The amount of water that was injected into the tunnel was remotely regulated from the wind tunnel control room via a solenoid switch and a one- horsepower pump positioned on the discharge side of the water tank.
Documentation of the LVS images was obtained using a miniature video camera with 360 television lines of horizontal resolution and a fixed focal length lens contained in a cylindrical housing mounted onto the model sting support system. This camera provided a perspective aft of the model which looked upstream along the model centerline. The video image perspective remained constant throughout
the pitch angle range because there was little relative motion between the camera and the model. The video image perspective did vary, however, if the model yaw angle was changed. Selected portions of the videotape recording were digitized and converted to AVI format using a video frame grabber installed in a personal computer. The frame grabber software allowed the precise capture and enhancement of the individual LVS frames that appear in this report.
Discussion of Results
PSP Benefits and Accuracy
The PSP pressure measurement technique allowed for a more detailed view of the vortex-induced pressure field on the double delta wing model upper surface compared to the three rows of discrete ESP taps.. An advantage of the PSP technique is that every pixel in the painted portion of the image is effectively a pressure tap, so the pressure distributions can be resolved to much greater detail in all applicable regions of the model.
Tables V, VI, and VII show the percent error and intervals corresponding to +/- two sample standard deviations for the PSP pressure measurements relative to the ESP tap data for the baseline, parabolic, and diamond fillets, respectively. The selected test conditions were
∞
M = 0.50, 0.70, 0.85, 0.95, and 1.20 and α = 20 degrees. Listed in each table are the Mach number, the number of ESP taps used to calibrate the PSP, the range of pressure spanned by the ESP taps, the mean relative error in PSP measurement, and a interval corresponding to two sample standard deviations for the PSP measurements relative to the ESP data.
The mean relative error is calculated using the following equation from reference 14:
1
100
N i i i iESP
PSP
ESP
N
ε
−−
⎛
⎞
×
⎜
⎟
⎝
⎠
=
∑
where ESPi is the pressure value at the ith pressure tap, PSPi is the pressure value using the PSP technique corresponding to ESPi, N is the
number of ESP taps used , and ε is the mean relative error in pressure measurement using the PSP technique. ∞ M N Range of ESP pressures (psi)
( )
%ε
2 std. dev. interval i iPSP
ESP
−
(psi) 0.50 47 5.9 – 8.3 0.5 +/-0.10 0.70 47 2.5 – 5.7 1.0 +/-0.10 0.85 47 1.3 – 4.0 1.7 +/-0.11 0.95 47 0.9 – 3.3 3.5 +/-0.12 1.20 47 0.3 – 2.1 11.1 +/-0.21Table V. Summary of PSP analysis results for five wind tunnel conditions; baseline fillet.
∞ M N Range of ESP pressures (psi)
( )
%ε
2 std. dev. interval i iPSP
ESP
−
(psi) 0.50 47 4.1 – 8.4 1.5 +/-0.25 0.70 47 2.6 – 5.5 2.1 +/-0.23 0.85 47 1.9 – 3.9 2.0 +/-0.15 0.95 47 1.0 – 3.4 2.8 +/-0.13 1.20 47 0.4 – 2.2 8.6 +/-0.15Table VI. Summary of PSP analysis results for five wind tunnel conditions; parabolic fillet.
∞ M N Range of ESP pressures (psi)
( )
%ε
2 std. dev. interval i iPSP
ESP
−
(psi) 0.50 47 5.1 – 8.2 0.5 +/-0.09 0.70 47 2.1 – 5.4 1.4 +/-0.13 0.85 47 1.0 – 4.2 2.0 +/-0.13 0.95 47 0.6 – 3.2 3.8 +/-0.13 1.20 47 0.4 – 2.4 5.1 +/-0.11Table VII. Summary of PSP analysis results for five wind tunnel conditions; diamond fillet.
Tables V, VI, and VII indicate that the mean relative error in pressure measurement is less than approximately 2 percent at
M
∞= 0.50, 0.70, and 0.85 but increases to approximately 3 percent or higher atM
∞≥
0.95. This trend is apparent for all three fillet configurations, which correspond to three independent applications of the PSP coating. Possible contributing factors are (1) error in the intensity measurement, which results in a larger relative error in the measurement of the lower pressures at the transonic speeds compared to the higher pressures at the subsonic speeds (reference 15); (2) increased model vibration at the transonic speeds; (3) more pronounced surface temperature variations at the transonic speeds (surface temperature measurements were not made during this experiment); (4) photodegradation effects; and (5) the presence of local condensation (humidity control was used in the 8-Foot TPT but instrumentation to measure humidity was not available). It is noted, however, that the magnitudes of the relative error and the two-standard-deviation intervals were encouraging, given the developmental status of the 8-Foot TPT PSP system and the conventional video imaging camera in use at the time of this experiment.Comparison of ESP Pressure
Distributions for the Unpainted and
Painted Models
The unpainted model was tested at the outset of Test 1060 in order to obtain pressure distributions for comparison to the painted model. Previous PSP testing on the double delta wing model in the NASA LaRC 7- by 10-Foot High Speed Tunnel (ref. 4) indicated that the paint coating could affect the vortex symmetry and breakdown characteristics at subsonic, high angle-of-attack conditions. This intrusive effect could be quite pronounced if the paint coating was allowed to wrap around the sharp leading edges during the application process. Particular care was taken during the PSP application in the 8-Foot TPT experiment to avoid this situation. It was not known prior to Test 1060, however, if
the paint thickness (approximately 0.001 in. to 0.002 in.) and surface roughness compared to the unpainted model could also affect the vortex behavior at transonic speeds.
Figure 13 presents selected ESP distributions of the upper surface static pressure coefficient that were obtained on the unpainted model and painted model with baseline fillet at α = 20 degrees and
M
∞= 0.50, 0.70, 0.85, 0.95, and1.20. The results in figure 13 show reasonable quantitative agreement. Some differences are noted at the higher Mach numbers. However, the increased scatter may reflect the difficulty in repeating surface pressure measurements in conditions where separated flow and shock waves coexist, rather than an intrusive effect of the PSP coating. In general, the unpainted and painted model comparisons provided assurance that the PSP coating was not causing a significant effect on the flow topology of interest in the current experiment.
Comparison of PSP and ESP Pressure
Measurements, Ratioed PSP Images, and
LVS Flow Visualization
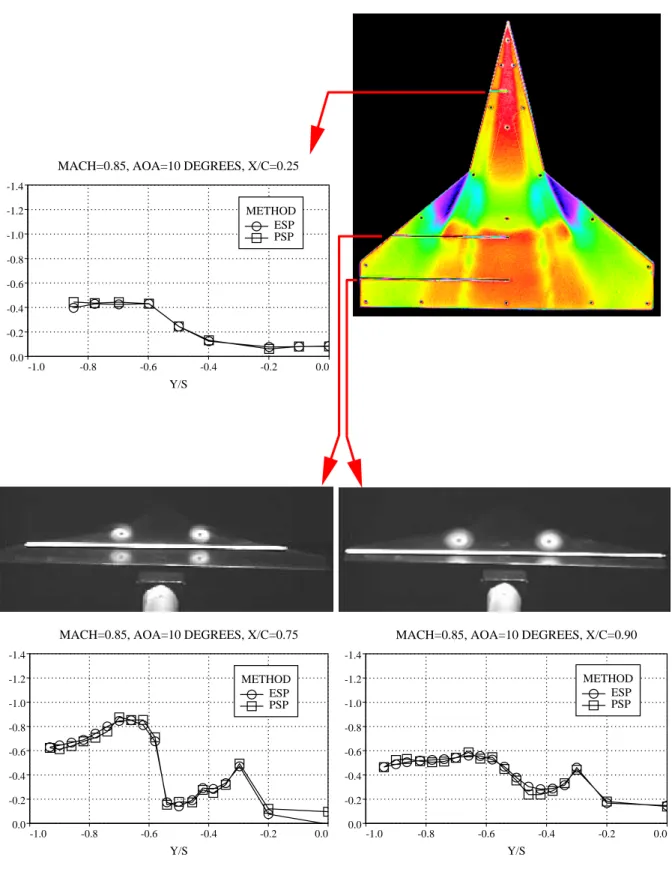
Composite plots are presented in the following sections showing the distributions of the calibrated PSP upper surface static pressure coefficient corresponding to the locations of the discrete ESP pressure orifices at the three axial measurement stations x/c = 0.25, 0.75, and 0.90. The surface pressure coefficient (denoted CP in the figures) is plotted against the local distance y
measured from the wing centerline, normalized by the local semispan, s. For example, values of the nondimensional semispan location y/s = 0.0 and -1.0 correspond to the wing centerline and the left wing leading edge, respectively. There were 9 discrete pressure orifices at x/c = 0.25 and 19 orifices in each of the two stations at x/c
= 0.75 and 0.90. The composite plots also include the corresponding ESP pressure measurements, false-colored PSP global pressure field response and, when available, LVS flow visualization images. All results were obtained at a sideslip angle of 0 degrees.
A global calibration of the PSP was obtained by selecting pixel locations in the processed PSP image that were as close as possible to the ESP pressure orifices but in a region where the paint thickness was considered uniform. There was an unpainted region about 0.10 inches wide centered about the pressure orifices. In addition, there was a transition region where the PSP was feathered into the unpainted area. A typical pixel location for calibration purposes was approximately 0.06 inches upstream or downstream of the orifice. PAINTCP performs a simple linear regression to compute the intercept and slope of the global calibration for each PSP image. The values of the intensity ratios and ESP pressure coefficients were also exported to a statistical software application (ref. 16) to conduct an independent linear regression and analysis of residuals. Specifically, the residuals for all of the estimated regression functions in this experiment were plotted and analyzed to confirm that the assumptions of normally-distributed errors and constancy of error variance were satisfied. In addition, checks were performed for the presence of outlying or influential observations. An assessment of the independence of error terms could not be made since the data were not acquired in any time order.
The false-colored PSP pressure maps were created from the scientific-grade digital camera images using the PSP application software in ref. 12. These images have undergone registration, ratioing, and resection transform. Color bars are not included, since each image was tailored to a specific combination of the angle of attack and Mach number to highlight the prominent features of the surface pressure response. In general, green, blue, and purple colors correspond to regions of low pressure (that is, higher suction pressures), with purple representing the highest suction pressure levels. Regions of higher surface pressures (lower suction pressures or slightly positive pressures) are represented by yellow and red colors.
The available LVS images are positioned above the appropriate pressure measurement
stations. The LVS images are scaled relative to each other to reflect the growth of the vortices from the forward to aft portions of the wing. However, they are not scaled according to the pressure distribution plots. For example, the approximate location of the vortex center in the LVS image, if visible, cannot be transferred directly to the location of the vortex-induced suction pressure peak in the PSP and ESP distributions. The main purpose of these composite plots is to show the level of agreement between the two pressure measurement techniques and to provide pertinent information on the topology of the vortex flows that induce these pressure distributions.
The series of composite plots at each angle of attack corresponding to a specific fillet shape and Mach number combination are supplemented by a single plot showing the effect of the angle of attack on the calibrated PSP pressure distributions. These distributions are superimposed on an isometric view of the left side of the double delta wing model. The effect of angle of attack on the false-colored PSP images is also illustrated in an ensuing composite figure.
Inferences will also be made regarding regions of locally supersonic flow based on a comparison of the experimental pressure coefficients to the critical value at a given Mach number. The level of peak suction pressure coefficient relative to the vacuum pressure coefficient will also be discussed. Table VIII shows the corresponding vacuum pressure and critical pressure coefficients for the Mach numbers considered in this experiment.
∞ M
C
p v, * p C 0.50 -5.714 -2.133 0.70 -2.915 -0.779 0.85 -1.977 -0.302 0.95 -1.583 -0.088 1.20 -0.992 N/ATable VIII. Vacuum and critical pressure coefficients.
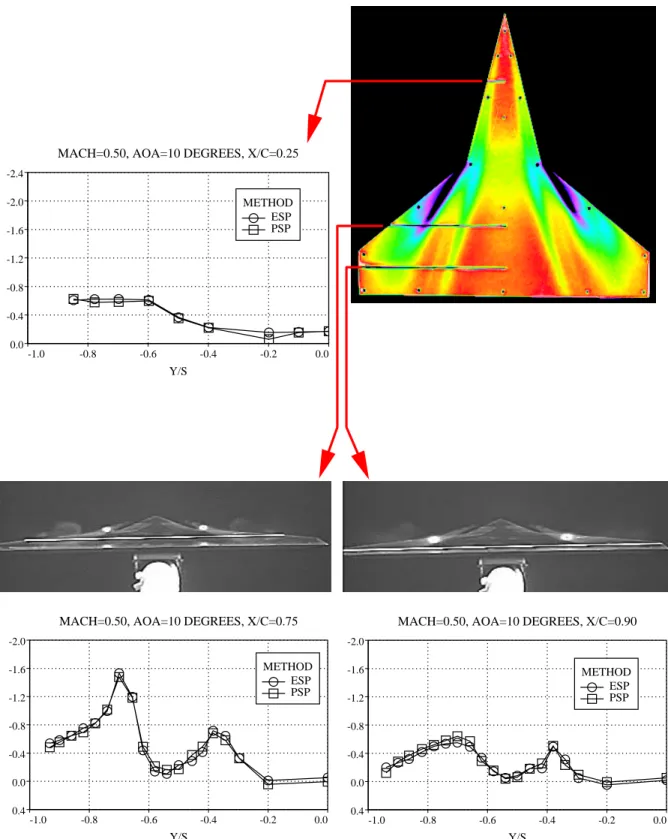
Baseline Fillet, M∞ = 0.50
Comparisons of the distributions of the PSP and ESP upper surface static pressure coefficient at
M
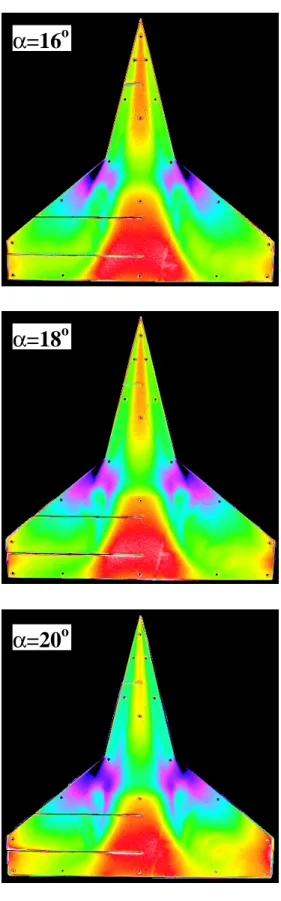
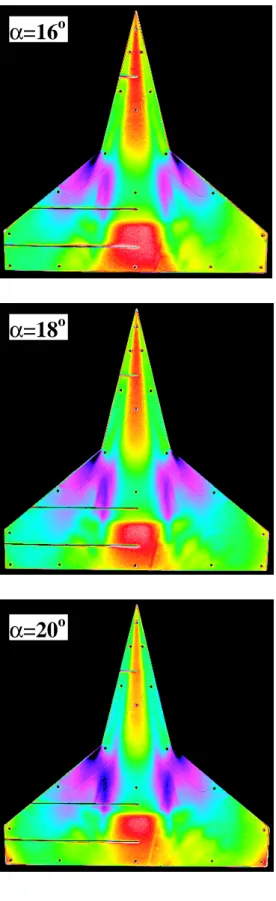
∞ = 0.50 and α = 10, 12, 14, 16, 18, and 20 degrees are shown in figures 14(a) through 14(f), respectively. The pressure distributions are plotted on a common scale to facilitate comparisons of the vortex pressure signatures at the three measurement stations. The ratioed PSP images provide a qualitative map of the surface pressure field response at each angle of attack, where regions of higher suction pressures (more negative pressure coefficients) are denoted by green, blue, and purple colors. Regions of lower suction pressures (less negative pressure coefficient) or small positive pressures are represented primarily by yellow and red colors. The intensity ratio scales and corresponding color coding were tailored to each angle of attack in order to extract important features of the pressure field response. Specification of a common intensity ratio scale for all angles of attack would have resulted in relatively large uninterpretable white or black regions in certain images. In general, the pressure signatures, or footprints, of the leading-edge vortices are revealed by narrow bands of green, blue, and/or purple colors that are bounded by regions of yellow and red colors. An abrupt change in color from green/blue/purple to yellow/red and an expansion of the vortex footprint are interpreted as the signature of a normal shock wave above the wing or the onset of vortex breakdown.The PSP and ESP pressure distributions are in reasonable agreement at all angles of attack (figs. 14(a)-14(f)). Both pressure measurement techniques reveal a region of higher suction pressures induced by the strake vortex at x/c = 0.25. This region is coded green in the ratioed PSP images. Beginning at α = 16 degrees (fig. 14(d)), the LVS images at x/c = 0.25 reveal the strake vortex as a small circular region of local condensation. The PSP and ESP measurements show distinct suction pressure peaks induced by the strake and wing vortices at x/c = 0.75 and 0.90 from α = 10 to 14 degrees (figs. 14(a)-14(d)). The suction peaks situated closer to the wing leading edge at x/c = 0.75 and 0.90 and
approximately y/s = -0.65 to -0.70 are induced by the wing vortex, whereas the strake vortex surface pressure footprint is located farther inboard at about y/s = -0.40. The wing vortex induces higher suction pressures compared to the strake vortex at α = 10 to 14 degrees and
x/c = 0.75. The PSP images show corresponding dark blue to purple color coding (or black coding, which indicates saturation) associated with the wing vortex compared to the green color assigned to the strake vortex. A large region of primarily red color is typically observed between the strake vortices. This is a region of increased pressure associated with the vortex-induced reattached flow on the wing upper surface. The suction pressure peak magnitudes associated with the strake and wing vortices are comparable at x/c = 0.90, which is consistent with the green color coding assigned to both vortices in this region of the PSP images. Interestingly, the strake vortex flow is the most visible in the LVS images at these angles of attack. This effect may be caused by more accumulation of water vapor condensate within the strake vortex, which has a comparatively greater leading-edge run length along which vorticity sheds and feeds into the strake vortical flow. The emergence of the strake vortex as the dominant feature in the double delta wing flow field is apparent in the pressure distributions and PSP and LVS images beginning at α = 16 degrees (fig. 14(d)). The character of the pressure distributions at x/c = 0.75 and 0.90 changes from a distinct dual-vortex pressure signature to a single vortex footprint as the angle of attack increases from α = 16 to 20 degrees (figs. 14(d)-14(f)). This trend reflects the direct interaction between the strake and wing vortices. The wing vortex is drawn inboard and upward from the wing surface as a result of this interaction, and its direct effect on the wing surface pressure field is eventually masked. There is evidence that the interacting wing and strake vortex system bursts over the aft portion of the wing at α = 20 degrees (fig. 14(f)). This phenomenon is manifested as a broadening of the pressure distribution and an overall reduction in the suction pressure level at x/c = 0.90 in fig. 14(f), a pressure rise coded by yellow and red
colors in the PSP image, and a diffusion of the LVS condensation pattern.
The effect of the angle of attack on the calibrated PSP pressure distributions at x/c = 0.25, 0.75, and 0.90 is shown in the isometric plot in figure 15. A consistent increase in the strake vortex suction peak occurs at x/c = 0.25 for the range of angle of attack from 10 to 20 degrees. At x/c = 0.75, the wing vortex suction peak increases up to at α = 14 degrees. This trend is followed by a decline and inboard movement of the wing vortex pressure signature at higher angles of attack. At α = 20 degrees, the wing vortex footprint in completely obscured as a result of its interaction with the strake vortex. The trend is similar, but occurs at lower angles of attack, at x/c = 0.90, and the influence of vortex bursting is apparent in the pressure distribution at α = 20 degrees. The PSP pressure coefficients indicate that the flow on the double delta wing surface is subsonic, since they are all less than the critical pressure coefficient of –2.133 at this Mach number. The distinct strake and wing vortex pressure signatures at α = 10 to 14 degrees, the mutual interaction of the two vortices and the emerging dominance of the strake vortex at higher angles of attack, and the onset of vortex breakdown at
α
≅
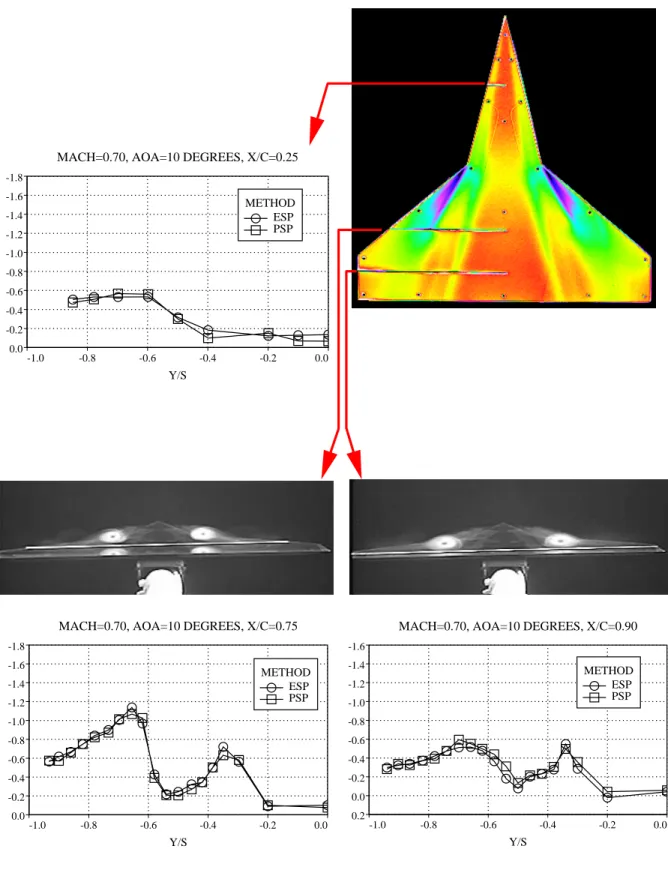
20 degrees can be inferred from the composite ratioed PSP images in figure 16.Baseline Fillet,
M
∞= 0.70Comparisons of the distributions of the PSP and ESP upper surface static pressure coefficient at
M
∞ = 0.70 and α = 10, 12, 14, 16, 18, and 20degrees are shown in figs. 17(a) through 17(f), respectively. Good agreement exists between the PSP pressure distributions and the ESP measurements used for the in-situ calibration at
x/c = 0.25, 0.75, and 0.90 and all angles of attack. The trends in the surface pressure distributions, PSP pressure field maps, and LVS images at α = 10, 12, and 14 degrees are similar to those observed at
M
∞= 0.50. The interaction between the strake and wing vortices is less pronounced, however, at the higher angles ofattack compared to
M
∞= 0.50. For example, the wing vortex maintains a distinct pressure signature at x/c = 0.75 up to the highest angle of attack of 20 degrees. Direct vortex interaction does occur at x/c = 0.90 based on the transition from a twin-peak distribution to a single-peak pressure signature. Onset of vortex breakdown over the wing is more subtle as well, since the pressure distribution at x/c = 0.90 remains peaked up to α = 20 degrees and a marked decline in the suction pressure level is not evident. A pressure rise in a region near the wing tip is suggested by the yellow and red color coding in the PSP image at this angle of attack, which may be the precursor to fully-established vortex breakdown upstream of the trailing edge. LVS images were not obtained at angles of attack greater than 16 degrees in the testing in ref. 4 because of balance load limitations.Figures 18 and 19 present an isometric view of the PSP pressure distributions and a composite of PSP ratioed images, respectively. The primary differences relative to
M
∞= 0.50are the persistence of the wing vortex pressure signature at x/c = 0.75, and less evidence of vortex breakdown effects along the rear portion of the wing at α = 20 degrees. Increasing the Mach number from 0.50 to 0.70 weakens the leading-edge vortices and reduces the adverse longitudinal pressure gradient through which the vortices must traverse (ref. 17). Consequently, the vortex interaction will diminish and the vortices may be able to persist in a stable form to higher angles of attack.
Comparison of the PSP pressure coefficients to the critical value of –0.779 indicates that there are large regions of locally supersonic flow on the wing surface at the higher angles of attack. The development of locally supercritical flow on a highly-swept wing at a free-stream Mach number of 0.70 is consistent with the results presented in ref. 17.
Baseline Fillet,
M
∞= 0.85Figures 20(a) through 20(f) compare the distributions of the PSP and ESP upper surface
static pressure coefficients at
M
∞ = 0.85 andα = 10, 12, 14, 16, 18, and 20 degrees. An isometric view of the PSP pressure distributions and a composite of the PSP ratioed images are presented in figs. 21 and 22, respectively.
The in-situ calibrations of the PSP measurements yield very good agreement with the corresponding ESP data at all angles of attack in fig. 20. In contrast to the results obtained at
M
∞= 0.50 and 0.70, the strake and wing vortices maintain distinct surface pressure footprints in figs. 20 and 21 up to, and including,α = 20 degrees. This trend indicates that increasing the Mach number decreases the direct interaction between the strake and wing vortices. The strake vortex pressure footprint has a distinct peak in figs. 20(a) through 20(f) and fig. 21, whereas the wing vortex pressure signature is typically broad with more subtle local maxima. Most of the experimental pressure coefficients exceed the critical value of –0.302, which indicates that the upper surface flow is primarily supersonic at α = 10 to 20 degrees and
∞
M
= 0.85.The PSP ratioed images at α = 10 degrees in figs. 20(a) and 22 suggest the presence of a normal shock wave just upstream of x/c = 0.75. The shock does not appear to be of sufficient strength, however, to affect the stability of the strake or wing vortices. For example, the PSP and ESP pressure distributions at x/c = 0.75 and
x/c = 0.90 are representative of stable vortical flows. In addition, the corresponding LVS images reveal a stable, “donut-shaped” strake vortex. The wing vortex is not visible in the LVS flow visualization because of insufficient local condensation. The presence of this shock wave is not apparent at higher angles of attack, which may be the result of a three-dimensional relief effect (ref. 17) associated with the stronger strake and wing vortices. The pressure distributions, PSP images, and LVS flow visualization results suggest that the vortices are stable over the wing up to the highest angle of attack of 20 degrees. However, a review of the LVS videotape at α = 20 degrees with the light sheet located near the wing trailing edge
revealed an expansion and unsteadiness of the vortical flows, which are indicative of vortex breakdown onset.
The PSP ratioed images typically reveal the highest suction pressure levels in a region beginning near the strake-wing junction and extending to approximately the 75% chord station. This region is denoted by colors ranging from blue to purple. The vortex that is shed from the wing leading edge is stronger than the strake vortex (ref. 18), and it induces significant suction pressures over a portion of the wing upper surface. The vortex feeding sheet does not remain attached to the leading edge because of the moderate wing sweep and the influence of the strake vortex. As a result, the wing vortex moves inboard and upward away from the surface, and its induced effect on the wing surface pressure field diminishes. The strake vortex is no longer fed by leading-edge vorticity downstream of the strake-wing junction, yet its surface pressure footprint is most intense in this region. This effect may be caused by its downward displacement toward the wing surface as a result of its interaction with the wing vortex.
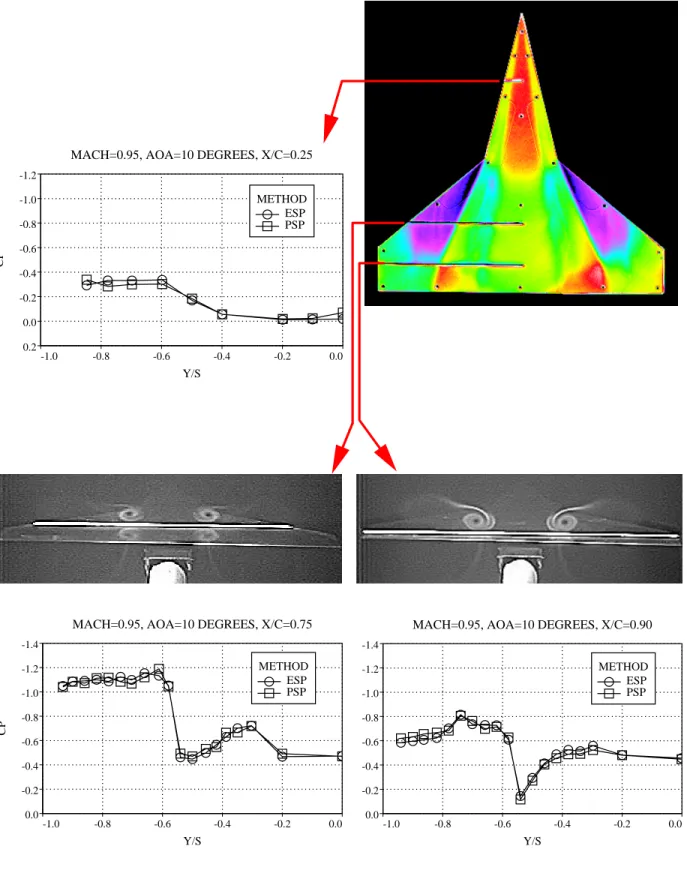
Baseline Fillet,
M
∞= 0.95Figures 23(a) through 23(f) compare the distributions of the PSP and ESP upper surface static pressure coefficients at
M
∞ = 0.95 andα = 10, 12, 14, 16, 18, and 20 degrees. An isometric view of the PSP pressure distributions and a composite of the PSP ratioed images are presented in figs. 24 and 25, respectively. The PSP and ESP measurements exhibit good quantitative agreement, and they both capture the distinct strake and wing vortex footprints that persist up to α = 20 degrees. Direct interaction, or intertwining, of the strake and wing vortices does not occur at this Mach number, which was also inferred from the results at
M
∞ = 0.85. The available LVS imagesreveal both the strake and wing vortices. The strake vortex features more local condensate and is approximately circular in cross section, whereas the wing vortex appears as a flattened, elliptically-shaped region with low condensate
level. Both vortices are in proximity to the wing upper surface. There is no indication of vortex instability in the pressure distributions, PSP images, or LVS flow visualization. For example, the pressure distributions in figs. 23 and 24 show that the suction pressure levels increase with increasing angle of attack up to the highest test angle of attack. An expansion and unsteadiness of the vortex flows were not apparent in the LVS flow visualization. Furthermore, the PSP images in figs. 23 and 25 clearly show the strake vortex surface pressure signatures persisting to the wing trailing edge. The wing vortex pressure signature is also more persistent at this Mach number, since its feeding sheet remains attached to the leading edge to a greater spanwise extent compared to lower Mach numbers. The attachment/detachment of the feeding sheet at the leading edge was observable in the LVS flow visualization by a band of condensate along the outer edge of the wing vortex.
A comparison of the experimental pressure coefficients to the critical value indicates that the flow is supercritical at all pressure measurement stations and angles of attack, except for a small region near the strake centerline at x/c = 0.25 and angles of attack of 16 degrees or less.
Baseline Fillet,
M
∞= 1.20Figures 26(a) through 26(f) compare the distributions of the PSP and ESP upper surface static pressure coefficients at
M
∞ = 1.20 andα = 10, 12, 14, 16, 18, and 20 degrees. Figures 27 and 28 present an isometric view of the PSP pressure distributions and a composite of the PSP ratioed images, respectively.
Reasonable agreement is observed between the PSP and ESP pressure measurements, although there is more scatter between the two measurement techniques compared to the results obtained at lower Mach numbers. This trend is consistent with the higher mean relative error that was previously cited at
M
∞ = 1.20.The rate of increase of the maximum vortex-induced suction pressure levels at this supersonic free-stream Mach number is modest compared to the results obtained at the subsonic Mach numbers. The PSP and ESP surface pressures at x/c = 0.75 and x/c = 0.90 may be approaching a limiting value. For example, the maximum suction pressure coefficients at these measurement stations are approximately –0.85, which is about 86 percent of the vacuum pressure coefficient of –0.992 at this Mach number. Suction pressure levels approximately 90 percent of the vacuum limit were obtained in previous experiments of slender wings at supersonic speeds (refs. 19 and 20).
The results obtained at
M
∞ = 1.20 indicate that the strake and wing vortices are stable, in mutual proximity, but do not interwine at any location over the wing up to α = 20 degrees. In addition, the PSP and LVS images suggest that the wing vortex feeding sheet is attached to the leading edge to nearly the wing tip, which is consistent with the persistence of the wing vortex pressure signature over most of the wing upper surface at this Mach number.Summary of Mach Number Effect with Baseline Fillet
The effect of Mach number on the calibrated PSP pressure distributions at selected angles of attack of 12, 16, and 20 degrees is shown in the composite plots in figure 29. Composite PSP images for the range of Mach number and
α = 10, 12, 14, 16, 18, and 20 degrees are presented in figures 30 through 35, respectively. A common color coding was not used in the PSP images; the comparisons are solely intended to illustrate significant qualitative differences caused by Mach number changes at the selected angles of attack.
The PSP pressure distributions in fig. 29 indicate that increasing the Mach number consistently decreases the peak suction pressure levels on the strake (x/c = 0.25). The pressure distributions at x/c = 0.75 and 0.90 are more complex functions of the Mach number. In general, the wing vortex pressure signature is