Konstantin A. Kholodilin
Boriss Siliverstovs
Stefan Kooths
A Dynamic Panel Data Approach to the Forecasting of
the GDP of German Länder
Corrected Version
Discussion Papers
Opinions expressed in this paper are those of the author and do not necessarily reflect views of the institute.
IMPRESSUM © DIW Berlin, 2007 DIW Berlin
German Institute for Economic Research Mohrenstr. 58
10117 Berlin
Tel. +49 (30) 897 89-0 Fax +49 (30) 897 89-200 http://www.diw.de
ISSN print edition 1433-0210 ISSN electronic edition 1619-4535
A dynamic panel data approach to the forecasting of the GDP of German L¨
ander
Konstantin A. Kholodilin
∗Boriss Siliverstovs
∗∗Stefan Kooths
§Corrected version
December 17, 2007
Abstract
In this paper, we make multi-step forecasts of the annual growth rates of the real GDP for each of the 16 German L¨ander (states) simultaneously. Beside the usual panel data models, such as pooled and fixed-effects models, we apply panel models that explicitly account for spatial dependence between regional GDP. We find that both pooling and accounting for spatial effects helps substantially improve the forecast performance compared to the individual autoregressive models estimated for each of the L¨ander separately. More impor-tantly, we have demonstrated that effect of accounting for spatial dependence is even more pronounced at longer forecasting horizons (the forecast accuracy gain as measured by the root mean squared forecast error is about 9% at 1-year horizon and exceeds 40% at 5-year horizon). Hence, we strongly recommend incorporating spatial dependence structure into regional forecasting models, especially, when long-term forecasts are made.
Keywords: German L¨ander; forecasting; dynamic panel model; spatial autocorrelation.
JEL classification: C21; C23; C53.
¶We are very grateful to J. P. Elhorst for providing his Matlab code and for patiently explaining us all the necessary details
concerning his model. We also are grateful to C. Dreger and to the three anonymous referees whose comments on the earlier draft of the paper led to substantial improvements.
∗DIW Berlin, Mohrenstr. 58, 10117 Berlin, Germany ∗∗DIW Berlin, Mohrenstr. 58, 10117 Berlin, Germany
Contents K. Kholodilin, B. Siliverstovs, S. Kooths
Contents
1 Introduction 1
2 Data properties 3
3 Dynamic panel data models 4
4 Estimation results 8
5 Forecasting performance 10
6 Summary 12
References 13
List of Tables K. Kholodilin, B. Siliverstovs, S. Kooths
List of Tables
1 Descriptive statistics of the growth rates of real GDP of the German L¨ander (%) . . . 17
2 Estimation results 1993 - 2006 . . . 18
1 Introduction K. Kholodilin, B. Siliverstovs, S. Kooths
1
Introduction
The current political and economic situation in Europe can be characterized by two major trends. On the one hand, political and especially economic integration on the international level is taking place. On the other hand, the regions, of which nations are comprised, are gaining in importance and autonomy. Hence, there is an increased need for reliable forecasts in order to support decision-making processes at the regional level.
This is particularly true for a federal country like Germany, where regional heterogeneity primarily manifests itself in the distinction between the Eastern and Western L¨ander (singular Land) due to the legacy of the past as well as in substantial differences in the economic structure within each group. This implies that regional forecasts might diverge from the forecasts made for the whole country, which hence cannot serve as a meaningful guide for decision making at the regional level.
In this paper, we forecast the annual growth rates of GDP for each of the 16 German L¨ander. To the best of our knowledge, this is the first attempt in the literature that addresses this question for all German L¨ander simultaneously as most of the studies attempt to forecast German GDP on the aggregate level. These studies include Langmantel (1999), Hinze (2003), Dreger and Schumacher (2004), Mittnik and Zadrozny (2004), Kholodilin and Siliverstovs (2005), and Schumacher (2005), among others, who use several variants of the fore-casting methodology of Stock and Watson (2002) based on diffusion indices in order to predict the developments in the German GDP. At the same time, there are two studies that construct forecasts for the individual German L¨ander, Bandholz and Funke (2003) and Dreger and Kholodilin (2006) who forecast the GDP of Hamburg and of Berlin, respectively, again, using the diffusion indices.
The fact that GDP data for individual German L¨ander are not available on a quarterly basis severely reduces the post-re-unification data base to 16 annual observations for the period from 1991 to 2006. This may explain the small number of studies aiming at forecasting German GDP on the L¨ander level.
In this paper, we circumvent the problem of data collection for each regional entity by pooling the annual growth rates of GDP into a panel and correspondingly utilizing panel data models for forecasting. The advan-tages of such a pooling approach for forecasting have been widely demonstrated in a series of articles for diverse data sets such as Baltagi and Griffin (1997); Baltagi et al. (2003) — for gasoline demand, Baltagi et al. (2000) — for cigarette demand, Baltagi et al. (2002) — for electricity and natural gas consumption, Baltagi et al.
1 Introduction K. Kholodilin, B. Siliverstovs, S. Kooths
(2004) — for Tobin’s qestimation, and Br¨ucker and Siliverstovs (2006) — for international migration, among
others.
In addition to pooling, accounting for spatial interdependence between regions may prove beneficial for the purposes of forecasting. Spatial dependence implies that due to spillover effects (e.g., commuter labor and trade flows). Neighboring regions may have similar economic performance and hence the location matters. However, the number of studies that illustrate the usefulness of accounting for (possible) spatial dependence effects across cross sections in the forecasting exercise is still limited. For example, Elhorst (2005), Baltagi and Li (2006), and Longhi and Nijkamp (2007) demonstrate forecast superiority of models accounting for spatial dependence across regions using data on demand for cigarettes from states of the USA, demand for liquor in the American states, and German regional labor markets, respectively. However, only Longhi and Nijkamp (2007) conduct
quasi real-time forecasts for period t+h(h >0) based on the information available in period t. On the other
hand, the forecasts made in Elhorst (2005) and Baltagi and Li (2006) are not real-time forecasts, since they
take advantage of the whole information set that is available in the forecast period,t+h.
Applications of panel data models accounting for spatial effects for the forecasting of regional GDP are even more limited. To our knowledge, there is only one paper treating this issue, namely that of Polasek et al. (2007), who make long-term forecasts of the GDP of 99 Austrian regions, but do not evaluate their accuracy in a formal way.
Thus, the main contribution of this paper is the construction of GDP forecasts for all German L¨ander simultaneously. Our additional contribution to the literature is that in order to make forecasts of regional GDP we employ panel data models that allow not only for temporal interdependence in the regional growth rates, but also take into account their spatial interdependence. The advantage of our approach is that it is suited to conduct forecasts in the real time. We also demonstrate the usefulness of our approach by formal methods.
The paper is structured in the following way. In section 2 the data are described. Section 3 presents different econometric forecasting models. In section 4 the estimation results are reported, whereas section 5 evaluates the forecasting performance of alternative models. Finally, section 6 concludes.
2 Data properties K. Kholodilin, B. Siliverstovs, S. Kooths
2
Data properties
For our estimation and forecasting we use annual real GDP data of the 16 German L¨ander. The data cover the
period 1991-2006 and can be downloaded from the webpage of the Statistical Office of Baden-W¨urtemberg
(Ar-beitskreis Volkswirtschaftliche Gesamtrechnungen der L¨ander). The data are seasonally adjusted and expressed in terms of chain indices with the base year 2000.
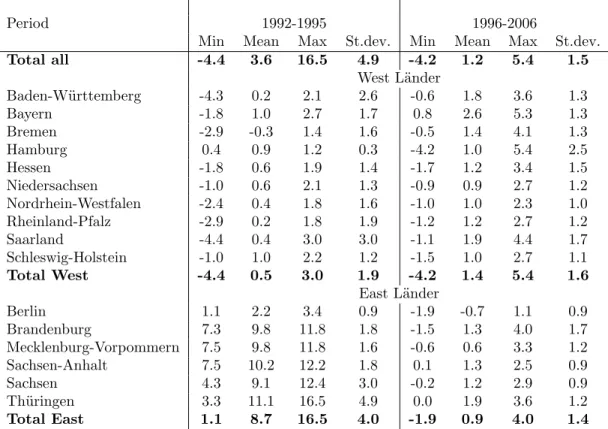
Before we estimate the models described in Section 3, we take a look at the descriptive statistics of the data under consideration displayed in Table 1. In this table, the basic descriptive statistics of the growth rates of real GDP in form of the mean, maximum, minimum, and the standard deviation are summarized at three levels of aggregation: for all German L¨ander, separately for the Western L¨ander group and for the Eastern L¨ander group as well as for each of the L¨ander individually.
The specific economic dynamics of the Eastern L¨ander in the first half of the 1990s reflect the re-unification growth effect that was mainly driven by expansionary government interventions (see Vesper (1998) and Bach and Vesper (2000) for a detailed analysis of fiscal policies during this period). The market-oriented transformation of the formerly centrally planned economy in Eastern Germany and the rebuilding of the infrastructure in the Eastern L¨ander implied public per capita spending that was far above the Western level from the start and rising until the mid-1990s (from 128% in 1992 to 145% in 1995). This expansionary government program was fuelled by both extensive transfers from West to East (starting at 65 billion DM in 1991 and peaking at 118 billion DM in 1996) and deficit spending in the Eastern L¨ander whose per capita debt quickly approached the Western levels (within the first 5 years the ratio rose from 11% to 90%). Furthermore, due to tax privileges (like special depreciation allowances) the construction sector boomed in the first decade with the East-West ratio of per capita investment more than doubled from 67% in 1991 to 180% in 1996 (residential construction more than tripled in the same period). The special factors that heavily influenced the catching-up process lost momentum after 1995 (no further increase, but stagnation or even decrease of the indicators). Therefore, we have chosen to split the whole period 1992-2006 into two sub-periods: from 1992 till 1995 and from 1996 till 2006.
In the first sub-period the growth rates of the Eastern L¨ander were much higher than those of the Western L¨ander. After 1995, this difference has vanished such that in the second sub-period real GDP growth rates in
3 Dynamic panel data models K. Kholodilin, B. Siliverstovs, S. Kooths
both groups became very similar. Precise figures on the magnitude of the difference in growth rates of Eastern and Western L¨ander for the period from 1992 till 1995 can be found in Table 1. In this period, in all Eastern L¨ander, excluding Berlin, the mean growth rates of real GDP was about 10% per annum, such that the average growth rate computed for all Eastern L¨ander is 8.7, which is about 17 times higher than the average growth rate of 0.5 reported for the Western L¨ander in this sub-period. Furthermore, from 1992 till 1995 there were no negative growth rates in any of the Eastern L¨ander, whereas the Western L¨ander experienced the negative growth rates of real GDP during this sub-period.
In the second sub-period (from 1996 till 2006), the growth rates of real GDP become more or less similar in both L¨ander groups. The mean growth rates are of about the same magnitude (0.9 for the Eastern L¨ander vs 1.4 for the Western L¨ander), with virtually the same standard deviation of 1.4 and 1.6, respectively.
This marked difference between the magnitude of real GDP growth rates in the Eastern and Western L¨ander in the first sub-period and the fact that it vanished in the second sub-period prompts us to introduce a step dummy variable in our regression models that takes the value of one in the period from 1992 up to and including 1995 and the value of zero otherwise. Observe that this step dummy is applicable only for the six Eastern L¨ander as namely for those L¨ander the properties of real GDP growth rates are drastically different in both sub-periods. As far as the properties of the real GDP growth rates in the Western L¨ander are concerned, we assume that those did not change over the whole period.
We have chosen to interact this step dummy with the autoregressive coefficient in our regression models in order to account for the fact that the persistence in real GDP growth rates in the Eastern L¨ander in the first period seems to be much more pronounced than in the second sub-period.
3
Dynamic panel data models
In this section we describe the econometric models that we are using for forecasting the growth rates of real GDP of the German L¨ander. In these otherwise standard models we include the re-unification boom dummy that takes into account specific macroeconomic dynamics of the Eastern L¨ander in the first half of the 1990s.
In this paper, we examine a standard set of dynamic panel data (DPD) models starting with individual autoregressive (AR) models, which can be considered as a particular case of DPD models with unrestricted
3 Dynamic panel data models K. Kholodilin, B. Siliverstovs, S. Kooths
parameters, through fixed-effects models, which impose homogeneity restrictions on the slope parameters, to pooled models, which impose homogeneity restrictions on both intercept and slope parameters. In addition to standard fixed-effects and pooled models, we also consider fixed-effects and pooled models that account for spatial dependence.
As a benchmark model, with which all other models will be compared, we use a linear individual AR(1)
model (IOLS) and estimate it for each L¨ander separately:
yit=αi+βi1yit−1+βi2Iityit−1+εit εit∼N.I.D.(0, σi2) (1)
whereyitis the annual growth rate of real GDP of i-th Land;Iit is a step dummy, which from now on will be
referred to as a re-unification boom dummy. The dummy is defined as follows:
1992-1995 1996-2006
Eastern L¨ander Iit= 1 Iit= 0
Western L¨ander Iit= 0 Iit= 0
In addition, given the short time dimension of our data, it should be noted that the OLS estimator of the parameters of individual AR(1) models is biased due to insufficient degrees of freedom as pointed out in Ramanathan (1995).
The next model we consider is the pooled panel (POLS or PGM M depending on the estimation method)
model:
yit=α+β1yit−1+β2Iityit−1+εit εit∼N.I.D.(0, σ2) (2)
which imposes the homogeneity restriction on both intercept and slope coefficients across all the L¨ander.
An alternative model is thefixed-effects(F EOLSorF EGM M) model that allows for region-specific intercepts:
yit=αi+β1yit−1+β2Iityit−1+εit εit∼N.I.D.(0, σ2) (3)
The fixed-effects model represents an intermediate case between the individual (IOLS) and pooled panel (POLS
3 Dynamic panel data models K. Kholodilin, B. Siliverstovs, S. Kooths
all L¨ander, and yet allows to take advantage of panel dimension. From the economic point of view, fixed effects capture differences in growth rates between L¨ander related to their heterogeneous economic structure.
Additionally, we consider the following two types of models that account for spatial correlation that might exist between the L¨ander. One may expect to find the dynamic (stagnating) L¨ander being the neighbors of dynamic (stagnating) L¨ander due to cross-border spillovers (commuter labor and trade flows).
The spatial dependence is accounted for using an N ×N matrix of spatial weights W, which is based on
the existence of common borders between the L¨ander1. The typical element of this matrix,w
ij, is equal to 1 if
two corresponding L¨ander have a common border, and 0 otherwise. All the elements on the main diagonal of
matrixW are equal to zero. The constructed weights matrix is normalized such that all the elements in each
row sum up to one.
First, we model the spatial dependence by means of spatial lags of the dependent variable. We examine both
pooled and fixed-effects versions of this model. The pooled spatial Durbin model (PSDM
M LE)can be written as follows: yit=α+β1yit−1+β2Iityit−1+ρ N X j=1 wijyjt+εit εit∼N.I.D.(0, σ2) (4)
The fixed-effects spatial Durbin model (F ESDM
M LE) is yit=αi+β1yit−1+β2Iityit−1+ρ N X j=1 wijyjt+εit εit∼N.I.D.(0, σ2) (5)
whereρis the spatial autoregressive parameter andN is the number of L¨ander.
The second type of models addresses spatial correlation through a spatial autoregressive error structure, as suggested by Elhorst (2005). Again, we distinguish between pooled and fixed-effects models. Due to their
specific nature, those models are estimated by the Maximum Likelihood method. Thepooled spatial errormodel
1We also have considered a matrix of spatial weights based on the distance between the capitals of the L¨ander. Following
Baumont et al. (2002) we constructed four distance-decay weights matrices depending on four different distance cutoff values: first quartile, median, second quartile, and maximum distance. However, the forecast accuracy of the models based on these weights matrices was generally inferior to that of the models with a weights matrix based on common borders. Therefore, in order to save space we chose not to report the corresponding results but we make them available upon request.
3 Dynamic panel data models K. Kholodilin, B. Siliverstovs, S. Kooths
(PSEM
M LE) has the following form:
yit=α+β1yit−1+β2Iityit−1+uit uit=λ
PN
j=1wijujt+εit εit∼N.I.D.(0, σ2) (6)
Thefixed-effects spatial error model (F ESEM
M LE) can be expressed as:
yit=αi+β1yit−1+β2Iityit−1+uit uit=λ
PN
j=1wijujt+εit εit∼N.I.D.(0, σ2) (7)
whereλis the coefficient of spatial error autoregression.
We have estimated IOLS, POLS, andF EOLS using the OLS method. It is known from the literature that
in the context of dynamic panel data models the OLS estimator is subject to simultaneous equation bias. In order to address this problem we have used the GMM estimator of Arellano and Bond (1991) to estimate the fixed-effects model without spatial autoregressive lags. Notice that the GMM estimator uses the first-difference transformation, which omits the time-invariant variables (in our case, the L¨ander-specific intercepts). These were recovered using the following two-step procedure. In the first step, the slope parameters are estimated using the first differences of the data. In the second step, the estimated parameters are plugged into the equation
for the levels of data and the fitted values are calculated. The fixed effects for theF EGM M model are obtained
as the L¨ander-specific averages of difference between actual and fitted values.
Although from the theoretical perspective, the GMM estimators should be preferred to the OLS estimators when applied to dynamic panels with small time dimension, in what follows we use the OLS estimators, since in the forecasting context a biased but stable estimator may still deliver a more accurate forecasting performance
than an unbiased but unstable one2.
The remainingPSDM
M LE,F EM LESDM,PM LESEM andF EM LESEM models were estimated using the Maximum Likelihood
method as implemented in the Matlab codes of Paul Elhorst. 2We thank an anonymous referee for pointing this out.
4 Estimation results K. Kholodilin, B. Siliverstovs, S. Kooths
4
Estimation results
The estimates of the temporal and spatial autoregressive coefficients of all the models are presented in Table
2. At first, we report a summary of the estimates of the temporal autoregressive coefficient αb1 obtained for a
model estimated for each Land separately. The results of this exercise reveal quite large heterogeneity in the obtained values. For all 16 L¨ander considered, the minimum value of the autoregressive coefficient estimate is
−0.186 and the maximum is 0.230, while the median value is 0.052.
We also report a summary of the estimates of the interaction between the re-unification boom dummy and
the growth rates in Eastern regions,cβ2, computed in the regression for each Eastern Land. The magnitudes of
the corresponding estimates lie in the interval from 0.379 to 0.780 with a median value of 0.647. Such values of the estimated coefficient support our observation — made earlier in Section 2 — that the persistence in real GDP growth rates in the Eastern L¨ander was much higher during the period from 1992 till 1995 than that during the period from 1996 till 2006.
Note that the individual autoregressive models seem to provide a rather poor fit to the data as the values of
theR2often lie near zero. The corresponding median is 0.038. This is most likely due to the rather short period
used in the estimation as well as the rather low persistence in the real GDP growth rates for the majority of observations.
The next two columns of Table 2 contain the estimation results obtained for the pooled model (equation
2) and for the fixed-effects model (equation 3) using OLS. For the POLS model, the estimated value of the
autoregressive coefficient is 0.162, which is significant at the 1% level, whereas for the F EOLS model the
corresponding value is 0.064 and is significant at the 5% level.
The value of the estimate of the interaction term between re-unification boom dummy and growth rates in
Eastern L¨ander,cβ2, is 0.589 and 0.653 for the pooled and the fixed-effects models, respectively. It is significant
even at the 1% level in both cases. Thus, our estimation results are concordant with those obtained from the individual autoregressions that the persistence in growth rates of real GDP in the Eastern L¨ander was much higher during 1992-1995 than during 1996-2006.
In the fixed-effects F EGM M model estimated by GMM, the autoregressive coefficient is much lower in
4 Estimation results K. Kholodilin, B. Siliverstovs, S. Kooths
of similar magnitude compared to the models estimated by OLS. The appropriateness of this GMM estimator is illustrated by the following specification tests. The Sargan test has a value of 15.44 with a p-value of 1.000, which implies that the null of the instruments’ validity cannot be rejected. The significance of the AR(1) test (test statistic -2.482, p-value 0.013) and insignificance of the AR(2) test (test statistic -1.487, p-value 0.137) suggest that the assumption of serially uncorrelated errors is not violated.
Finally, the last four columns of Table 2 contain the parameter estimates of the models that allow for spatial effects. The first two models are spatial Durbin models. The estimates of the autoregressive parameters and the interaction term between re-unification boom dummy and growth rates in Eastern regions for these models are quite similar to those obtained for the models without spatial effects. In addition, the estimates of spatial
autoregressive coefficients,ρb, of the pooled and fixed-effects models are 0.097 (p=0.110) and 0.119 (p=0.062),
respectively. Nevertheless, for the forecasting purposes, Elhorst (2005) recommends using the models that account for spatial dependence even if spatial autocorrelation coefficient is not significantly different from zero.
The last two models, PSEM
M LE andF EM LESEM, are those with spatially correlated errors. The estimates of the
autoregressive and interaction term between re-unification boom dummy and growth rates in Eastern L¨ander parameters are close to those obtained in the corresponding panel models with and without spatial effects estimated by OLS. In contrast to the spatially autoregressive models, the spatial error models point to a strong
positive and statistically significant spatial correlation as measured by the coefficientλ. Indeed,λbtakes values
of 0.607 and 0.577, respectively, depending on whether we allow for fixed effects or not. Therefore, one would expect that accounting for spatial effects using this type of model will result in an increased forecasting accuracy compared to the models without spatial effects.
To summarize, on the basis of our estimation results we conclude the following. First, the growth rates of real GDP of the German L¨ander exhibit rather low temporal dependence, except for the period from 1992 till 1995, when the Eastern L¨ander enjoyed exceptionally high growth rates. Our interaction term between re-unification boom dummy and growth rates in Eastern regions introduced to capture this effect turns out to be positive and highly significant in all models that we considered in this paper. Second, the growth rates of real GDP exhibit substantial spatial dependence in the current period. Hence, it remains to check whether allowance for this spatial dependence will result in improved forecasts of regional GDP growth rates.
5 Forecasting performance K. Kholodilin, B. Siliverstovs, S. Kooths
5
Forecasting performance
For each model we forecast recursively the h-year growth rates of real GDP, ∆hy
i,t+h =yi,t+h−yit for h= 1,2, . . . ,5 for all 16 L¨ander over the forecasting period encompassing 5 years from 2002 up to 2006. This
procedure gives us (5−(h−1))×N forecasts for the h-year growth rate.
For each model, the parameter estimates were obtained using an expanding window of observations. Thus,
the first estimation period is 1993-2001, based on which the forecasts of ∆1y
i,2002,∆2yi,2003, . . . ,∆5yi,2006 are
made. Next, the model is re-estimated for the period 1993-2002 and the forecasts ∆1y
i,2003,∆2yi,2004, . . . ,∆4yi,2006
are computed, etc.
For all models, except spatial Durbin models, the forecasts were made in a standard way. The forecasts of
the spatial Durbin models are conducted using the two-step procedure3. In order to illustrate this procedure,
it is worthwhile re-writing the spatial Durbin models (4) and (5) in the following matrix form for the pooled:
y=αıN T+β1y−1+β2(D¯y−1) +ρWy+ε (8)
for the fixed-effects versions:
y= (ıT ⊗IN)α+β1y−1+β2(D¯y−1) +ρWy+ε (9)
whereyis aN T×1 vector of theyitstacked by year and region such that the firstN observations refer to the
first year, etc. Correspondingly, y−1 is aN T ×1 vector of the yi,t−1 stacked by year and region. The matrix
Dis aN T ×1 matrix which structure corresponds to the re-unification boom dummyIit reported in Table 3.
Then, (D¯y−1) denotes the interaction term between the re-unification boom dummy and the growth rates in
Eastern regions, where¯is the Hadamar product, or element-by-element multiplication operator. IN,IT, and
IN T are the unit matrices with dimensions N×N,T×T, andN T ×N T, respectively. TheN T×N T matrix
W=IT ⊗W is the block-diagonal matrix with theN×N matrixW of spatial weights on its main diagonal,
where is ⊗a Kronecker product. ıN T andıT are theN T andT unit vectors, respectively, such thatαandα
are correspondingly a common intercept and anN×1 vector of cross-section specific intercepts in the pooled
5 Forecasting performance K. Kholodilin, B. Siliverstovs, S. Kooths
and the fixed-effects spatial Durbin models.
The models (8) and (9) can be re-written in the following reduced form:
(INT−ρW)y = αıN T +β1y−1+β2(D¯y−1) +ε
y = (INT−ρW)−1[αıN T +β1y−1+β2(D¯y−1)] + (INT−ρW)−1ε (10)
(INT−ρW)y = (ıT ⊗IN)α+β1y−1+β2(D¯y−1) +ε
y = (INT−ρW)−1[(ıT ⊗IN)α+β1y−1+β2(D¯y−1)] + (INT−ρW)−1ε (11)
where only the past values ofyappear on the right-hand side of the equations.
The multi-step ahead forecasts from the spatial Durbin models can now be obtained as follows. First, we estimate the parameters of the models (8) and (9), as outlined above. Second, we use the reduced form equations (10) and (11) in order to generate the forecasts.
The results of our forecasting exercise are reported in Table 3. The forecasting performance is measured by the total root mean square forecast error (Total RMSFE) calculated for all years and over all regions for each
forecasting horizon, h= 1,2, . . . ,5. The individual autoregressive model serves as a benchmark, to which the
forecasting performance of all other models is compared. Hence, the relative total RMSFE measures the gains in forecasting accuracy from pooling and from accounting for spatial dependence.
The results of our forecasting exercise further strengthen the evidence previously reported in a number of studies such as Baltagi and Griffin (1997); Baltagi et al. (2003), Baltagi et al. (2000), Baltagi et al. (2002),
Baltagi et al. (2004), and Br¨ucker and Siliverstovs (2006), among others, that pooling helps to improve forecast
accuracy. As seen, the pooled OLS model produces an RMSFE that is about 9% lower than that reported for the individual AR(1) models. Allowing for the presence of fixed effects, however, does not lead to further improvements in forecast accuracy. The likely reason is that the relatively short time span of our data impedes
on a precise estimation of region-specific intercepts. An F-test for the absence of fixed effects does not reject
the null hypothesis (F(15,208) = 1.091 with p-value equal 0.366).
6 Summary K. Kholodilin, B. Siliverstovs, S. Kooths
performance. Possible reason is that the GMM has poor finite sample properties, as documented in a number of Monte Carlo studies (see Arellano and Bond (1991), Kiviet (1995), Ziliak (1997), and Alonso-Borrego and Arellano (1999)).
As expected, the application of pooled and fixed-effects models accounting for spatial effects results in a better forecast accuracy compared not only to the benchmark model but also to the pooled and fixed-effects models, which do not take into account spatial effects.
The largest forecast accuracy gain is achieved when the pooled models are used. The best forecast
perfor-mance is delivered by PSEM
M LE closely followed by PM LESDM. This ranking remains the same over all forecasting
horizons. More importantly, the relative forecast accuracy improvement with respect to the benchmark model
increases with longer forecasting horizon. For example, ath= 1 the ratio of total RMSFE ofPSEM
M LE andPM LESDM
with respect to that of the benchmark model is 0.906 and 0.908, respectively, which represents forecast accuracy
improvement of 9.4% and 9.2%, correspondingly. At the forecasting horizonh= 5, this improvement constitutes
40.4% and 36.8%, respectively. ThePOLS model is ranked as the third best model where the similar pattern is
also observed to somewhat lesser degree — the corresponding relative RMSFE ath= 1 is 0.915 and ath= 5 is
0.680. Observe that the forecasting accuracy of the pooled models accounting for the spatial dependence also
gets larger relatively to the pooled model without spatial effects as forecasting horizon increases. Thus, the
ratios of the total RMSFE of thePOLS model with that of thePM LESEM at the 1-year and the 5-year forecasting
horizons are 0.989 and 0.876, respectively.
The fixed-effects models with and without spatial effects can be ranked according to their forecast accuracy as
follows: F ESDM
M LE,F EM LESEM,F EOLS, andF EGM M. This ranking remains unchanged across all forecast horizons.
Again, the two best models are those accounting for spatial dependence. Their forecasting performance relative to that of the fixed-effects models without spatial effects also tends to increase with longer forecast horizons.
6
Summary
In this paper, we have addressed the forecasting of h-year growth rates of real GDP for of each of the 16 German
L¨ander using dynamic panel data models,h= 1,2, . . . ,5. Based on the results of Bach and Vesper (2000), we
References K. Kholodilin, B. Siliverstovs, S. Kooths
early 1990s.
Our main finding is that pooled models accounting for spatial dependence, PSEM
M LE andPM LESDM, produce the
best forecasting accuracy (as measured by the Root Mean Squared Forecast Error) compared to any other model examined in this paper. This finding remains robust across all forecasting horizons. Furthermore, the gain in forecasting performance of these models gets larger with increase in forecasting horizon when compared not only to the benchmark model but also to models that do not account for spatial dependence in growth rates of real GDP. For example, compared to the benchmark model, a gain in forecasting accuracy of the pooled models
accounting for spatial effects at h= 1 is about 9%, whereas at h= 5 it is more than 40%. Similarly, a gain
in forecasting accuracy of our best pooled model accounting for spatial effects when compared to the pooled
model without spatial effects is about 1% ath= 1, whereas at h= 5 it is more than 12%.
Two factors must have contributed to this improvement: pooling and accounting for spatial effects. On the one hand, the finding that pooling helps to increase the forecasting accuracy is consistent with the results obtained in Baltagi and Griffin (1997); Baltagi et al. (2003), Baltagi et al. (2000), Baltagi et al. (2002), Baltagi
et al. (2004), and Br¨ucker and Siliverstovs (2006),inter alia, for diverse data sets. On the other hand, the fact
that accounting for spatial effects helps to improve the forecast performance further strengthens conclusions Elhorst (2005) and Longhi and Nijkamp (2007). More importantly, we have demonstrated that effect of ac-counting for spatial dependence is even more pronounced at longer forecasting horizons. Hence, on the basis of our results, we strongly recommend incorporating spatial dependence structure into regional forecasting models, especially, when long-run forecasts are made.
References
Alonso-Borrego, C. and M. Arellano (1999). Symmetrically normalized instrumental-variable estimation using
panel data. Journal of Business & Economic Statistics 17(1), 36–49.
Arellano, M. and S. Bond (1991). Some tests of specification for panel data: Monte Carlo evidence and an
application to employment equations. Review of Economic Studies 58(2), 277–97.
Viertel-References K. Kholodilin, B. Siliverstovs, S. Kooths
jahreshefte zur Wirtschaftsforschung 69, 194–224.
Baltagi, B. H., G. Bresson, J. M. Griffin, and A. Pirotte (2003). Homogeneous, heterogeneous or shrinkage
estimators? Some empirical evidence from French regional gasoline consumption.Empirical Economics 28(4),
795–811.
Baltagi, B. H., G. Bresson, and A. Pirotte (2002). Comparison of forecast performance for homogeneous,
hetero-geneous and shrinkage estimators: Some empirical evidence from US electricity and natural gas. Economics
Letters 76(3), 375–382.
Baltagi, B. H., G. Bresson, and A. Pirotte (2004). Tobin q: Forecast performance for hierarchical Bayes,
shrinkage, heterogeneous and homogeneous panel data estimators. Empirical Economics 29(1), 107–113.
Baltagi, B. H. and J. M. Griffin (1997). Pooled estimators vs. their heterogeneous counterparts in the context
of dynamic demand for gasoline. Journal of Econometrics 77(2), 303–327.
Baltagi, B. H., J. M. Griffin, and W. Xiong (2000). To pool or not to pool: Homogeneous versus hetergeneous
estimations applied to cigarette demand. The Review of Economics and Statistics 82(1), 117–126.
Baltagi, B. H. and D. Li (2006). Prediction in the panel data model with spatial correlation. Spatial Economic
Analysis 1, 175–185.
Bandholz, H. and M. Funke (2003). Die Konstruktion und Sch¨atzung eines Fr¨uhindikators f¨ur die
Konjunk-turentwicklung in der Freien und Hansestadt Hamburg. Quantitative Macroeconomics Working Papers 20305, Hamburg University, Department of Economics.
Baumont, C., C. Ertur, and J. L. Gallo (2002). The European regional convergence process, 1980-1995: Do spatial regimes and spatial dependence matter? mimeo.
Br¨ucker, H. and B. Siliverstovs (2006). On the estimation and forecasting of international migration: How
relevant is heterogeneity across countries? Empirical Economics 31(3), 735–754.
Dreger, C. and K. A. Kholodilin (2006). Prognosen der regionalen Konjunkturentwicklung. DIW
References K. Kholodilin, B. Siliverstovs, S. Kooths
Dreger, C. and C. Schumacher (2004). Estimating large-scale factor models for economic activity in Germany:
Do they outperform simpler models? Jahrb¨ucher f¨ur National¨okonomie und Statistik 224, 732–750.
Elhorst, J. P. (2005). Unconditional maximum likelihood estimation of linear and log-linear dynamic models
for spatial panels. Geographical Analysis 37, 85–106.
Hinze, J. (2003). Prognoseleistung von Fr¨uhindikatoren: Die Bedeutung von Fr¨uhindikatoren f¨ur
Konjunktur-prognosen – Eine Analyse f¨ur Deutschland. HWWA Discussion Paper (236).
Kholodilin, K. A. and B. Siliverstovs (2005). On the forecasting properties of the alternative leading indicators
for the German GDP: Recent evidence. Jahrb¨ucher f¨ur National¨okonomie und Statistik 226(3), 234–259.
Kiviet, J. F. (1995). On bias, inconsistency, and efficiency of various estimators in dynamic panel data models.
Journal of Econometrics 68(1), 53–78.
Langmantel, E. (1999). Das Ifo Gesch¨aftsklima als Indikator f¨ur die Prognose des Bruttoinlandsprodukts. Ifo
Schnelldienst 16/17, 16–21.
Longhi, S. and P. Nijkamp (2007). Forecasting regional labor market developments under spatial heterogeneity
and spatial correlation. International Regional Science Review 30, 100–119.
Mittnik, S. and P. Zadrozny (2004). Forecasting quarterly German GDP at monthly intervals using monthly Ifo business conditions data. Technical Report CESifo Working Paper No. 1203, CESifo GmbH.
Polasek, W., R. Sellner, and W. Schwarzbauer (2007). Long-term spatial forecasts for regional systems. mimeo.
Ramanathan, R. (1995). Introductory Econometrics. Dryden Press/Harcourt Brace.
Schumacher, C. (2005). Forecasting German GDP using alternative factor models based on large datasets.
Deutsche Bundesbank Discussion Paper (24/2005).
Stock, J. H. and M. W. Watson (2002). Macroeconomic forecasting using diffusion indexes. Journal of Business
References K. Kholodilin, B. Siliverstovs, S. Kooths
Vesper, D. (1998). Bedeutung der Erg¨anzungszuweisungen des Bundes zur Linderung der teilungsbedingten Sonderlasten in den neuen Bundesl¨andern. Gutachten im Auftrag des Finanzministeriums Brandenburg, Berlin.
Ziliak, J. P. (1997). Efficient estimation with panel data when instruments are predetermined: An empirical
Appendix K. Kholodilin, B. Siliverstovs, S. Kooths
Appendix
Table 1: Descriptive statistics of the growth rates of real GDP of the German L¨ander (%)
Period 1992-1995 1996-2006
Min Mean Max St.dev. Min Mean Max St.dev.
Total all -4.4 3.6 16.5 4.9 -4.2 1.2 5.4 1.5 West L¨ander Baden-W¨urttemberg -4.3 0.2 2.1 2.6 -0.6 1.8 3.6 1.3 Bayern -1.8 1.0 2.7 1.7 0.8 2.6 5.3 1.3 Bremen -2.9 -0.3 1.4 1.6 -0.5 1.4 4.1 1.3 Hamburg 0.4 0.9 1.2 0.3 -4.2 1.0 5.4 2.5 Hessen -1.8 0.6 1.9 1.4 -1.7 1.2 3.4 1.5 Niedersachsen -1.0 0.6 2.1 1.3 -0.9 0.9 2.7 1.2 Nordrhein-Westfalen -2.4 0.4 1.8 1.6 -1.0 1.0 2.3 1.0 Rheinland-Pfalz -2.9 0.2 1.8 1.9 -1.2 1.2 2.7 1.2 Saarland -4.4 0.4 3.0 3.0 -1.1 1.9 4.4 1.7 Schleswig-Holstein -1.0 1.0 2.2 1.2 -1.5 1.0 2.7 1.1 Total West -4.4 0.5 3.0 1.9 -4.2 1.4 5.4 1.6 East L¨ander Berlin 1.1 2.2 3.4 0.9 -1.9 -0.7 1.1 0.9 Brandenburg 7.3 9.8 11.8 1.8 -1.5 1.3 4.0 1.7 Mecklenburg-Vorpommern 7.5 9.8 11.8 1.6 -0.6 0.6 3.3 1.2 Sachsen-Anhalt 7.5 10.2 12.2 1.8 0.1 1.3 2.5 0.9 Sachsen 4.3 9.1 12.4 3.0 -0.2 1.2 2.9 0.9 Th¨uringen 3.3 11.1 16.5 4.9 0.0 1.9 3.6 1.2 Total East 1.1 8.7 16.5 4.0 -1.9 0.9 4.0 1.4
Appendix K. Kholodilin, B. Siliverstovs, S. Kooths T able 2: Estimation results 1993 -2006 No spatial effects With spatial effects IO LS PO LS F EO LS F EGM M P S D M M LE F E S D M M LE P S E M M LE F E S E M M LE Minim um Median Maxim um bβ1 -0.186 0.052 0.230 0.162*** 0.064** 0.002 0.166** 0.082 0.220*** 0.064 bβ2 0.379** 0.647** 0.780*** 0.589*** 0.653*** 0.675*** 0.548*** 0.603*** 0.559*** 0.664*** bλ — — — — — — — — 0.577*** 0.607*** bρ — — — — — — 0.097 0.119* — — R 2 0.000 0.038 0.840 0.601 0.630 0.627 0.631 0.686 0.740 0.773 bβ1 denotes the estimate of the temp oral autoregressiv e parameter. bβ2 denotes the estimate of temp oral autoregressiv e parameter times re-unification dumm y. bλdenotes the co efficien t estimate of the re-unification-b o om dumm y. b ρ denotes the estimate of the spatial autoregressiv e parameter. ***, **, * – denotes significance at 1%, 5%, and 10% lev els.
Appendix K. Kholodilin, B. Siliverstovs, S. Kooths T able 3: F orecasting p erformance, all L¨ ander 2002-2006 h-step F orecasting No spatial effects Spatial effects ahead accuracy forecast measure IOLS PO LS F EO LS F EGM M P S D M M LE F E S D M M LE P S E M M LE F E S E M M LE h=1 T otal RMSFE 0.0155 0.0141 0.0146 0.0149 0.0140 0.0144 0.0140 0.0145 Relativ e RMSFE 1.000 0.915 0.943 0.966 0.908 0.935 0.906 0.937 h=2 T otal RMSFE 0.0238 0.0208 0.0223 0.0234 0.0203 0.0219 0.0201 0.0222 Relativ e RMSFE 1.000 0.873 0.935 0.980 0.852 0.918 0.841 0.931 h=3 T otal RMSFE 0.0308 0.0271 0.0287 0.0303 0.0266 0.0282 0.0263 0.0282 Relativ e RMSFE 1.000 0.879 0.930 0.984 0.863 0.913 0.852 0.916 h=4 T otal RMSFE 0.0397 0.0310 0.0351 0.0384 0.0293 0.0339 0.0282 0.0343 Relativ e RMSFE 1.000 0.782 0.885 0.967 0.740 0.855 0.712 0.865 h=5 T otal RMSFE 0.0494 0.0336 0.0399 0.0444 0.0312 0.0384 0.0295 0.0387 Relativ e RMSFE 1.000 0.680 0.807 0.898 0.632 0.777 0.596 0.784 T otal RMSFE = total ro ot mean squared forecast errors (RMSFE) computed for all the L¨ ander ov er all y ears together. Relativ e RMSFE = total RMSFE of eac h alternativ e mo del divided b y that of the b enc hmark mo del, for ev ery forecasting horizon h .