Visualizing Software Structure Understandability
Philippe Dugerdil and Mihnea Niculescu
Geneva School of Business Administration Univ. of Applied Sciences of Western Switzerland
Geneva, Switzerland
[email protected] [email protected] Abstract - Software architecture design is known to be driven
by the quality attributes we may want to satisfy. Among them, modifiability plays an important role since software maintenance takes the lion’s share in the software development costs. However, to successfully maintain a legacy system, the latter must be sufficiently understood so that the maintenance team will not introduce new bugs when correcting others. Then we present a software metric that we called the Autonomy Ratio (AR). We show this dynamic metric to be a good indicator of the system’s structure understandability. Since we end up with hundreds of values for a single system, we represent these values as a hierarchical map: the “Autonomy Ratio Map”. The contribution of the paper is to link the AR metric with theories of software comprehension, to show how the AR Map helps in assessing software structure understand-dability, and to present an empirical validation of it.
Keywords – program comprehension, software metrics, software visualization, dynamic analysis, software architecture.
I. INTRODUCTION
In December 2009 Forrester Research published a survey [29] showing that, on average, the share of the annual IT budget that go into ongoing operation and maintenance amounts to 60-77%. Besides, it is generally admitted that the main factor of the maintenance cost is program comprehension i.e. the time spent by the maintenance engineer to make sense of the code he must read. Estimations differ but it is generally agreed that a maintenance engineer spends at least 50% of his time trying to understand the code he must maintain [1]. Although there is no general agreement on what “software understanding” means exactly, a frequently cited statement in software engineering literature is that of Biggerstaff and Mitbander [7]: “A person understands a program when able to explain the program, its structure, its behavior, its effects on its operational context, and its relationships to its application domain in terms that are qualitatively different from the tokens used to construct the source code of the program”. However this statement does not give us any clues about the design of a software representation which would help the engineer understand software. It is worth mentioning that the above definition is close to the one used in pedagogy [15]. Indeed the ability to
explain a concept is used to check if children have understood
it. But, similarly, this does not help to teach the concept. However, in Biggerstaff and Mitbander definition we consider that the “relationship to the application domain” is a key factor. In fact, the same idea was proposed by Brooks as early as 1983 when he described program understanding as the process of re-creating the links between the domain problem and the program code by hypothesis generation, refinement and validation [9]. This idea also fits well with some of the classical definitions of understanding in psychology. For example the approach of Perkins [32] cited by Baron [6] presents the understanding as the process of mapping a structure (i.e. what we want to understand, also called the design by Perkins) to some purpose using arguments. The latter explain how the structure serves the purpose. The problem we deal with in this paper is to find a way to assess the potential understandability of some piece of software with respect to the application domain. Then, we developed a simple visual tool with which a maintenance engineer could evaluate the difficulty to understand the code before actually reading it. The corresponding view, that we called the Autonomy Ratio Map (or AR Map) is based on a metric we developed called the Autonomy Ratio (AR). Although in [17] we focused on the technique and framework to actually measure the AR, in this paper we present the interpretation of the AR for software comprehension. Then we introduce the AR Map and its usefulness to assess the comprehensibility of the software structure and we show a controlled experiment that validates our approach. Here is how the paper is organized. In section 2 we present the software understanding hypothesis on which our approach is based. In section 3 we give a presentation of the Autonomy Ratio (AR) metric. Section 4 introduces the Autonomy Ratio Map and its interpretation. Section 5 presents the application of our approach to a medium size open source system. Section 6 presents a controlled experiment to validate the AR metric. Section 7 presents the related work. Section 8 concludes the paper.
II. SOFTWARE UNDERSTANDING HYPOTHESIS Following the above cited work in experimental psychology, we equate the purpose of the software with the
function it must perform in the application domain context. Therefore, the understanding of the code will be improved if
Published in 23rd Australasian Software Engineering Conference (ASWEC) 2014. Sydney, April 7-10, 2014 which should be cited to refer to this work. DOI 10.1109/ASWEC.2014.17
the structure of the code maps well the structure of the business-related functions. More precisely what we wish to measure is the possibility to perform such a (mental) mapping. For many authors the concept of feature location
(FL) [24] is instrumental in software understanding. But, rather than working on yet another technique to perform FL, we moved one step back and asked: how well could the
features of the program be mapped to the actual structure of the code? Then, we formulated our understandability hypothesis:
The closer the structure of the software to the functional structure of the domain knowledge, the more understandable the software.
Here, the functional structure of the domain knowledge
means the decomposition of the problem to solve in business-level tasks and subtasks. Indeed, the purpose of the software is always given in relation to the application domain and the latter must be known by the maintenance engineer for him to understand the code. However, the difficulty arises when the maintenance engineer must understand the subparts of a system (i.e. any syntactic grouping of program elements, whatever the level of containment). Therefore, what could the understandability measurement criteria be and how could we measure it? The famous low coupling and high cohesion principles are often cited as good structuring principles. But what are their relationships to the system’s understandability? For example Counsell et al. proposed that the cohesion be an indicator of understandability [14]. But in this latter work the metric has been defined and applied at class level only. As such it does not help with the understanding of the larger structures of the system. Besides, when designing the structure of the software, there is usually more than a single level of decomposition. Indeed the subparts or components at one level are often nested in some other component at a higher level of containment. However, since the very notion of
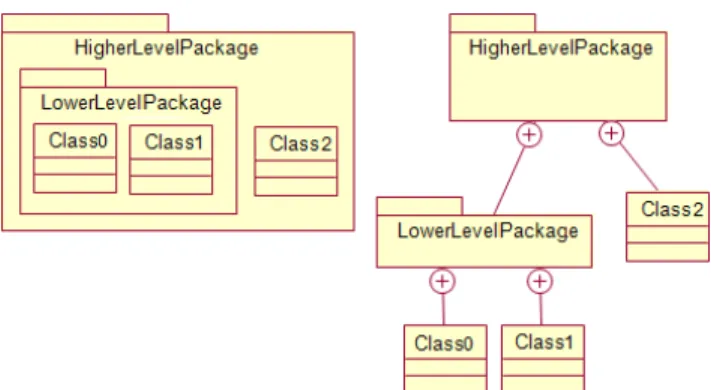
component has got a specific meaning in the literature [36], we prefer to use the term substructure to mean any syntactic grouping of programming elements above the method / procedure level. Hence a class, a package, a package of packages, a module or the system itself are considered substructures. A substructure may itself contain other substructures at different levels of containment. Therefore, the software is structured as trees of substructures in relation to the containment relationship. Figure 1 present such a hierarchy where the substructures are represented by packages. The containment relationship applies to whatever syntactic structure is used to set the substructure’s boundaries, and is programming language specific. Since a system is made of a hierarchy of substructures how could the understandability at each level be assessed? Is there any fundamental principle we could follow? In fact, thanks to late Herbert Simon, we know the characteristic a system must exhibit to be understandable [34] : it must possess the “tree-like hierarchical near decomposability” property. This characterizes a system:
• Which can be decomposed in subsystems recursively;
• Whose components’ behavior at each level of decomposition can, in a first approximation, be considered as nearly independent from the other components at the same level.
Fig. 1. Alternative UML representations of nested substructures This near-independence sub-property is a necessary condition to the understandability of a substructure because the latter could then be characterized by its own behavior only. But, this is not enough. According to our understandability hypothesis, the substructure must also be mappable to some function (purpose) in the domain. This mapping property is what is obtained when high functional
cohesion and low functional coupling is respected among substructures. Here the term functional means: related to the working of the software when running a business-relevant scenario. This gives us a clue about the assessment of the potential understandability of a software substructure: when running the system using a business-relevant scenario, the more independent a substructure when providing its services, the more understandable. Since we wish to understand the substructures of the software at all nesting levels, cohesion and coupling must be analyzed at all the containment levels. Hence we designed a new metric, the Autonomy Ratio (AR), to characterize the “functional independence” of a substructure whatever its level of nesting in the system. This metric is based on the dynamics of the system: if a substructure shows low dynamic coupling and high dynamic cohesion when the system is run according to some domain-relevant scenario, then the substructure is potentially understandable. The rationale is straightforward: by measuring the coupling and cohesion of the substructures when running the code, we do measure the functional relationships among the substructure. Now, if the measurements show the substructures to be nearly independent, they are more likely to be mappable to functions and subfunctions in the corresponding process. Conversely, if the substructures are not independent but tightly coupled, they cannot be individually mapped to functions and subfunctions. Since the AR measures the functional independence, it is an indicator of the potential for a substructure to be mappable to some function hence its understandability.
Since all the substructures of a system will be assigned a value for the AR, we end up with a lot of numbers to interpret. We must therefore propose a way to present a
global view of all the values to show the global understandability of the system structure. The solution is to design a hierarchical representation in which the value for each substructure whatever its nesting level is represented by some color on a color scale. Then, the maintenance engineer could easily identify the locations in the system where the substructures will be harder or easier to understand.
III. AR METRIC
A. Motivation
Since we must assess the potential understandability of the substructures in relation to the business-related functions, we do not target the code level which has been widely covered in the literature in relation with code complexity metrics. We stay at a higher level of granularity. Again, the Autonomy Ratio (AR) metric measures the potential for a substructure to be (mentally) mappable to some business related function [17]. In other words, the AR is an evaluation of the independence level of a substructure when delivering its responsibilities or services. This is similar to the above-mentioned near decomposability [34] property. The higher the AR the more autonomous the substructure and the more autonomous a substructure the higher the chance to be able to map it to some cohesive business related function. Therefore: theunderstandability level of some software is the degree to which its substructures are autonomous in delivering their business-related responsibilities.
The autonomy of the substructures must be measured when the system is delivering the business services it has been built for i.e. at runtime. The measurement technique is to run the system according to the use-cases instances (scenarios) and analyze the dynamic interactions that happen between the substructures at each and every level in the system’s structure. From these interactions we can compute the AR for each substructure of the hierarchy. As a result we get a distribution of AR values for all the substructures of the system whatever the level of containment.
B. Defining the Autonomy Ratio
The autonomy Ratio is based on the well-known coupling and cohesion metrics. But we adapted the standard definition of coupling and cohesion from Pages-Jones [31] to the substructure concept:
• Cohesion of a substructure: strength of the functional relatedness of the elements contained within the substructure.
• Coupling of a substructure: strength of the functional relatedness of the substructure with other substructures. Now, because the substructures can be considered at different levels of containment, we must clarify how we interpret the functional relatedness. For the cohesion metric, this represents the collaborations [39] between the elements directly contained by the substructure, i.e. its direct children in the containment tree, when the substructure delivers its services. For example, in figure 1, the elements considered to compute the cohesion of the substructure “HigherLevelPackage” are “LowerLevelPackage and “Class2”. Consequently we observe the runtime
collaborations (measured by the message sent) between these two substructures only. We will not observe the collaborations among the elements inside “LowerLevelPackage” (i.e. Class0 and Class1). For the coupling metric, the functional relatedness represents the collaborations (measured by the message sent) between the substructure considered with all its children at any level of nesting, and the substructures outside it when the substructure delivers its services. But we exclude all messages sent inside the substructure at any level. With these definitions in mind, the autonomy ratio (AR) [17] for a substructure “s” is conceptually defined by:
autonomy_ratio(s) =
cohesion(s) / (coupling(s) + cohesion(s)) * 100% iff coupling(s) + cohesion(s) > 0, undefined otherwise.
Where cohesion(s) and coupling(s) comply with the Pages-Jones [31] definitions. Let us consider a substructure which has no coupling with any other substructure but does contain collaborating elements. In this case AR = 100 and the substructure could be assigned some specific responsibility because it is cohesive and does not delegate any work outside it. On the other extreme, if there are no interacting elements inside the substructure when its delivers some service but there is coupling, then AR = 0. In this case the substructure represents a set of unrelated non-autonomous services whose grouping in the substructure is not based on some functional relatedness but on some other criteria. It will be difficult to describe the responsibilities of the substructure
as a whole in application domain terms. Its understanding will then be challenging. Finally, in the case both coupling and cohesion are 0, the AR is undefined. In this case, the substructure is better described as a library of functions and we will not be able to say much about the responsibilities of the substructure in domain terms. Between the two extremes (AR=0 and AR=100) the possibility of the assignment of a cohesive responsibility to a substructure will vary in strength. It is worth mentioning that even if the name of a substructure may give information on its domain-related semantics, the AR metrics will nonetheless allow an engineer to evaluate how easy it is to understand its working. We will say a few words about this in the conclusion.
C. Measuring the AR
The Autonomy Ratio (AR) is measured from the interactions between the substructures when the system is delivering its business-related services (i.e. dynamic analysis [37]). Although dynamic analysis has been used to analyze the coupling between classes [4][23], it has not been used to assess the interaction at higher levels of system structure than the classes. As far as software architecture assessment is concerned there is no consensus on any single metric [10], since this process is related to the software quality attribute considered [22]. Since we are interested in the distribution of responsibilities [39] among the substructures, we must observe the variety of the interactions not their raw number. In other words when two substructures interact, the sharing of responsibilities among them will be identified by the kind
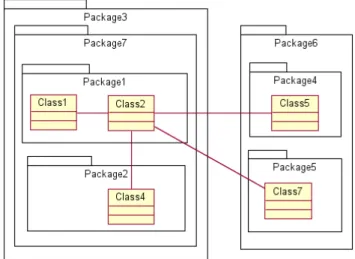
of messages exchanged, not by the number of messages. For example, the sharing of responsibilities will be much higher if the two substructures exchange 10 different messages than if they exchange 10 times the same message. In the first case there will be a large range of collaborations but in the second case the collaboration will be very specific. Figure 2 illustrates the collaborations that are considered when computing the AR of some substructure (the associations represent dynamic collaboration). Let us consider the substructure named Package3. The collaboration to consider for the computation of its cohesion is represented by the link labeled “1”. The collaboration between Class1 and Class2 is not taken into account because these two classes are not direct children of Package3. But the link labeled “1” is relevant because it represents the collaboration between Package1 and Package2. Even if the latters are considered black boxes from the viewpoint of Package3, one could still observe the collaboration labeled “1”. When computing the
coupling of Package3 we will consider the collaborations labeled “2” and “3” since they link the children of Package3, whatever the level of nesting, to substructures outside Package3. As we can observe in this example, although the collaboration are always implemented by classes, the computation of the cohesion and coupling metrics for a given substructure will depend on the scope of the collaborations as well as the level of nesting. Now, to count the number of dynamic messages sent among substructures, we have two options. We could consider either the object-level messages or the class level messages, what Arisholm, Briand and Foyen [4] have called “object level method import” or “class level method import”. Depending on the kind of import we choose, there will be an impact on the computation of the AR for the substructure whose children inherit behavior from another substructure. Since our goal is to measure the closeness of the mapping of a substructure to some business-related function, we must consider all the responsibilities including the inherited ones.
Fig. 2. Collaborations among substructures
Then we use the “object-level distinct method import” to compute the metrics. Finally, to identify the distinct messages we use the 4-uple [C1, m1, C2, m2], where the method m1 in some instance o1 of class C1 calls the method
m2 in some instance o2 of class C2; m1 and m2 are identified by their signature and C1, C2 by their fully qualified name.
D. Measurement process
Since we must analyze the collaborations among substructures when running the business-relevant scenarios, the first step is to collect all the relevant use-cases of the system. Simultaneously, the system is instrumented [5] so that an execution trace could be generated. Instrumentation is a technique where some tracing statements are introduced in the source code of each method of a system. When the system is run, the method entries and exits are recorded in a file. Once the execution trace is generated for some use-case instance (scenario) it is analyzed offline to identify the collaborations between the objects and to compute the AR value for all the substructures involved. In the case of Java, we would for example compute the AR for all the packages of the system at all levels of nesting.
E. AR sensitivity to structuring
Since we are interested in the potential mapping of the substructures to some business-related functions, the way the substructures are nested plays a fundamental role. Let us take the example of figure 2. If we design a new package inside Package3 to contain its two children packages (figure 3), the AR of Package3 would be fundamentally changed. Indeed the cohesion of Package3 is now 0 since there are no collaborations among its children (Package7 is alone). But the coupling has not changed. Therefore the AR is 0 and Package3 is supposed to be difficult to map to a single business function. This is consistent with our interpretation of the AR: the behavior of Package3 is indistinguishable from that of Package7. Hence no specific behavior can be attributed to Package3. Therefore its purpose cannot be explained: it is “absurd” in the sense that it has no meaning in itself. In other words, we cannot associate a specific business-related function to it that would be different from the business-related function associated to Package7.
Fig. 3. Adding one level of containment from fig 2 3
2 1
However, we are well aware that such an extra package could have been introduced to group “related” packages together. But this “relation” is not reflected in the working of the program, it is defined outside it, in some other knowledge space, and has nothing to do with the working of the program, hence the AR value.
IV. AUTONOMY RATIO MAPS
A. Introduction
When computing the AR for some system, what we are left with is a set of numbers. The next step is to display these numbers on a map that could be interpreted globally. To build a hierarchical representation of the AR values of all the substructures of a system, we chose the Microsoft TreeMapper tool that displays nested structures as boxes and allow coloring the boxes according to some metric. Each of the boxes in the AR map represents a substructure in the containment hierarchy of the system, but the class level. For example, in the Java context, we would represent the packages at all levels, but not the classes. Each box is assigned a label and a set of numbers (Figure 4). Since the AR Map is computed from the analysis of the executed code, it represents only the substructures that are involved in the execution together with their parents up to the root. The label is the short name of the substructure (i.e. the package in Java). The first number is the AR value (in %). The numbers in brackets represent the dynamic cohesion and coupling of the substructure. The last number is the total number of method exports by the substructure i.e. the number of distinct messages sent by any instance of any class located outside the substructure to any of the instances of any of the classes located inside the substructure whatever the level of nesting.
Fig. 4. AR Map elements
This export metric represents the extent to which the functionality in the substructure is used by the other substructures external to it. It will tell the maintenance engineer what is the importance of the substructure in the implementation of the scenario. Since the export metric value is based, like the AR, on the distinct messages, a high export metric means that the substructure offers a lot of services to the other substructures. The representation of all the substructures involved in some execution of the system with all the nesting levels represents the AR Map [30]. Figure 5 presents such a map.
B. Substructure color mapping
Here are the rules to set the labels and color of the boxes (and their counterpart on a black and white printout):
• If AR > 0, all numbers are displayed. The color extends from light green (light grey) (AR=1) to dark green (dark grey) (AR=100).
• If AR = 0, all numbers are displayed and the box is colored red (dark grey with a texture).
• If AR is not defined (cohesion = 0 and coupling = 0), only the export value is displayed. The box is colored pink (light grey with a texture).
If some substructure is not used in the current scenario but it is used in some other scenario with which we would like to compare the current one, we add this “silent” substructure and we color it white. Then, the TreeMapper will position the boxes at the same locations in all scenarios enabling a quick visual comparison.
C. Interpretation
In an AR Map the color represents the degree of potential understandability. Light green (light gray) substructures are barely understandable since they have a low autonomy when fulfilling their responsibilities. In contrast, dark green (dark gray) substructures are very autonomous and will then be easier to map to some business-related function, hence to understand. A pink (light gray with texture) substructure (cohesion = 0, coupling = 0), is potentially hard to understand as a whole, since its contained elements are not related to each other when the substructure is delivering its services. In other words it will be difficult to assign it a single cohesive business-related function. It could be better described as a library of functions.
Fig. 5. AR Map
A dark red (dark gray with texture) substructure (AR=0) has a non-cohesive content but some level of coupling. This means that it is not a simple library of function since there are collaborations with other substructures. As far as understanding is concerned, the situation is worse than pink-colored substructures because of the outside collaborations. When running an AR Maps construction process, it is important to gather all the business relevant scenarios to be able to analyze all the substructures implementing these
scenarios. Since business-level maintenance will be specified in relation to such scenarios, the engineer will know in advance where the understanding of the structures will be challenging.
V. CASE STUDY:ARGOUML
A. Introduction
In our experiment, we ran and analyzed 7 different scenarios which cover a large range of the functions of ArgoUML [2], an open source UML modeler. Here are the scenarios we ran:
1 Create a use case diagram and save the project 2 Create a class diagram and save the project 3 Create a sequence diagram and save the project 4 Create a state diagram and save the project 5 Change the design critics parameters of a project 6 Print the all the projects
7 Export all the projects to XMI
In this experiment 81 out of its 95 packages have been involved, hence 85 %.
B. Analysis of one AR Map
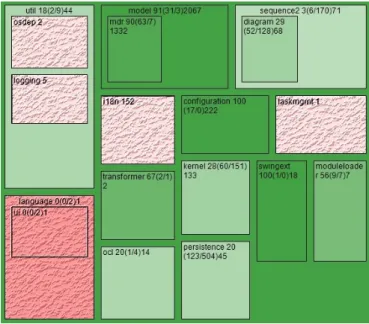
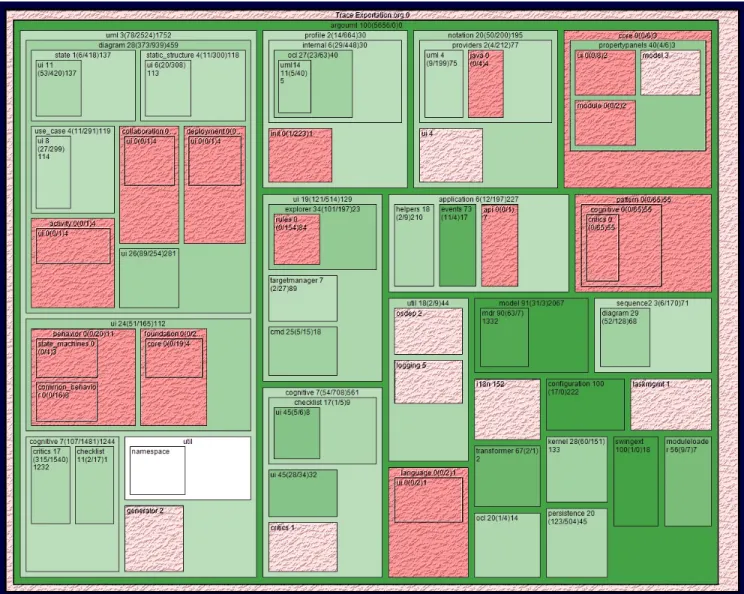
Figure 6 presents the AR Map for the 7th scenario above. The title of the top level package contains the name of the scenario for which the AR map has been generated. The scenario is run as follows:
• Open a set of UML projects in the workspace with different kinds of diagrams.
• Launch the export to XMI files function for each of the project one by one.
• Close all the projects.
From this AR Map we can observe that about 30% of the substructures involved may be relatively easy to understand (colored medium to dark green (medium to dark gray)). At the other extreme about 50% of the elements may be difficult to map to business-related function hence to understand (pink and red colored elements (light and dark gray with texture)). The remaining elements have a low to medium AR (colored light green (light gray)) and therefore may be more or less hard to understand. In all the 7 scenarios we ran, the AR Maps were very similar: each package got close AR values across all the different scenarios. This could be interpreted the following way: • The packages with high AR implement cohesive
business-related functions that stay cohesive across all the scenarios. These packages may then represent some well-defined pieces of behavior, used consistently. • The packages with low AR do not implement cohesive
business functions. Rather, they are more like repositories of reusable code that rely on other packages to perform their task.
• The packages with AR = 0 or undefined could be considered as libraries since they seem to play the same role across all scenarios.
Of course, there is no guarantee that the AR values will stay the same across all possible scenarios for some given
software. But this is OK since the AR represents the way the scenarios have been implemented. For example, we may well have a low AR for a substructure in a given scenario and a high AR in another one. This might simply represent a substructure offering 2 sets of services implemented using 2 programming styles. This suggests that the analysis of the AR Maps across different scenario may provide some clues about the programming styles in the substructures. In summary, the AR Map tells the maintenance engineer the relative difficulty to understand the purpose of the substructures at business level, even before reading the corresponding code.
VI. EMPIRICAL ASSESSMENT
Now we must check if the AR metric does indeed represent the subjective difficulty to understand some code. Then we conducted a controlled experiment with teaching assistants and students from our institution. The experiment was designed according to the standard methodology used in software engineering experimentation [21]. The research question is the following: given an application substructure (package), does its AR metric truly reflect a maintainer’s difficulty to understand this substructure’s code?
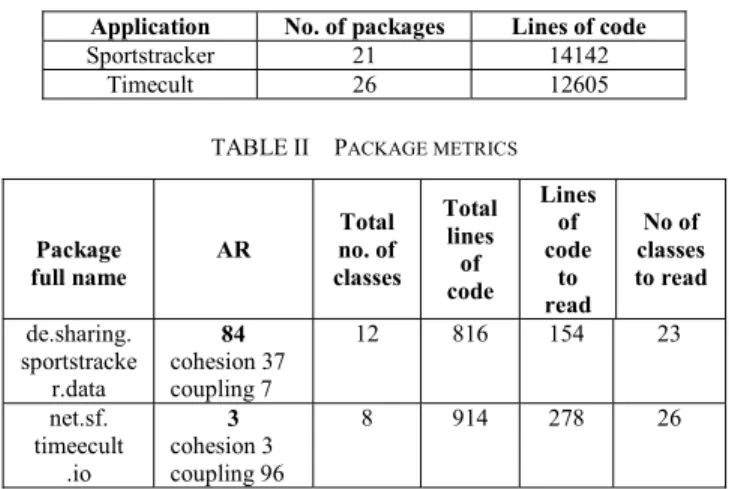
The experiment was organized the following way. First we chose two moderately complex open source applications (Sportstracker [35] and Timecult [38]) in which we chose two packages, one with an AR of 84 and the other with an AR of 3 (see Table II). These two applications and the two packages had comparable size and structure, as shown in the Table I and II.
TABLEI APPLICATION METRICS
Application No. of packages Lines of code
Sportstracker 21 14142
Timecult 26 12605 TABLEII PACKAGE METRICS
Package full name AR Total no. of classes Total lines of code Lines of code to read No of classes to read de.sharing. sportstracke r.data 84 cohesion 37 coupling 7 12 816 154 23 net.sf. timeecult .io 3 cohesion 3 coupling 96 8 914 278 26
Even the amount of comments in the source code is similar. Then, we prepared five questions on each packages and designed a multiple-choice questionnaire. Nine people participated to the experiment. We carefully chose the question so that the correct answer could only be found by understanding the code. Before the experiment, we explained the participant the functions of each application and ran a demo of it. The hypothesis to test in this experiment is:
The value of the AR metric of a package correlates positively with the difficulty for an engineer to understand its code.
Since the applications are rather small (see Table I), the scenarios used to generate the AR metrics involve the complete functionality of the applications. In Table II, Lines to read and Classes to read represent the approximate amount of code to analyze to gather enough information to answer the questions. But the code to read may be scattered in several other packages. The effects of uncontrolled variables, which represent threats to the validity of our experimentation, have been minimized as much as possible. Here they are : the level of experience of the participants: the
students and assistants were enrolled in the same Software Engineering (SE) course; the learning effect: the packages are from two different applications, so the knowledge acquired from the first package does not impact the understandability of the second package; the participant familiarity with the tools: the tools to navigate the code in the Eclipse IDE have been presented to the participants before the experiment; participant enthusiasm: the participation to the experiment gave the students some advantage in the associated SE course.
Fig. 6. AR Map of ArgoUML. “Export” scenario TABLEIII RESULTS
Results Score, per participant, to the questions on de.sharing.sportstracker.data (max. 5 pts.) 2.5 2.5 3 5 2.5 2.5 5 1.5 4
Score, per participant, to the questions on net.sf.timeecult.io (max. 5 pts.) 2.5 1 1 2 2 1 4 2 3 Calculations Mean of difference T-value p-value -1.11 -3.16 0.006675
The experiment was done in a fixed time of two hours, including 20 minutes for instruction. The results are shown in table III in the form of a standard dependent t-test for paired-samples. Since the package with higher AR is expected to produce higher scores, we use a one-tailed hypothesis for the computation of the t-test for a 0.05 significance level. The very low value of p-value in Table III supports the test hypothesis: the AR metric of a substructure does correlate positively with the subjective difficulty to understand its code. Hence the AR can be considered a
representation of code understandability and the AR Map a view of the system’s structure understandability.
VII. RELATED WORK
First of all, it is worth mentioning that the notion of cohesion does not have a well-accepted definition in the OO community [13], while coupling has been more widely studied [8]. Despite this fact, many papers have dealt with coupling and cohesion, but at the level of the classes. The seminal work of Chidamber and Kemerer [11] was about the first to propose a formal definition of the coupling metric (Coupling Between Object, CBO) and cohesion metric (or, rather, the lack of cohesion in methods, LCOM).However, it did not address the problem of larger program substructures above the class level. Briand, et al. redefined the LCOM metrics of Chidamber and Kemerer to remove some ambiguity by presenting five variants [8], but they stayed at the level of the classes. Gupta and Rao [19] proposed a dynamic metric for module cohesion based on output module variables utilization. The notion of module here is the equivalent of a class, so the work is again restricted to the level of the classes. The work of Arsholm et al. [3][4] propose a precise definition of class coupling by distinguishing the object level and class level metrics as well as the elements that are counted: the messages, the methods or the classes. However, this work concentrated on the class level. The use of the cohesion metric as a way to represent software comprehensibility was already suggested by Counsel et al. [14]. However, the author only considered traditional (i.e. static & class based) cohesion metric, while the AR is based on dynamic techniques and works at all granularity levels. Moreover the AR is grounded on some fundamental principles of system understandability proposed long ago by Simon [34] as well as on some classical comprehension theory in psychology [6], approaches that are seldom referenced in the software engineering community. Elish [18] conducted a recent study to explore the relationship between existing package metrics and understandability. The metrics used in this work are based on the proposal of Martin [28] and are all static. Lin et al. [26] proposed a framework for evaluating software understand-dability trough a fuzzy matrix which uses the following six factors: 1) documentation, 2) source code comments ratio, 3) number of components, 4) cognitive functional size metrics, 5) Halstead complexity metrics and 6) code and data spatial complexity. Halstead metrics as well as the cognitive functional size metrics [33] are classical metrics measuring the complexity in term of number of conditional branches, operations and operands. All of them evaluate complexity from a static point of view, i.e. they do not rely on the observation of the working of the software to estimate the understandability. Moreover, the framework of Lin et al. only evaluates the global understandability of the entire system, which is far less precise than the AR metric which evaluates each package and sub-package. J. Hwa et al [20] proposed a method for calculating per package (and sub-package) metric for understandability. There are some important differences with the AR metric. First, their
analysis is static. Second, the cohesion of modules is calculated without considering sub-packages, which is clearly a short-coming. Moreover the method is lacking precision because it relies on heuristics to normalize the different metrics that must be combined. The work of Lui and Milanova [25] deals with the ways to combine static and dynamic analysis for the measurement of the coupling among classes. However, the coupling of higher level structures is not addressed. Marchesi [27] proposed a metric for the assessment of the coupling between packages which count all dependencies between classes except the inheritance relationship. Our work differs from it because our metric does consider the containment relationship between packages. In contrast to most of the work in software visualization for software understanding our approach is grounded on fundamental principles in systems theory, psychology and pedagogy. As an example Ducasse et al. [16] presented a new view that is supposed to help with the understanding of the package relationships. But, the authors do not explain what they mean by understanding the relationships. Besides, their view shows only the coupling and inheritance of the classes in the packages. The same is true in the work of Cornelissen et al. [12] where the proposed execution trace visualization technique is assessed through a controlled experiment. Since the experimenters must answer questions on the program to maintain, we could infer that
understanding is equated to the capacity to answer questions about the code. But there is no information to what exactly is meant by code comprehension.
VIII. CONCLUSION
In this work we propose a new way to analyze the
potential understandability of the structure of some legacy software. This means that a maintenance engineer could know, before reading any specific piece of the systems’ code, what parts he may have difficulty to understand and what parts might be easier to grasp. Our empirical experiment seems to show that the AR metric could be a good indicator of the intellectual effort needed to understand the components of the software. However, our approach does not deal with the lowest level of understanding, i.e. the code level, which is well addressed in the literature about the code complexity metrics. The AR Map can be considered complementary to them. It also complements the numerous approaches of feature to code mapping reported in the literature. Indeed, the AR Map may tell the maintenance engineer if the chosen feature mapping technique could allow him to “understand” the identified components, depending on where, in the code, the features are located. Of course, we are well aware that the semantics of the sub structures of the programs may be inferred from their names. Therefore, we may be tempted to say that the mapping from the substructures to some business-related functions can be done based on these names only. Although this can be true, it must be highlighted that such a mapping relies on some external source of knowledge, in particular the application domain knowledge model. The substructure’s names must therefore be interpreted by the developers in relation to this model. This technique relies on three hypotheses:
• The understanding of the domain model by the initial developer is good enough so that he would name the packages correctly.
• Each component does indeed implement the task corresponding to its name and only this.
• The domain model is shared by all the software engineers who will maintain the software.
Often, these hypotheses are not verified in the real life. Indeed we can encounter substructures whose behavior significantly differs from what their name seem to suggest. But the AR Map can also provide some help here. If, with the help of the AR Map, we find that some component implements a cohesive business-related function, we may further check that the function is the one suggested by the name of the component. But if the component is not cohesive, then it will be hard to map it to the business function the name suggests.
As a final word, the building of the AR Map is simple to perform. It can be applied to any programming technology provided that the code can be instrumented to record the execution trace and that substructures can be syntactically identified. Although our technique has been applied to a system of moderate size, it is scalable to any size because our representation is hierarchical: it applies to whatever level of software elements grouping. This is one of the key advantages of our work.
In summary, the contribution of this paper is to define the AR Map, its semantics and its interpretation. A controlled experiment confirmed the positive correlation between the AR and the level of understanding of the code by the participants. In a future work we intend to design an enhanced view where the export metric could be represented as yet another graphical dimension. In this way the “importance” of a substructure could be assessed simultaneously to the AR.
REFERENCES
[1] Amyot D., Mansurov N., Mussbacher G. - Understanding Existing Software with Use Case Map Scenarios. Proc of the 3rd SDL and MSC Workshop (SAM’02), 2002.
[2] http://argouml.tigris.org
[3] Arisholm E.– Dynamic Coupling Measures for Object-Oriented Software. IEEE Symposium on Software Metrics (METRICS’02). 2002.
[4] Arisholm E., Briand L.C., Foyen A. – Dynamic Coupling Measurement of Object Oriented Software. IEEE Trans. on Software Engineering 30(8). 2004.
[5] Ball T., - The Concept of Dynamic Analysis. Proc. of the 7th European Software Engineering Conference (ESEC’99), 1999. [6] Baron J. – Thinking and Deciding, 4th edition. Cambridge University
Press, 2008.
[7] Biggerstaff T.J., Mitbander B. - Program understanding and the concept assignment problem. Comm. of the ACM, 37(5) 1994. [8] Briand L.C., Daly J.W., Wust J. - A Unified Framework for Coupling
Measurement in Object-Oriented Systems. Empirical Software Eng., vol. 3, no. 1. 1998.
[9] Brooks R. - Towards a theory of the comprehension of computer programs. Intl. J. of Human-Comptuer Studies, 18(6):543{554, June 1983.
[10] Chastek G., Ferguson R. -Toward Measures for Software Architectures. Software Engineering Institute, Tech. Note CMU/SEI-2006-TN-013, 2006.
[11] Chidamber S.R., Kemerer C.F.– A Metrics Suite for Object Oriented Design. IEEE Trans. on Software Engineering 20(6). 1994.
[12] Cornelissen B., Zaidman A., van Deursen A., van Rompaey B. - Trace Visualization for Program Comprehension: A Controlled Experiment. Proc IEEE Internation Conference on Program Comprehension, 2009.
[13] Counsell S., Swift S., Carmpton J. - The Interpretation and Utility of Three Cohesion Metrics for Object-Oriented Design. ACM Trans on Software Engineering and Methodology, Vol. 15, No. 2. 2006. [14] Counsell S., Swift S., Tucker A. - Object-oriented cohesion as a
surrogate of software comprehension: an empirical study. IEEE Int. Workshop on Source Code Analysis and Manipulation (SCAM’05), 2005.
[15] de La Garanderie A.- Comprendre et Imaginer (To Understand and To Imagine). Edition du Centurion, Paris, January 1987.
[16] Ducasse S., Pollet D., Suen M., Abdeen H., Alloui I. - Package Surface Blueprints: Visually Supporting the Understanding of Package Relationships, Proc IEEE ICSM 2007.
[17] Dugerdil Ph. - Assessing Legacy Software Architecture with the Autonomy Ratio Metric. Software Engineering an International Journal (SEIJ) Vol1 N°1, 2011.
[18] Elish M.O. - Exploring the Relationships between Design Metrics and Package Understandability: A Case Study, IEEE ICPC 2010
[19] Gupta N, Rao P. - Program Execution Based Module Cohesion Measurement, Proc. of the 16th Int. Conf. on Automated Software Engineering, 2001.
[20] Hwa J., Lee S., Kwon Y.R. – Hierarchical understandability assessment model for large-scale OO system. IEEE APSEC 2009 [21] Juristo N., Moreno A.M. - Basics of Software Engineering
Experimentation. Springer, 2001
[22] Kazman R., Klein M., Clements P. - ATAM: Method for architecture Evaluation. Technical Report CMU/SEI-2000-TR-004. 2000. [23] Kavitha A., Shanmugam A. - Dynamic Coupling Measurement of
Object Oriented Software Using Trace Events. IEEE Int. Symposium on Applied Machine Intelligence and Informatics (SAMI ’08). 2008. [24] Kazato H. et al. - Incremental Feature Location and Identification in
Source Code. Proc. 17th European Conf. on Software Maintenance and Reengineering 2013.
[25] Lui Y., Milanova A.– Static Analysis for Dynamic Coupling Measures. Conf. of the Center for Advanced Studies on Collaborative research (CASCON '06) 2006.
[26] Lin J.C., Wu K.C. - Evaluation of software understandability based on fuzzy matrix, IEEE 2008
[27] Marchesi M. - OOA Metrics for the Unified Modeling Language, Proc. of the 2nd Euromicro Conf. on Software Maintenance and Reengineering, 1998.
[28] Martin R. - Agile Software Development : Principles, Patterns and Practices : Prentice Hall, 2003.
[29] Murphy Ph. - Beyond Benchmarks: Estimate Your Application Maintenance Costs Using Internal Data. Forrester Research, Dec. 2009.
[30] Niculescu M. - Evaluating the efficiency of the Autonomy Ratio Metric for assessing ArgoUML architecture. BS Thesis, Geneva school of Management, November 2012.
[31] Page-Jones M. - The Practical Guide To Structured Systems Design, Yourdon Press 1980
[32] Perkins D.N. – Knowledge as Design: Critical and Creative Thinking for Teachers and Learners. Hillsdale, NJ: Lawrence Erlbaum Associates. 1986.
[33] Shao, J. and Wang Y., A new measure of software complexity based on cognitive weights, Canadian conf. on Electrical and Computer and Engineering, 2003.
[34] Simon H.A. - The architecture of complexity. In: The Sciences of the Artificial, MIT Press, 1969. (Reprinted in 1981).
[35] http://sourceforge.net/projects/sportstracker/
[36] Szyperski C., Gruntz D., Murer S. - Component Software: Beyond Object-Oriented Programming. Addison-Wesley , 2002
[37] Tahir A., MacDonell S.G. - A Systematic Mapping Study on Dynamic Metrics and Software Quality. Proc IEEE ICSM 2012 [38] http://sourceforge.net/projects/timecult/
[39] Wirfs-Brock R., McKean A. - Object Design: Roles, Responsibilities, and Collaborations. Addison Wesley 2003.