From Sensing to Action:
Quick and Reliable Access to Information
in Cities Vulnerable to Heavy Rain
Santiago Gaitan, Luca Calderoni, Paolo Palmieri, Marie-claire ten Veldhuis,
Dario Maio
Member, IEEE,
M. Birna van Riemsdijk
Abstract—Cities need to constantly monitor weather to an-ticipate heavy storm events and reduce the impact of floods. Information describing precipitation and ground conditions at high spatio-temporal resolution is essential for taking timely action and preventing damages. Traditionally, rain gauges and weather radars are used to monitor rain events, but these sources provide low spatial resolutions and are subject to inaccuracy. Therefore, information needs to be complemented with data from other sources: from citizens’ phone calls to the authorities, to relevant on-line media posts, which have the potential of providing timely and valuable information on weather conditions in the city. This information is often scattered through different, static, and not-publicly-available databases. This makes it impossible to use it in an aggregate, standard way, and therefore hampers efficiency of emergency response. In this paper we describe information sources relating to a heavy rain event in Rotterdam on October 12-14, 2013. Rotterdam weather monitoring infrastructure is composed of a number of rain gauges installed at different locations in the city, as well as a weather radar network. This sensing network is currently scarcely integrated and logged data are not easily accessible during an emergency. Therefore, we propose a reliable, efficient and low-cost ICT infrastructure that takes information from all relevant sources, including sensors as well as social and user contributed information and integrates them into a unique, cloud-based interface. The proposed infrastructure will improve efficiency in emergency responses to extreme weather events and, ultimately, guarantee more safety to the urban population.
Index Terms—Smart City, Urban ICT Infrastructures, Weather Sensing, Heavy Rain.
I. INTRODUCTION
T
HE increasing use of sensors in urban environments is making cities smarter. Smart cities are high-performance S. Gaitan and M. ten Veldhuis are with the Department of Water Management, Delft University of Technology, The Netherlands (e-mail: [email protected]; [email protected]).L. Calderoni and D. Maio are with the Department of Computer Science and Engineering, Universit`a di Bologna, Italy (e-mail: [email protected]; [email protected]).
P. Palmieri is with the Department of Software and Computer Technology, Delft University of Technology, The Netherlands (e-mail: [email protected]).
M. B. van Riemsdijk is with the Department of Intelligent Systems, Delft University of Technology, The Netherlands (e-mail: [email protected]).
c
2014 IEEE. Personal use of this material is permitted. Permission from IEEE must be obtained for all other uses, in any current or future media, including reprinting/republishing this material for advertising or promotional purposes, creating new collective works, for resale or redistribution to servers or lists, or reuse of any copyrighted component of this work in other works.
urban contexts, featuring a constant flow of information be-tween citizens, city stakeholders and city intelligent infras-tructures. An urban ICT infrastructure can be considered as the brain of the city; it processes sensed information by the body, and coordinates intelligent reactions to deal with the environmental conditions [1]. In order to provide contextu-alized and location-aware services to each city actor, sensor networks are deployed within the city. The aim of these sensors is to constantly provide raw data gathered from the city, and consequently enable real-time monitoring, interaction and reaction to the different city events [2], [3].
Along with the spreading of sensor networks, computing and storage virtualization through dedicated ICT platforms is growing as well. Cloud computing relies on the usage of re-mote hardware and software resources as services. Connecting sensors and actuators to an urban ICT infrastructure enables users to transparently access the sensing networks. This is an Internet of Things (IoT) abstraction [4], [5], in which each sensor becomes an accessible object.
As in many other smart city scenarios, water management can greatly benefit from the use of smart software platforms and widespread sensing, both during regular operation and scheduled maintenance, and in emergency/unforeseen situa-tions. In particular, insights from the intelligent combination of disparate data received from various sources (from sensors and metering devices to crowd-sensed data) can significantly help to better manage the water infrastructure, assets and operations. In this context, it is crucial to design systems that allow the analysis of heterogeneous sources and the integration of social data, with a particular focus on a distributed sensors and information infrastructure. Important parts of the system are advanced visualization and correlation tools.
Urban water management becomes crucial during heavy rain events when flooding may occur, causing damage and social disruption [6]–[9] as a result of short-lasted, intense precipitation peaks. Since intense rains are expected to become heavier and more frequent as a result of climate change, pluvial related damage is expected to increase in the future [6], [10], [11]. Urban water systems respond rapidly to rainfall as a result of their high degree of imperviousness. For this reason, localized, real-time information is required to react adequately during emergency situations. A system that allows quick, coordinated, and to the point intervention during extreme rainfalls, based on the aggregated information and with a high level of automation, is needed. Intelligent use of information
IEEE SENSORS JOURNAL 2
from multiple urban sensors can provide detailed, real-time insights into the urban flooding process and allow citizen’s and local administration to take timely action and prevent urban flooding impacts. The design of such a system, based on the existing sensor infrastructure of the city of Rotterdam (The Netherlands) is the aim and contribution of this paper. While the technical tools we use in the design are not innovative
per se, the challenges imposed by the urban environment are unique, and we take an integrated approach in our proposed solution.
A. Related Works
Many solutions have been recently proposed for the design of ICT infrastructures for smart cities. Such proposals usually aim to define a city brain [12] able to collect raw data from all around the urban context, and expose value-added services to citizens and other stakeholders. These models are designed with integration of both human and sensor-based information in mind [13]. Human movement dynamics in crowded cities have been discussed as well [14]. Cell phone traces represents a widespread source of information to understand urban mobility patterns, and can be useful for risk and disaster management and prevention [15]. Spatio-temporal dependence between aggregations of mobile network traffic and distributed weather data have been also previously explored statistically, allowing for a context-aware evaluation of the link between environmental and social dynamics [16]. Cellular signals were studied for modelling rainfall distribu-tions at a national level. The signal interference caused by rain drops was measured against the expected signal strength. In this way, the microwave antennas, initially intended for cellular communication, were used as a network of weather sensors delivering spatio-temporal distributed data [17]. Innovative, real-time, distributed, and cost-effective weather sensing in poorly instrumented areas is addressed in the Trans African Hydro-Meteorological Observatory (TAHMO). The joint use of tailor-made sensors, RaspberryPis, and IBMs IOW platform have been tested as part of the TAHMO activities. The resulting gadgets proved to be able to deliver real-time weather data via the internet1. A citizen-based observatory of water
systems, which allows citizens and communities to become active stakeholders in information capturing, evaluation and communication, is being developed within the project WeSen-seIt2. At Delft University of Technology, the SHINE project
aims to enable gathering, processing and interpretation of multiple data sources for answering information needs. One of the involved projects focuses on next generation ground-based meteorological radars for highly detailed urban rainfall measurements [18]. In the RAINGAIN project various radar configurations and hydrodynamic softwares are implemented and tested for high resolution urban rainfall estimation and flood prediction to support urban pluvial control3.
1http://tahmo.info 2http://citi-sense.nilu.no/Project.aspx 3http://www.raingain.eu HoekDvanDHolland RotterdamDKNMI Alexanderlaan Thurledeweg Toscalaan Pascalweg Merlijnpad Dokhaven
Fig. 1. Location of Rotterdam disdrometers and the Rotterdam KNMI raingauge.
II. SENSINGEXTREMERAINFALL
The city of Rotterdam was hit by a heavy rain event during October 12 to 14 2013, with a total rainfall volume of approximately 130 mm. The annual precipitation average in this city is around 800 mm; a sixth of the yearly rains fell within just 3 days. Local flooding in various the city caused damage, social annoyance and interruption of traffic and economic activities at certain areas of the city.
Located in the Delta of the New Meuse river, Rotterdam is highly vulnerable to extreme weather conditions. Rainfall is expected to become heavier as a result of climate changes especially in the coastal region, where. The 600 thousand inhabitants city is the biggest port of Europe and accounts for a considerable fraction of the Dutch economy.
A set of the available information describing such extreme rainfall events is presented in this section. The accessibility and usefulness of this collection provides a picture of the challenges to be addressed by the distributed information infrastructure which we propose. Rotterdam is instrumented with a set of rain gauges, and is covered by the weather radars of the Dutch National Meteorological Institute (KNMI). Besides, the Municipality and the local Fire Brigade provide platforms for receiving citizen complaints that are used for responses during the occurrence of extreme rainfall events. Additionally, the urban topography has been modeled into a a highly detailed digital elevation model (DEM) that allows to deduct slope aspects and surface drainage directions. The related information is described and visualized for the example of the heavy rain event of 12-14 October, 2013.
A. Rain Gauge Measurements
Rotterdam is covered by various weather sensing platforms that record rainfall measurements. KNMI provides near real time (aprox. delay of 6 minutes) rainfall measurements from an automatic electrical rain gauge located at Rotterdam airport, at a temporal resolution of 10 minutes. This rain gauge is part of a national network that includes 32 automatic weather stations. The network collects rainfall data of reliable quality; studies have reported measurements with up to a 5% underestimation when compared to manual rain gauges [19]. Data are available under a licensed access through a ftp connection.
Additionally, the study area is covered by a network of 7 Thies laser disdrometers. These rain gauges yield 1 minute
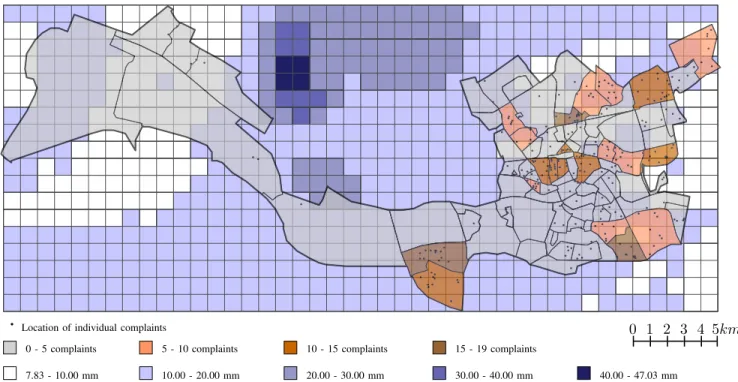
0 1 2 3 4 5km
Location of individual complaints
0 - 5 complaints 5 - 10 complaints 10 - 15 complaints 15 - 19 complaints
7.83 - 10.00 mm 10.00 - 20.00 mm 20.00 - 30.00 mm 30.00 - 40.00 mm 40.00 - 47.03 mm
Fig. 2. View of Rotterdam districts between October 12 to 14 2013. Black dots indicate the location of citizens reporting rain-related incidents. Highest rain intensity at each pixel is represented with different blue levels. Sums of complaints per district are illustrated with different red levels.
time-step measurements of rainfall volumes, with levels rang-ing from 0.005 to 250 mm/h. It uses a laser sensor to detect signal interferences due to particles falling through a laser beam. Measurements are automatically sent to a central database. A recent study compares disdrometer measurements with rain-gauges of the KNMI national network. Results showed that monthly accumulated rainfall of 4 of the laser disdrometers are highly correlated with the KNMI rain gauges, while two of the laser disdrometer presented correlations with the KNMI rain gauges as low as 0.5 and 0.2 [20], [21].
Currently, an additional network of 10 automatic weather stations located in Rotterdam is being updated. This network will be able to provide rainfall measurements with a temporal resolution of 5 minutes. The location of the stations is chosen so as to prevent effects of rain shadows and turbulences due to the layout of buildings and other urban characteristics.
Figure 1 presents the locations of the seven laser disdrom-eters around Rotterdam and the KNMI rain gauge at the Rotterdam airport.
B. Weather Radar
KNMI provides a weather radar product that is processed from two C-band Doppler radars [22]. This imagery product has a spatial resolution of 1Km2and a temporal resolution of
5 minutes. Figure 2 shows the grid which KNMI weather radar imagery pixels align to. Raw data is provided in near-real-time at a radiometric resolution of 8 bits. Digital values represent a logarithmic scale of radar decibels [23]. Under particular meteorological characteristics and at distant ranges the weather radar tends to underestimate precipitations [24]. Besides, radar measurements may not reflect the weather conditions at ground level [24], [25]. The advantage of radar-derived rainfall data
as compared to point measurements by rain gauges is their spatial coverage at areas poorly covered with weather stations [22]. The Rotterdam region will soon be covered by the range of an X-band weather radar which aims at better depicting the variations of rainfall at urban spatial scales.
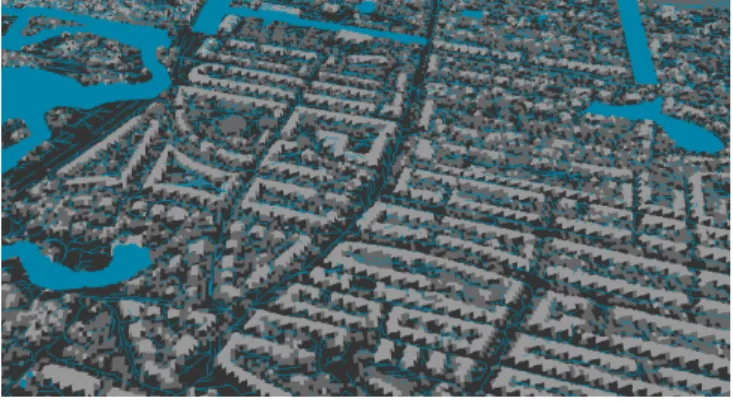
C. Digital elevation and urban watersheds models
A DEM is available for the city [26]. The DEM was produced using Light Detection and Ranging (LiDAR) of ground levels from an aerial platform. The DEM delivers a spatial resolution of 0.5 m×0.5 m, a vertical precision of 5 cm, a systematic error of 5 cm, a random error of 5 cm, and a minimum precision under two standard deviations of 15 cm [26], [27]. This DEM has been used for delineating overland flow paths. Such paths trace the directions that water tends to follow after rainfall due to urban slopes. Figure 3 shows an example of the representation of the elevations and flow paths in a street of Rotterdam. The paths follow the slope until they reach a urban water body (e.g. a canal or a lake).
D. Human sensing
The Municipality of Rotterdam maintains a platform for receiving and registering citizen calls about incidents in the city. Registering those calls consists of setting a unique iden-tifier number, transcribing the complaint information into short textual descriptions and performing a first-stage classification of the corresponding incident categories, stamping the time, and annotating the reporting address and the name of the caller. The complaints classified as ‘water- and sewer-related‘, were made available by the Municipality for academic and research purposes. Due to privacy issues, these registers are not
IEEE SENSORS JOURNAL 4
Fig. 3. 3D representation of DEM and overland flow paths in Rotterdam.
20 13 10 12 _1 8 20 13 10 12 _2 4 20 13 10 13 _6 20 13 10 13 _1 2 20 13 10 13 _1 8 20 13 10 13 _2 4 20 13 10 14 _6 20 13 10 14 _1 2 20 13 10 14 _1 8 20 13 10 14 _2 4 0 1 2 3 4 5 6 7 8 9 10 0 5 10 15 20 25 30 35 40 Depth (mm)
Count of municipality complaints Count of fire-brigade reports
Ra in d ep th ( m m ) Co un ts
Fig. 4. A comparison of hourly rainfall measurements with Municipality and Fire Brigade reports.
publicly available. The city’s Fire Brigade service maintains a similar platform. Calls from citizens reporting diverse types of incidents are registered using a unique identifier number, the address of the incident, an initial classification of the complaint, a brief description of the incident, and a status indicating whether the issue has been attended to and solved. The registry is available in a website that provides geographic visualizations of individual reports. This service does not provide machine-to-machine interfaces to access the registries [28].
During the heavy rain event of October 12 to 14 2013, more than 600 citizens telephonic complaints referring to rain-related incidents were registered in Rotterdam. Around 300 calls were received by the Municipality and another 300 by the regional Fire Brigade. Both data sets were made available for research. Figure 4 presents a time series of the hourly complaints recorded by the Municipality and the regional Fire Brigade, compared to the hourly rainfall volumes measured by the KNMI rain gauge at the Rotterdam Airport. The figure shows that, while most of the rain fell during October 12 and 13, most of complaints occurred during October 13 and 14. Total rain volume measured by the rain gauge at the airport during October the 13th was 41.85 mm; on the 12th it was 50% of that, 6% on the 14th. Municipal complaints, on the other hand, rise from 15 on the 12th, to 171 and 139 on the 13th and 14th respectively. The peak of complaints made to
the Fire Brigade occurred on the 13th, with 268 reports, up from 6 on the 12th, and down to 22 on the 14th.
III. INFORMATIONSYSTEMREQUIREMENTS
A. Challenges and opportunities for a Smart City facing extreme weather
Weaknesses in spatial coverage, accuracy and timely avail-ability of environmental and water-related measurements can be overcome if a multiple data sources are combined into integrated information products. Near-real time rainfall from different sensors could be cross-checked ’on-the-fly’; high rainfall intensities can be pin-pointed to areas reported in citizen’s emergency calls. Impacts due to heavy rain can be better managed if a distributed, real-time accessible infor-mation infrastructure is available for citizens and authori-ties. Citizens are familiar with complaining and emergency telephonic lines. Social networks, media in the Internet, and smartphone-gathered data can be also considered as sources to be analyzed. For this reason, building an information system on this basis might yield a valid tool for people to react during extreme rain events. Complaints may be missed when call centers get overloaded by calls, particularly during the peak of extreme events. If there are human errors in the interpretation of citizen reports, complaints registries can be wrongly related to rainfall when it cause might have been other. Besides, receiving citizens’ reports about rain-related incidents currently depends on the presence of officers picking up the phone at the call center. If there is nobody on shift, the calls are missed. An internet-based application, accessible via desktop and mobile devices, could manage the register of citizen reports even under multiple requests for service during a heavy rainfall peak, or at night.
B. Requirements of a smart sensing infrastructure
While the city of Rotterdam is covered by an extensive infrastructure of weather and water-related sensors, it currently lacks an integrated system for managing information generated by these same sensors: the intelligent information infrastruc-ture that is at the basis of any smart city. The smart city paradigm revolves around integration of existing, conventional infrastructures into a unique intelligent infrastructure that collects data generated throughout the city and provides a unified platform for accessing it [29], [30]. Information and communication technologies and digital networks now widely available in modern urban contexts make this integration possible. The outcome is better management of information, providing each involved stakeholder with local, reliable data access [31], [32]. Such an information system, however, comes with unique challenges.
The amount of information managed, its location-aware nature and the multiple sources spread throughout the city require an innovative use of existing information technologies. In the following we propose the design of such a system. The proposed infrastructure focuses on weather sensing and water-related information, and addresses requirements imposed by the urban context on information system design:
• efficient: during a heavy rain event, the information infrastructure will be queried repeatedly by stakeholders and should at the same time collect citizen- and sensor-driven data. So, each task has to be processed efficiently in real-time [32].
• write-intensive: the urban context generates a large amount of data derived both from sensors and citizens. These data have to be continuously stored in the infor-mation system [33].
• non-transactional: data base consistency is not the most important property when dealing with weather informa-tion. Queries can be performed in a loosely-transactional isolation level in order to enhance the performance [34].
• available: it is important that the system stays up and running even if overloaded or in case of a failure of one of its components, a likely occurrence especially during extreme weather events [32].
• scalable: the urban context is complex and changes con-tinuously, new sensors could be added and new features could be implemented in the system. It is thus important that the system can scale well [32].
• fault-tolerant: the system has to cope with components failure as explained above. No Single Point of Failure
(SPoF) should be present and the stored data must not be lost in case one of the data base servers should fail [33]. Such a system helps both citizens and institutions to better cope with pluvial-related events, and provides a quick interface for reporting the problems the city is facing. Aggregating data from different sources means that each complaint or event can be visualized on a map on the fly, allowing citizens to help each other, to know locations of pluvial floods and allowing Fire Brigade and Municipality to hold a high level view of the overall situation. For instance, Figure 4 shows that for the 12 to 14 October event, complaints were mostly grouped a few hours after the rain fell. A constant overview of the rainfall trends could help Municipality and Fire Brigade to schedule a staff-up in order to cope with upcoming calls. In order to implement a realliving lab[35], [36] to further collect data, citizens could be involved by means of social network feeds. For instance, the Municipality could define and promote a commonhashtag(on its Twitter profile) for rain events, and the system should collect and process each tweet containing that hashtag in order to provide stakeholders with location-based, punctual, citizen-sensed information.
In order to collect and visualize citizen-based information, application servers of the back-end infrastructure have to crawl specific social network feeds. Call centers have to provide a simple web service to expose complaints content with a machine-to-machine interface. Retrieving and interpreting the right information from social media is a non-trivial task. Not everybody will use the relevant hashtag, and information contained in each feed should be also interpreted automatically in order to combine it with that from sensors. These problems are beyond the scope of this work; here we focus on the overall system infrastructure and on integration of already deployed sensors. In order to integrate rain gauges and allow local management of information before data are collected by
the information system, we need to enhance computation and communication capability of each sensor. In the next section we propose installing autonomous units at each rain gauge: this allows to collect locally data generated by each rain gauge, and format it according to the standard imposed by the information system interface before sending it over to the system back end (described in Section IV-B). Having computation units at the sensors realizes the sensor network paradigm, in which sensors are able to communicate and interact with each other.
IV. INFORMATIONSYSTEMARCHITECHTURE
A. Achieving local computation with Raspberry Pi
In order to connect the rain gauges directly to the informa-tion system, we propose installing on the spot cost, low-power computational units such as single-board computers. Installing one directly where each rain gauge is allows us not only to achieve a better information management of the local data generated by the sensor, but also to build a network of independent units able to react to malfunctions on a single node. Moreover, such computational units are not restricted to the rain gauges, but can be installed on any other sensor that will be integrated into the system in the future. A computational unit is in fact independent of the kind of sensor it is attached to, and provides therefore a standard platform and a uniformed access to information through a heterogeneous network of sensors, which may therefore be integrated seamlessly into the system. The computational unit may also act as an aggregator of sensors: once such a unit is attached to a rain gauge, for instance, other sensors and devices can be installed in place easily, without requiring further integration, which would be needed instead if each sensor had to rely on its own proprietary communication system.
We propose to implement this system using the popular Raspberry Pi board. A Raspberry Pi is credit-card-sized single-board computer designed to be particularly power-efficient and low-cost. A typical board consumes only1.67W under stress (for instance, when recording videos) and less than 1.07W when idle.4 It mounts a Broadcom BCM2835 system-on-chip
(SoC), composed of an ARM1176JZF-S 700 MHz processor, a VideoCore IV GPU, and 512 MB of RAM. The Raspberry Pi provides connectivity through an Ethernet port, but for the pur-poses of this work, we propose to use the urban Wi-fi network, which covers broad areas of the city and provides reliable, city-managed Internet access to the city ICT infrastructure. Additionally, Raspberry Pi includes eight general purpose I/O (GPIO) pins at 3:3 V, from 2 mA to 16 mA, which can be controlled with tailor made software. These on-board GPIOs allow for lower-level interfacing to electronics such as the ones in weather sensors. Taking advantage of the flexibility of the chosen platform, we can complete the setup by installing a remotely-activated camera sensor into the Raspberry Pi. This provides control centers with a remote view of the rain gauges and, since they are located in strategic points of interest, complements the city surveillance camera infrastructure. In order to face unexpected power outages (frequently occurring
IEEE SENSORS JOURNAL 6 Data Node 1 (S1 - S2 - S3) Data Node 2 (S2 - S1 - S3) Data Node 3 (S3 - S1 - S2) Application Node 1 Application Node 2 Application Node 3 Load Balancer
Fig. 5. Information system architecture.
during extreme weather events) we also consider installing a back-up power unit that guarantees continued operation even during a blackout5. In Table IV-A we summarized the costs of a single unit, including optional components.
Micro Station
Component Optional Market Price ($)
Board No 35.00
Battery No 49.50
Wifi dongle No/Yes 25-35.00
Camera Yes 24.99
Total cost 85-155.00
TABLE I
BASIC AND OPTIONAL COMPONENTS FOR EACH MICRO STATION.
Each single board can transmit data gathered by a local rain gauge (or, in the future, sensors of other nature) to the information system back-end (which we describe in the following), but may also communicate directly to other boards. A scenario in which the boards pre-compute aggregated data locally based on their respective positions realizes a location-aware sensor network. While the rain gauges available in Rotterdam are generally high-precision, we propose as future work the deployment of a higher number of lower-precision, inexpensive sensing stations, also based on Raspberry Pi, such as the ones used by the Trans-African Hydro-Meteorological Observatory (Section I-A). The ICT infrastructure we propose in this paper allows seamless integration of new units, enabling future realization of an heterogeneous and distributed Environ-mental Sensor Network (ESN) [37]. In any future deployment of new sensing nodes, an efficient geographic distribution may reduce significantly the number of units needed to achieve the same aggregated precision by means of local unit-to-unit communication [38]. We finally note here that installing 5It is useful to note here that rain gauges are power-sufficient. It would be important however, even if it goes beyond the purposes of this work, to evaluate network accessibility during a power outage, as the network infrastructure may be power-dependent.
full-fledged computational units may introduce the risk of external attacks. We believe, however, that the added benefits of the platform largely overcome this risk, which may reduced through an adequate firewall and security policy aimed at restricting access only to authorized addresses (for instance, using white-lists of IP’s).
B. Information System Back-end
As discussed above, an information system suitable for smart cities scenarios should rely on a distributed, highly-available and reliable infrastructure. We propose an architec-ture for such a system that is suitable for weather information sensing in a large urban area. The scenario we are approaching hold the following features: it should be up and running 24h/7 as sensors and other data sources provide the back end with data continuously. For the same reason, it can be referred to as awrite-intensiveapplication. When a heavy rain event occurs, sensor inputs are joined by an intensive rate of human sensing, like the ones described in Section II-D. Moreover, during such an event, both citizens and institutions tend to use intensely each service provided by the infrastructure. All of these factors contribute to produce a peak in the workload of the whole infrastructure. Moreover, as this infrastructure is intended to be up and running especially during heavy rain events, each exposed component should cope with rain-driven failures. In order to obtain a fault-tolerant system we plan not to have any SPoF within our architecture. We reach this goal by providing
loosely couplingbetween nodes of the system. Each request to the back-end is handled by several pools of interchangeable nodes. As shown in Figure 5, each request goes through a load balancer and is then passed to an application server, i.e. a node that performs computational tasks like pre-processing of received data. The request ends its route at a data node, a data base server machine where the data are stored. The storage policy that enables data nodes interchangeability and requests concurrency is discussed later on.
The basic idea is that, whether a node would fail, the re-quests addressed to it can be served by another node belonging to the same pool, without any system failure. The availability goal is thus accomplished. In order to cope with peaks of requests, we design the system with load balancing in mind. As all the back-end components can be deployed within the city itself, we do not have to deal with latency problems. Basically, for the load balancer, it is not important to address each request to the nearest application server. What is important is that the number of requests each application server handles is balanced among each pool’s nodes. This configuration can be reached via aDNS Round Robinload balancing approach. This technique consists in configuring the Domain Name System
(DNS) so that requests are addressed not to a single IP address, but to one IP address among a list of addresses that point to servers hosting identical services. The list is permuted for subsequent lookups. Thus, the load balancer shown in Figure 5 should not be intended as a possible SPoF for the system, as it relies on DNS, that is natively distributed and fault-tolerant. In a distributed write-intensive scenario, a common design pattern for data storage is Sharding (from shared-nothing). This technique consists in dividing the data into several independent blocks, and assign each block to a separate data base server. That way, requests from application servers can be addressed in parallel to each pertinent data node. This model needs a backup policy to prevent loss of data when a node crashes. Our application is not transaction-intensive: data base consistency, crucial in traditional infor-mation systems like banking ones, is not a priority when dealing with non critical raw information, as often happens in Big Data scenarios. In those contexts, traditional ACID-oriented DBMS (Atomicity, Consistency, Isolation, Durability) are replaced with BASE-oriented DBMS (Basically Available, Soft-state/Scalable, Eventually Consistent). Thus, when deal-ing with weather information, queries can be performed in a loosely-transactional isolation level (giving priority to avail-ability and scalavail-ability) in order to enhance the performance. Given this, we can opt in our design for a hybrid sharding solution, sometimes referred to asactive backup nodes. Instead of storing a sole block of data into each data node, we store the whole dataset, still divided in blocks. For each block, only one node will act as master, and the others act as slaves. So, when all data nodes are up and running, they act as in a classic sharding environment. When a failure occurs, one of the remaining data nodes becomes master for the block managed by the lost node. Thus, the data node pool is able to continue operating as long as at least one node is alive. With such a solution, we achieve both performance boosting (efficiency), fault-tolerance and data recovery. Note that in order to achieve good performance in a write-intensive scenario, data propagation between each data node is intended to be asynchronous. This is why hybrid sharding solution would not perform well in a transaction-intensive environment, where dataset’s consistency holds a higher priority.
By design, we can scale up such a system as needed adding application and data nodes as required, thus achieving the scalability requirement. Two scenario are feasible for the application servers. They could be deployed as pay-per-use
servers in the same cloud Infrastructure as a Service (IaaS) platform used for data nodes or they can be hosted directly within each stakeholder headquarter building. In that case, each building should be equipped with a dedicated connection to the IaaS provider hosting the data nodes.
V. SYSTEMDISCUSSION ANDEVALUATION The proposed Information System design provides a feasible and reliable way to integrate available, heterogeneous data sources, and therefore allows smarter detection and man-agement of urban flooding. The design relies on existing technologies, and focuses on an affordable and flexible in-tegration of both sensors and crowd-sensed real-time data. Though some of these data have real-time availability, they are dispersed. This limits their use for integrated analytics such as metrics and visualizations describing the likelihood, timing, and location of urban flooding impact clusters. The presented architecture offers the opportunity to both integrate available information sources and provide reliable access in real time. Thus, integrated and automatic analytics and visualizations become available to support urban flooding management. An interesting analytic to consider is the trend in complaint reports for a street in a critical urban subwatershed (see Section II-C) at a certain rain intensity. This metric can be used to fire an alarm when a threshold is passed. This kind of threshold can be derived from the historic impacts associated with topographic characteristics, rainfall and complaints levels. The alarm can be used to directly deploy additional staff for coping with problems at a definite position and time, avoiding further inconveniences, and intelligently allocating emergency response resources.
Additional crowd-sensed information can be easily inte-grated into the system. Twitter posts can be crawled on the fly on the basis of the location and textual content of reports from the most complaining streets or highest intensity rainfall districts during an extreme event. This approach overcomes the limited spatial resolution that Twitter posts have, enabling their use for smart emergency response. In this way, this type of social network data, which benefits from reports made by citizens moving through the city, can be connected to the smart sensing platform. Instantly and publicly available visualization of complaints and tweets relating to urban flood-ing impacts can enhance a more lively interaction of citizens on the emergency response to heavy rain. To take further advantage of Twitter during heavy rain events, the architecture can automatically post tweets from a dedicated account, or from the account of the head-officer responsible for urban drainage at the municipality or the waterboard. Those posts can not only include links to analytics and visualizations to allow citizens to collaborate on reducing urban flooding impacts, but also a hashtag to invite citizens to tweet additional information such as pictures, qualitative descriptions, and locations of rainfall-related problems. As well as for Twitter, the proposed architecture is able to retrieve information from a smartphone application to complement the already established call centers for citizens’ complaints of the municipality and the fire brigade, standardizing and enhancing the spatio-temporal resolution of descriptions of urban flooding impacts.
IEEE SENSORS JOURNAL 8 0 .1 0 .1 0 .1 0.20.2 0.30.3 0.4 0.5 0.6 .70 0.8 0.9 1.1 .41 1.7 2.1 2.8 4.2 7 5 .0
Rainfall int ensit ies (m m /h) 5 10 15 20 25 30 35 40 45 50 55 60 65 70 75 80 85 90 95 100 P e rc e n ti le s
Fig. 6. Percentiles of rainfall intensities in Rotterdam. A series of rain gauge measurements, made in Rotterdam between April 2003 and March 2011, is used to calculate the percentiles. The series has a 10 minutes temporal resolution. From the total of 420481 timesteps during the eight years analyzed, 34156 recorded rainfall intensities different than 0mm/h. That is, close to 8% of total timesteps registered rainfall. Within such wet timesteps, 50% registered intensities equal or higher than 0.6 mm/h, and 25% equal or higher than 1.4 mm/h. This means that in terms of the total dry and wet 10 min timesteps,8%×0.50registered precipitations equal or higher than 0.6 mm/h (50th percentile), and8%×0.25did it equally or above than 1.4mm/h (75th percentile).
Power management in installed sensors, and sensing reli-ability on sensors failure, can be smartly improved by the proposed system. The computational capability of Raspberry Pi opens the way to a number of enhancing strategies for the system’s reliability. We already mentioned that Pi enables several sensors to be plugged into a single computational unit. Let us consider a network of Raspberry Pis, each one equipped with a rain gauge, a humidity sensor and a smart camera. If a failure on the rain gauges should occur, the Raspberry Pi could start processing the smart camera signal with a pattern recognition routine able to detect rain conditions with respect to a predefined background image. That way, the server would continue to receive rain information transparently, despite of the rain gauge failure. The humidity sensor could be queried in turn after a camera failure. Moreover, as these computational units are able to communicate and interact intelligently with each other, and not only to the back end as a regular sensor would, they can be programmed to react to the failure of a whole unit. For instance, after one or more Raspberry Pi installed in a single area failed, the system could be informed by the others of the failures and can carry out several actions: a more frequent sampling could be required from the radar for that area, and Municipality and Fire Brigades headquar-ters could be alerted to serve the calls from that area first. This example clearly illustrates how combining location-aware sensors data and human sensing together can enhance rescue strategies during extreme rainfall and other related events.
In the following we evaluate some of the benefits of the pro-posed system in terms of reduced power consumption, faster availability of information and increased spatial resolution. We can reduce the power consumption by keeping most rain gauges off when we do not sense rain above a threshold sensed by a small set of active rain gauges and the rainfall radar. Using the historic rainfall intensity occurrence percentiles 0th,
Power saving evaluation
System Sensors considering Time on, % Yearly power 20% communication (rain percentile) consumption Old Rain gauges (0.83 W) 100% 727.08 kWh New Rain gauges (0.83 W) 8% 133.16 kWh
Raspberry Pi (1.07 W) (0th)
New Rain gauges (0.83 W) 4% 66.58 kWh Raspberry Pi (1.07 W) (50th)
New Rain gauges (0.83 W) 2% 33.29 kWh Raspberry Pi (1.07 W) (75th)
TABLE II
POWER CONSUMPTION EVALUATION ACCORDING TO RAINFALL INTENSITY PERCENTILES FROMFIGURE6.
50th and 75th (see Figure 6), each RaspberryPi-based sensing station can achieve the power savings listed in Table II. A Raspberry Pi also allows to compare different sensors’ signals locally and send the derived information to the back end once, reducing client-server data flow. In fact, a considerable power at rain-gauges is used by network communication: the typical current drain at 12 Vdc goes from 1 to 16 mA when not communicating to 17 to 28 mA during communication, to which we have to add the modem power consumption (3 Watt). The results presented in Table II assume that communication takes place for around 20% of the time, a rather conservative estimate. In total, we achieve a 81.69% saving using the 0th percentile,90.84%using the 50th percentile, and95.42%
with the 75th percentile. This is not only important in cost reduction, but especially in prolonging the lifetime of batteries during power outages, which typically occur when the data are most needed; that is, during extreme weather.
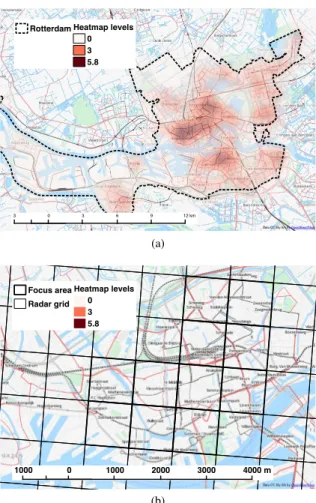
The proposed system has the ability to improve the current spatial resolution as well. Current rainfall measurements have a maximum spatial resolution of 1 sq km, and only raw imagery is available near-realtime. A corrected radar-rainfall takes a day (see Section II-B). Regarding rain gauges, the spatial resolution is limited to the number of stations currently installed, and the confidence of the interpolations derived from their measurements. A spatial resolution enhancement can be achieved by smartly placing affordable rain gauges at critical locations in the city. Those critical sites can be identified by analyzing the areas that presented more com-plaints related to rainfall issues. Figure 7 presents a heatmap of complaints in Rotterdam, and shows that complaint incidence is particularly high in central and southern Rotterdam. Rainfall measurements with higher spatio-temporal resolution can be performed in such vulnerable areas by focusing the installation of additional weather sensors there. The architecture presented in this work enables an easy, plug and play installation of affordable sensors to support higher spatial resolution. While inexpensive sensors operate with lower precision, they are worth the tradeoff when the goal is enhancing spatial and temporal resolutions at vulnerable areas.
In a theoretical squared radar grid, made of 9 cells of 1 sq Km each, the installation of 25 rain gauges, separated 750 m from each other, would provide a spatial resolution of 0.56 sq
(a)
(b)
Fig. 7. Heatmap of 21577 rainfall-related complaints between 2004 and 2001in Rotterdam. Top Figure 7a and bottom Figure 7b are general and close-up views of the heatmap, which has a resolution of 1Ha and was built with 1Km ranges. It represents an estimation of the historic amount of complaints within 1 km range at every Ha of the modeled surface, and allows us to easily visualize the areas with higher complaints incidence. In fact, the incidence of complaints is not evenly distributed in the 277 sq km of Rotterdam surface (7a). Central and Southern Rotterdam present higher amounts of complaints. In 7b the vulnerable area of central Rotterdam is mostly covered by 11 radar cells.
KM. This means an enhancement of 78% in the spatial detail of rainfall measurements. For the focus area in Figure 7b, 30 to 31 raingauges would be required to achieve such performance. Additionally, such detailed spatial data would be available real-time, in comparison with the day-after availability for corrected radar rainfall data from the KNMI radars.
VI. CONCLUSION
Heavy rainfall in urban contexts can cause severe damages and disruptions, and cities are increasingly striving to adopt preventive measures. In many cities, several dedicated weather stations and sensors are being deployed to monitor weather conditions and predict potential critical situations. However, access to these sensors is often difficult and restricted to specialized personnel only. The potential of combining data from different sources to obtain more accurate and detailed information remains largely untapped. In this paper, we focus on bringing this useful information out in the open, and allowing both citizens and relevant city actors to benefit from them in their decision-making process. In order to do this,
we propose an ICT infrastructure integrating data gathered by sensors with citizens’ feedback (complaints, as well as social network feeds). Such an infrastructure provides institutions with a high level view of the overall situation in the city during heavy rain events.
In this work we focus on the city of Rotterdam (Nether-lands), and we present the sensing infrastructure deployed there. In order to have a real use case for the proposed ICT infrastructure, we discuss a heavy rain event which took place in the city in October 2013, and we describe data gathered from both rain gauges and weather radars, as well as complaints of the citizens.
An intelligent urban infrastructure is at the core of every smart city. We present a real-time, distributed, and reliable in-formation infrastructure that incorporates varying data sources to support citizens and city authorities response under extreme weather conditions. Smarter interfaces to both the city govern-ing bodies and the population mean greater involvement of the citizens, and contribute to achieving a more livable, resilient and friendlier city.
ACKNOWLEDGMENT
This work is supported by the SHINE project of TU Delft6,
funded by the Delft Institute for Research on ICT; and by Climate-KIC7.
REFERENCES
[1] L. Calderoni, D. Maio, and P. Palmieri, “Location-aware mobile services for a smart city: Design, implementation and deployment,” JTAER, vol. 7, no. 3, pp. 74–87, 2012.
[2] M. R. Naphade, G. Banavar, C. Harrison, J. Paraszczak, and R. Mor-ris, “Smarter cities and their innovation challenges,” IEEE Computer, vol. 44, no. 6, pp. 32–39, 2011.
[3] H. Schaffers, N. Komninos, and M. Pallot, “Smart Cities as Innovation Ecosystems Sustained by the Future Internet,” FIREBALL White Paper, April 2012.
[4] International Telecommunication Union, “The Internet of Things,” ITU Internet Report, 2005.
[5] J. M. Hern´andez-Mu˜noz, J. B. Vercher, L. Mu˜noz, J. A. Galache, M. Presser, L. A. H. G´omez, and J. Pettersson, “Smart Cities at the Forefront of the Future Internet,” in Future Internet Assembly, 2011, pp. 447–462.
[6] R. Ashley, D. Balmfort, A. Saul, and J. Blanskby, “Flooding in the future - predicting climate change, risks and responses in urban areas,”Water Science and Technology, vol. 52, no. 5, pp. 265–273, 2005.
[7] K. Stone, R. Duinen, W. van Veerbeek, and S. Dopp, “Sensitivity and vulnerability of urban systems - assessment of climate change impact to urban systems,” Deltares, Netherlands, Tech. Rep. 1202270-008-BGS-0004, 2011.
[8] J. ten Veldhuis, “How the choice of flood damage metrics influences urban flood risk assessment,”Journal of Flood Risk Management, vol. 4, no. 4, pp. 281–287, 2011. [Online]. Available: http://onlinelibrary.wiley. com/doi/10.1111/j.1753-318X.2011.01112.x/abstract
[9] R. Wilby, “A review of climate change impacts on the built environ-ment,”Built Environment, vol. 33, no. 1, pp. 31–45, 2007.
[10] K. Berggren, M. Olofsson, M. Viklander, G. Svensson, and A.-M. Gustafsson, “Hydraulic impacts on urban drainage systems due to changes in rainfall caused by climatic change,” Journal of Hydrologic Engineering, vol. 17, no. 1, pp. 92–98, Jan. 2012. [Online]. Available: http://ascelibrary.org/doi/abs/10.1061/%28ASCE% 29HE.1943-5584.0000406
6http://www.tudelft.nl/ 7http://www.climate-kic.org/
IEEE SENSORS JOURNAL 10
[11] B. van den Hurk, A. Klein Tank, G. Lenderink, A. van Ulden, G. J. Van Oldenborgh, C. Katsman, H. Van den Brink, F. Keller, J. Bessem-binder, G. Burgerset al.,KNMI climate change scenarios 2006 for the Netherlands. KNMI De Bilt, 2006.
[12] L. Calderoni, D. Maio, and S. Rovis, “Deploying a network of smart cameras for traffic monitoring on a ”city kernel”,”Expert Syst. Appl., vol. 41, no. 2, pp. 502–507, 2014.
[13] N. Mitton, S. Papavassiliou, A. Puliafito, and K. S. Trivedi, “Combining cloud and sensors in a smart city environment,”EURASIP J. Wireless Comm. and Networking, vol. 2012, p. 247, 2012.
[14] M. Martino, F. Calabrese, G. D. Lorenzo, C. Andris, L. Liang, and C. Ratti, “Ocean of information: fusing aggregate & individual dynamics for metropolitan analysis,” inIUI, C. Rich, Q. Yang, M. Cavazza, and M. X. Zhou, Eds. ACM, 2010, pp. 357–360.
[15] A. S. Cacciapuoti, F. Calabrese, M. Caleffi, G. D. Lorenzo, and L. Paura, “Human-mobility enabled wireless networks for emergency communi-cations during special events,”Pervasive and Mobile Computing, vol. 9, no. 4, pp. 472–483, 2013.
[16] G. Sagl, T. Blaschke, E. Beinat, and B. Resch, “Ubiquitous geo-sensing for context-aware analysis: Exploring relationships between environmental and human dynamics,”Sensors (Switzerland), vol. 12, no. 7, pp. 9800–9822, 2012.
[17] A. Overeem, H. Leijnse, and R. Uijlenhoet, “Country-wide rainfall maps from cellular communication networks,” Proceedings of the National Academy of Sciences, p. 201217961, Feb. 2013, PMID: 23382210. [Online]. Available: http://www.pnas.org/content/early/2013/ 01/29/1217961110
[18] M. ten Veldhuis and B. van Riemsdijk, “High resolution weather data for urban hydrological modelling and impact assessment, ict requirements and future challenges,” Geophysical Research Abstracts, 2013. [19] A. T. H. Bruin and Koninklijk Nederlands Meteorologisch Instituut,
Veranderingen in neerslagkarakteristieken in Nederland gedurende de periode 1901-2001. De Bilt: Koninklijk Nederlands Meteorologisch Instituut, 2002.
[20] N. Janssen, “Assessing the quality of disdrometer data for measuring rainfall in the rotterdam region and modelling the spatial correlation for short-term rainfall accumulation intervals,” Wagening University and Reseacch Centre, Netherlands, Tech. Rep., 2013.
[21] M. Otes¸teanu, A. Gontean, G. Sˆarbu-Doagˇa, and R. Sandra, “Software environment for the laser precipitation monitor,”WSEAS Transactions on Information Science and Applications, vol. 4, no. 1, pp. 214–219, 2007.
[22] J. M. Schuurmans, M. F. P. Bierkens, E. J. Pebesma, and R. Uijlenhoet, “Automatic prediction of high-resolution daily rainfall fields for multiple extents: The potential of operational radar,” Journal of Hydrometeorology, vol. 8, no. 6, pp. 1204–1224, Dec. 2007. [Online]. Available: http://journals.ametsoc.org/doi/abs/10.1175/2007JHM792.1 [23] “KNMI product catalogus,” 2013. [Online]. Available: http://www.knmi.
nl/datacentrum/catalogus/catalogus/catalogus-gegevens-overzicht.html [24] A. Overeem, A. Buishand, I. Holleman, and R. Uiljenhoet, “Statistiek
van extreme gebiedsneerslag in neder-land,” KNMI, Tech. Rep. TR332, 2012. [Online]. Available: http://www.knmi.nl/publications/fulltexts/ pag 2931 h2o nr 12 2012.pdf
[25] R. Reinoso-Rondinel, G. Bruni, and J. A. E. ten Veldhuis, “Toward the optimal resolution of rainfall estimates to obtain reliable urban hydrological response: X-band polarimetric radar estimates applied to rotterdam urban drainage system,” in11th International Precipitation Conference 2013. Ede-Wageningen: KNMI and WUR, 2013. [26] C. v. d. Sande, S. Soudarissanane, and K. Khoshelham, “Assessment of
relative accuracy of AHN-2 laser scanning data using planar features,” Sensors, vol. 10, no. 9, pp. 8198–8214, Sep. 2010. [Online]. Available: http://www.mdpi.com/1424-8220/10/9/8198/
[27] N. van der Zon, “Kwaliteitsdocument AHN-2,” Rijkswaterstaat & Waterschappen, Tech. Rep. 1.1, 2011. [Online]. Available: http://www.ahn.nl
[28] 112Meldingen.nl, “112MELDINGEN.NL | 112 meldingen & p2000 alarmeringen van de hulpdiensten online volgen.” 2014. [Online]. Available: http://112meldingen.nl/index.php
[29] S.-H. Lee, T. Yigitcanlar, J.-H. Han, and Y.-T. Leem, “Ubiquitous urban infrastructure: Infrastructure planning and development in korea,” Innovation: Management, Policy & Practice, vol. 10, pp. 282–292, 2008. [30] J.-W. Park, C. H. Yun, S. W. Rho, Y. Lee, and H.-S. Jung, “Mobile Cloud
Web-Service for U-City,” inDASC. IEEE, 2011, pp. 1061–1065. [31] F. Munz,Middleware and Cloud Computing: Oracle Fusion Middleware
on Amazon Web Services and Rackspace Cloud. Munz & More Publishing, 2011. [Online]. Available: http://books.google.it/books?id= xStaYgEACAAJ
[32] J. Rhoton and R. Haukioja,Cloud Computing Architected. Recursive, Limited, 2011. [Online]. Available: http://books.google.it/books?id= 1bmauAAACAAJ
[33] D. J. Abadi, “Data management in the cloud: Limitations and opportu-nities.”IEEE Data Eng. Bull., vol. 32, no. 1, pp. 3–12, 2009. [34] J. Raventos, “System and method for enabling transaction-based service
utilizing non-transactional resources,” 2001.
[35] European Commission, “Advancing and Applying Living Lab Methodologies,” Technical report, 2010. [Online]. Avail-able: http://ec.europa.eu/information society/activities/livinglabs/docs/ pdf/newwebpdf/living-lab-brochure2010 en.pdf
[36] H. Schaffers, N. Komninos, M. Pallot, B. Trousse, M. Nilsson, and A. Oliveira, “Smart Cities and the Future Internet: Towards Cooperation Frameworks for Open Innovation,” inFuture Internet Assembly, 2011, pp. 431–446.
[37] J. K. Hart and K. Martinez, “Environmental sensor networks: A revolution in the earth system science?” Earth-Science Reviews, vol. 78, pp. 177–191, 2006. [Online]. Available: http://eprints.soton.ac. uk/263093/
[38] A. Krause, R. Rajagopal, A. Gupta, and C. Guestrin, “Simultaneous optimization of sensor placements and balanced schedules,”IEEE Trans. Automat. Contr., vol. 56, no. 10, pp. 2390–2405, 2011.
Santiago Gaitan received a Biologist Diploma in 2006 from the National University of Colombia. In 2007 he was awarded Specialist on Remote Sensing and Geographic Information Systems by the National Institute of Space Research of Brazil. Between 2009 and 2011 he performed a research internship in the Faculty of Water Science and Engineering at National University of the Littoral (Argentina). He is currently pursuing a Ph.D. in the Department of Water Management in the Faculty of Civil Engineering and Geosciences at Delft University of Technology. His research interests focus in spatial data analysis, stochastic environmental modelling, and adaptation to climate extremes.
Luca Calderonireceived the Master’s degree in computer science from the Universit`a di Bologna, Italy, in March 2009, and is currently pursuing a Ph.D. degree in the same university. He works in the Smart City Lab located in the Cesena campus. His research is in smart cities, and especially in location-aware applications, urban ICT infrastructures, location privacy and security in electronic identity documents.
Paolo Palmierireceived his Master’s degree in computer science from the Universit`a di Bologna, Italy, in December 2007, and the Ph.D. degree in cryptography from the Universit´e catholique de Louvain, Belgium, in January 2013. After a period as visiting researcher in his alma mater Bologna in early 2013, he is currently a post-doctoral researcher at Delft University of Technology, The Netherlands, where he works in the Parallel and Distributed Systems group. His research interests space from privacy and security topics to smart cities, and include secure computation, location privacy and location-aware applications.
Marie-claire ten Veldhuis is Assistant Professor in Urban Water Systems in the Faculty of Civil Engineering and Geosciences at Delft University of Technology. She is the coordinator of RainGain, an EU-funded project on high resolution rainfall data analysis from dual polarimetric X-band radars and urban flood prediction. She holds the Secretariat of Delft Urban Water, a inter institutional initiative to streamline advanced Dutch research in urban water. Her research interests comprise high resolution rainfall patterns in cities, urban hydrology, urban flooding, flood impacts and quantitative urban flood risk analysis, and smart sensoring in cities.
Dario Maio is Full Professor of Information Systems in the Department of Computer Science and Engineering (DISI) at the University of Bologna, Italy. He received a Master’s degree in Electronic Engineering from the University of Bologna in 1975. He is a member of ACM, IEEE and IAPR. He was Chair of the Cesena Campus from 2001 to 2007; he is Director of the Biometric Systems Laboratory and coordinator of the Smart City Lab. He has devoted his research work to various aspects of Computer Science, including distributed computer systems, computer performance evaluation, database design, information systems, neural networks, autonomous agents, pattern recognition and biometric systems.
M. Birna van Riemsdijk is an Assistant Professor in the Interactive Intelligence section at Delft University of Technology. She obtained her PhD from Utrecht University in 2006. She has carried out research in the design of programming languages and modeling techniques for autonomous agents and multi-agent systems, and in service-oriented systems. She is a member of the board of directors of the International Foundation of Autonomous Agents and Multi-Agent Systems and of the steering committee of the International Workshop on Engineering Multi-Agent Systems.