University of Ljubljana
Faculty of Computer and Information Science
Miran Levar
Web-based platform for
dataflow processing
MASTER’S THESIS
SECOND-CYCLE STUDY PROGRAMME COMPUTER AND INFORMATION SCIENCE
Supervisor
: prof. dr. Blaˇ
z Zupan
Co-supervisor
: Denis Helic, Assoc.Prof. Dipl.-Ing. Dr.techn.
Univerza v Ljubljani
Fakulteta za raˇ
cunalniˇ
stvo in informatiko
Miran Levar
Spletno okolje za
podatkovno vodeno procesiranje
MAGISTRSKO DELOˇ
STUDIJSKI PROGRAM DRUGE STOPNJE
RA ˇCUNALNIˇSTVO IN INFORMATIKA
Mentor
: prof. dr. Blaˇ
z Zupan
Somentor
: Denis Helic, Assoc.Prof. Dipl.-Ing. Dr.techn.
Copyright. The results of this Master’s Thesis are the intellectual property of the
author and the Faculty of Computer and Information Science, University of Ljubljana. Publication or usage of the thesis results requires written consent of the author, the Faculty of Computer and Information Science, and the supervisors.
c
Declaration of Master’s Thesis authorship
I, the undersigned Miran Levar, am the author of this Master’s Thesis enti-tled:
Web-based platform for dataflow processing
With my signature, I declare that:
• the submitted Thesis is my own unaided work under the supervi-sion of prof. dr. Blaˇz Zupan and co-supervision of Denis Helic, As-soc.Prof. Dipl.-Ing. Dr.techn.,
• all electronic forms of this Master’s Thesis, the title (Slovenian, glish), abstract (Slovenian, English), and the keywords (Slovenian, En-glish) are identical to the printed form of the Master’s Thesis,
• I agree with the publication of the electronic form of this Master’s Thesis in the collection “Dela FRI”.
Acknowledgements
Thanks to Prof. Zupan for his support and guidance through the years as well as the opportunities he has helped create for me. Thanks to Prof. Helic for overseeing my year in Graz and collaborating with me on this work. Thanks to the Genialis team for inviting me to participate in an incredible project. Finally, thanks to everyone else, friends and family, who supported me during my studies.
Kazalo
List of abbreviations Abstract
Povzetek
Razˇsirjeni povzetek
1 Introduction 1 2 Theoretical background 5 2.1 Architecture . . . 5 2.2 Dataflow programming . . . 19 3 Related work 27 3.1 PIPA . . . 27 3.2 dictyExpress . . . 28 3.3 Orange . . . 29 3.4 KNIME . . . 31 3.5 noflo.js . . . 32 3.6 Galaxy . . . 33 3.7 DNANexus . . . 34 4 Implementation 37 4.1 Development goals . . . 37
4.2 Platform architecture . . . 39 4.3 Selected implementation details . . . 52
5 Conclusion 67
5.1 Looking back . . . 68 5.2 Looking forward . . . 70
List of abbreviations
ACID Atomicity, Consistency, Isolation, Durability
API Application Programming Interface
BSON Binary JSON
CSS Cascading Style Sheets
DBMS Database Management System
DOM Document Object Model
FBP Flow-Based Programming
HTML HyperText Markup Language
HTTP Hypertext Transfer Protocol
IT Information Technology
JSON JavaScript Object Notation
MVC Model, View, Controller
NoSQL Not only SQL
ORM Object-Relational Mapping
REST Representational State Transfer
SMTP Simple Mail Transfer Protocol
SOA Service-Oriented Architecture
SOAP Simple Object Access Protocol
SQL Structured Query Language
URL Uniform Resource Locator
VPL Visual Programming Language
WS Web Service
XML Extensible Markup Language
Abstract
This Thesis presents the design and implementation of a web-based general-purpose data processing platform. The platform consists of a storage system, processing system, and an application server with an exposed RESTful in-terface. Through this interface clients, such as web browser applications, can access and control data processing as well as view the results of it. The pro-cessing system is inspired by dataflow propro-cessing, defining each process as a
black box with inputs and outputs. Connecting the outputs to inputs of other processes enables data to flow between processes and allows for creation of processing pipelines. Triggers – conditions under which a process can begin work on available input data – enable automation of the processing pipelines. Such a system allows users who lack programming expertise to easily create and run complex dataflow operations.
Keywords
web application, multi-layered architecture, dataflow processing, data ana-lytics
Povzetek
V magistrski nalogi je predstavljena zasnova in implementacija pilotne ver-zije sploˇsne spletne platforme za podatkovno analitiko. Podrobno sta pred-stavljena streˇzniˇski del za hranjenje in obdelavo podatkov ter programski vmesnik, preko katerega spletni odjemalec komunicira s streˇznikom. S pre-prostimi primeri prikaˇzemo, da je platforma razˇsirljiva – enostavno je mogoˇce razˇsiriti obstojeˇce ter dodati nove zmogljivosti. Sistem procesiranja podat-kov temelji na podatpodat-kovno vodenih (angl. dataflow) principih in s pomoˇcjo sproˇzilcev, ki doloˇcajo pogoje pri katerih se lahko proces samodejno priˇcne, omogoˇca avtomatizacijo procesiranja. Vsak proces lahko razumemo kot ˇcrno ˇskatlo z definiranimi vhodi in izhodi, procese pa lahko med seboj smiselno poveˇzemo in omogoˇcimo, da podatki iz izhodov teˇcejo v vhode naslednjih povezanih procesov. Sistem uporabnikom omogoˇca, da tudi brez programer-skega znanja sestavijo in izvajajo kompleksne podatkovno vodene operacije, saj je abstraktne predstavitve procesov moˇc med seboj povezati tudi brez poznavanja njihovih podrobnosti.
Kljuˇ
cne besede
spletna aplikacija, veˇc-slojna arhitektura, podatkovno vodeno procesiranje, podatkovna analitika
Razˇ
sirjeni Povzetek
Magistrska naloga predstavi razvoj spletne platforme za hranjenje, obdelavo in vizualizacijo podatkov. Z zasnovo reˇsitve smo ˇzeleli izdelati sistem, ki je lahko nadgradljiv in preprost za uporabo, sploh za uporabnike, ki nimajo programerskih izkuˇsenj. Avtor naloge je pri naˇcrtovanju in razvoju plat-forme sodeloval s podjetjem Genialis1 ter na podlagi diskusije s sodelavci razvil ogrodje in prvo iteracijo spletne aplikacije s pripadajoˇcim spletnim streˇznikom, nato pa ˇse leto sodeloval pri izpopolnjevanju in nadgrajevanju reˇsitve.
Osnova delovanja platforme je podatkovno vodeno procesiranje (angl.
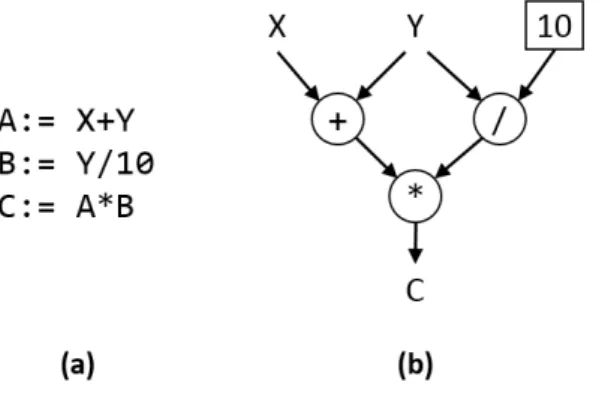
dataflow processing) [17, 32], pristop, ki aplikacijo predstavi kot usmerjen graf. Med vozliˇsˇci grafa, ki predstavljajo operacije, se po usmerjenih pove-zavah pretakajo podatki. Ko v neko vozliˇsˇce prispejo (vsi) vhodni podatki, se nad njimi izvede operacija, nato pa iz izhodov vozliˇsˇca naprej po grafu do naslednjih povezanih vozliˇsˇc steˇcejo izhodni podatki. Ta pristop k pro-cesiranju omogoˇca istoˇcasno izvajanje med seboj neodvisnih operacij in je zelo drugaˇcen od tradicionalnega, von Neumannovega, pristopa k programi-ranju, kjer se operacije izvajajo ena za drugo. Slika 1 prikazuje primerjavo klasiˇcnega programa (zaporedja ukazov) ter ekvivalentnega podatkovno vo-denega programa, predstavljenega z usmerjenim grafom.
Podatkovno vodeno procesiranje je bilo na zaˇcetku preuˇcevano na ni-voju strojnih ukazov in kot alternativa von Neumannovemu modelu proce-siranja. V devetdesetih so raziskovalci ugotovili, sta si pristopa med seboj
1
Slika 1: Primerjava preprostega sekvenˇcnega programa (a) ter ekvivalentnega podatkovno vodenega programa, predstavljenega z usmerjenim grafom (b), primerjava je prikazana kot so jo predlagali Johnston in sod. [17].
nista izkljuˇcujoˇca, temveˇc le dve skrajnosti razpona moˇznih arhitektur [24]. Podatkovno vodeno procesiranje lahko v kontekstu klasiˇcnega procesiranja razumemo kot veˇcjedrno arhitekturo, ki vsak strojni ukaz izvede v svoji niti. Ta nov pristop je podlaga za preuˇcevanje tako imenovanega hibridnega po-datkovnega procesiranja (angl. hybrid dataflow), z vidika naloge pa je po-memben, ker kaˇze, da je podatkovno vodeno procesiranje moˇc razumeti tako na nivoju strojnih ukazov kot tudi na viˇsjih, abstraktnejˇsih nivojih.
Programiranje na osnovi tokov (angl. flow-based programming, FBP), ki ga je v sedemdesetih izumil Morrison [22, 23], je nekoliko viˇsje-nivojski pristop k podatkovno vodenemu procesiranju. FBP razdeli razvoj aplikacije na dva dela – izdelavo usmerjenega grafa oz. diagrama ter implementacijo posameznih komponent (vozliˇsˇc). Posamezne komponente lahko razumemo kot ˇcrne ˇskatle z doloˇcenimi vhodni in izhodi, ki iz vhodnih podatkov ustva-rijo izhodne na podlagi nekega algoritma. Ta algoritem je lahko poljubno preprost ali kompleksen, zdruˇzevanje preprostejˇsih komponent grafa pa po-meni ustvarjenje viˇsje-nivojskih komponent. Visoko-nivojske komponente so osnovni gradniki, s katerimi na platformi opisujemo procesiranje podatkov.
Ker podatkovno vodeno procesiranje in programiranje uporablja grafe, je le-te moˇc na preprost naˇcin vizualizirati. Vizualni programski jeziki (angl.
visual programming languages) [17] uporabljajo podoben pristop in z uporabo takˇsnih grafov oz. diagramov doseˇzejo izboljˇsanje preglednosti in razumeva-nja napisane izvorne kode. Vizualni pristopi k programiranju premoˇsˇcajo razhajanje med podatkovno vodeno fazo naˇcrtovanja aplikacije in deklara-tivno fazo implementacije [1]. Dodatna prednost vizualnega pristopa je, da so diagrami potekov lahko razumljivi tudi nepoznavalcem. Idejo in delovanje sistema je moˇc razumeti tudi brez poznavanja podrobnosti implementacije posameznih komponent.
Pred predstavitvijo platforme je potrebno definirati nekaj terminov, ki se pogosto uporabljajo v kontekstu platforme. Podatek je skupek relevantnih informacij, ki predstavlja en vnos v podatkovni bazi. K enemu podatku lahko pripada ena ali veˇc datotek, odvisno od definicije podatkovnega tipa posa-meznega podatka. Del pripadajoˇcih informacij je nespremenljiv in doloˇcen ob dokonˇcnem zapisu podatka v bazo, drugi del pa lahko uporabniki po ˇzelji spreminjajo. Vsak podatek nastane kot rezultat procesorja, koncepta, ki smo ga povzeli iz podatkovno vodenega procesiranja. Procesor lahko na eni strani sprejme vhodne podatke, na drugi pa vedno ustvari vsaj enega ali veˇc novih izhodnih podatkov. Obenem je procesor oz. sistem za upravljanje pro-cesiranja tisti, ki doloˇca nespremenljiv del informacij posameznega podatka.
ˇ
Se en pomemben koncept soshemeinpredloge, ki sluˇzijo kot opis struk-ture informacij shranjenih v podatku. Tako sheme kot predloge delujejo po enakem kljuˇcu, razlika v imenih pa je prisotna za laˇzje razloˇcevanje med deli strukture, ki jih uporabnik lahko (predloge) in ne more spreminjati (sheme). Z zamenjavo predloge lahko uporabniki prilagodijo del strukture informacij podatka svojim potrebam. Razlog za loˇceno hranjenje strukture in informacij samih je, da je s takˇsnim pristopom mogoˇce razviti sistem za generiranje vno-snih in prikaznih obrazcev. Hkrati to zelo pripomore k sploˇsnosti platforme, saj je neglede na tip podatka mogoˇce shraniti vse relevantne informacije.
Zadnji koncept so aplikacije. Platforma svoje zmogljivosti izpostavlja v splet preko aplikacijskega programskega vmesnika (angl. application pro-gramming interface, API), za krmiljenje in interakcijo pa so potrebni
odje-malci. Aplikacija je uporabniˇski vmesnik platforme, ki preko APIja krmili procesiranje ter prikazuje rezultate le-tega. Priˇcakujemo, da bodo aplika-cije tipiˇcno razvite za spletne brskalnike, ˇcetudi je do spletnega vmesnika moˇc dostopati s katerokoli zdruˇzljivo tehnologijo. Nekaj primerov aplikacij je razvil Genialis (na primer osnovno okolje za upravljanje s podatki, procesi in sproˇzilci ter specializirano aplikacijo za vizualizacijo genskih ekspresij), razvijejo pa jih lahko tudi dovolj veˇsˇci uporabniki.
Platforma je bila zasnovana z veˇc-slojno arhitekturo (angl. multi-layered architecture), ki jo sestavljajo sloj trajnosti (angl. persistence layer), sloj za procesiranje podatkov (angl. processing layer), aplikacijski sloj (angl.
application layer) in predstavitveni sloj (angl. presentation layer). Cilj je bil ustvariti modularno strukturo s ˇsibko sklopljenimi komponentami, ki med seboj komunicirajo preko vmesnikov in jih je moˇc zamenjati za alternativne komponente z zdruˇzljivimi vmesniki. Slika 2 prikazuje diagram arhitekture sistema s pomembnejˇsimi uporabljenimi tehnologijami za vsak sloj.
Slika 2: Arhitektura sistema z uporabljenimi tehnologijami.
Sloj trajnosti skrbi za hranjenje podatkov. Platforma uporablja tri naˇcine shranjevanja podatkov: relacijsko podatkovno bazoPostgreSQL2, ne-relacijsko
podatkovno bazoMongoDB3 in datoteˇcni sistem. Podatki z relacijsko
struk-2
www.postgresql.org 3
turo, kot na primer uporabniki, skupine uporabnikov in podatki o aktivnostih uporabnikov, so shranjeni v relacijsko bazo. Informacije o podatkih, ki so na platformo naloˇzeni za procesiranje, so shranjene v MongoDB, ne-relacijski bazi specializirani za hranjenje dokumentov. Podatkom pripadajoˇce datoteke so shranjene v porazdeljenem datoteˇcnem sistemu. Dostop do podatkovnih baz je krmiljen preko sistemov za objektno-relacijsko preslikavo (angl. object-relational mapping, ORM), kar pripomore k ˇsibki sklopljenosti sloja trajnosti in aplikacijskega sloja.
Aplikacijski sloj je razvit v Djangu4, okolju za razvoj spletnih
aplika-cij v programskem jeziku Python. Aplikacijski sloj doloˇca funkcionalnosti platforme ter jih preko APIja izpostavlja spletu. API je definiran glede na doloˇcila specifikacije REST [11] in na zahtevke odjemalcev odgovarja s poˇsiljanjem relevantnih podatkov v notaciji JSON. Pomemben del zagotavlja-nja pravilnega delovazagotavlja-nja sloja je avtomatsko testiranje modulov. Za veˇcino komponent, predvsem pa API, so napisani testi, ki preverijo pravilnost de-lovanja teh komponent. Testi se samodejno zaˇzenejo, ko so v izvorno kodo dodane spremembe. Sloj za procesiranje je prav tako napisan v programskem jezikuPython z uporabo knjiˇzniceCelery5. Posamezni procesorji se izvajajo znotraj izoliranih Linux okolj (angl. Linux Containers, LXC). Tako je pro-cesorjem onemogoˇcen dostop do preostalega sistema ter do procesov ostalih uporabnikov.
Za avtomatizacijo procesiranja uporabljamo tako imenovanesproˇzilce [18]. Sproˇzilec doloˇca pogoje, pri katerih se lahko, ko so prisotni vsi vhodni po-datki, procesiranje samodejno priˇcne. Uporabniki lahko definirajo serijo sproˇzilcev ter tako ob naloˇzitvi primernih podatkov sproˇzijo samodejno pro-cesiranje vse do konˇcnih rezultatov. Avtomatsko procesiranje je posebej do-brodoˇslo v primerih, ko posamezni procesi trajajo precej ˇcasa, saj sistem brez nadzora in potrebe po dodatni interakciji ustvari konˇcne rezultate. Obenem lahko neveˇsˇcim uporabnikom podatkovno vodene cevovode nastavijo skrbniki
4
www.djangoproject.com 5
Slika 3: Slika prikazuje Shemo 4.2 izrisano v naˇcinu samo za branje ter v naˇcinu za urejanje.
ter jim tako omogoˇcijo nemoteno delo.
Na strani odjemalca so aplikacije predstavitvenega sloja napisane s pomoˇcjo ogrodjaAngularJS6, ki smo ga izbrali kot najbolj ustreznega izmed podobnih
reˇsitev za pisanje uporabniˇskih vmesnikov. Ogrodje omogoˇca razˇsiritev stan-dardnega jezika HTML s tako imenovanimidirektivami, ki jih okolje ogrodja interpretira ter izriˇse glede na njihovo definicijo. S takˇsnimi direktivami smo na primer implementirali avtomatsko generiranje obrazcev iz shem ter infor-macij nekega podatka (Slika 3).
Platforma je relativno preprosto razˇsirljiva, saj ji je moˇc dodati tako nove procesorje, ki so zapisani v jeziku YAML (primer definicije procesorja je Izpis 4.4), kot tudi nove aplikacije (preprost primer aplikacije prikazuje Slika 4.4). Seveda pa je mogoˇce izdelati tudi bistveno bolj zahtevne aplikacije – Slika 4 prikazuje zgoraj omenjeni primer vmesnika aplikacije za vizualizacijo genskih ekspresij.
V nalogi predstavljena platforma je tudi po pribliˇzno dveh letih in pol od priˇcetka razvoja ˇse vedno v uporabi ter se aktivno vzdrˇzuje in nadgrajuje. Podjetje Genialis tudi razvija nove aplikacije ter tako reˇsuje probleme podat-kovne analitike na podroˇcju bioinformatike. Predstavljene ideje so preˇzivele in zaˇzivele in se ˇse vedno izpopolnjujejo v dinamiˇcnem start-up okolju.
6
Slika 4: Vmesnik aplikacije za vizualizacijo in analizo genskih ekspresij dict-yExpress8.
8Aplikacija je dostopna na
Chapter 1
Introduction
In early 2013 a start-up company Genialis9 set out to build a general data processing platform. The platform should support the whole data flow from uploading the raw data to viewing the results of processing in a web applica-tion. The author of this Thesis was one of the developers that planned the architecture, implemented the first iteration of the platform, and continued improving it during the first year of deployment.
The fundamental idea of the platform was to enable users that have little to no programming knowledge access to complex tools, ideally with an intu-itive visual interface similar to those in data mining suites likeOrange[8] and
KNIME [3]. The principles behind the idea are related to (visual) dataflow programming [17, 22], which is a programming paradigm that represents ev-ery process as an abstract black box with inputs and outputs (sometimes with exposed processing parameters as well). Outputs of one black box can be fed as inputs into the next one and in this way a processing pipeline can be built that transforms the raw data into results (Figure 1.1). The black boxes, and the processes they represent, are algorithms transforming some input data into outputs and have to be developed by programmers or users with sufficient skills. Once developed, however, these black box processes can be used by anyone who can meaningfully interconnect them.
9
www.genialis.com
2 CHAPTER 1. INTRODUCTION
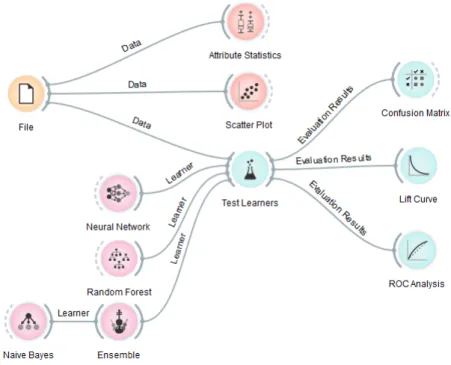
Figure 1.1: An example workflow created withOrange, a data analysis frame-work. The workflow was created with a visual programming interface. The input data File can be analysed (Attribute Statistics), visualised (Scatter Plot), and used as input data for machine learning techniques (Test Learn-ers). The results of this learning can be further analysed and visualised (the nodes to the right of Test Learners).
Building the pipelines and making sure that all the relevant data is pro-cessed can still be tedious for the user. Because of that, automation of the process was envisioned with the use of triggers – conditions under which a process can be started. Users can set up triggers that automatically run pro-cesses on relevant input data. Chaining such triggers can create pipelines. This way, a user only has to set up a processing pipeline with its corre-sponding triggers once. Then, every time new relevant data is added to the platform it is automatically processed by setting off a sequence of relevant triggers. Automation is important because some processing tasks can take a long time to complete. Triggers make sure the processing can continue
3
without supervision. Another key aspect of triggers is the ability to handle changes to the data. By changing some parameters of a process inside a pipeline, the data that was previously created by that process is no longer consistent with its settings. Triggers can be configured to automatically up-date the rest of the pipeline after such changes are detected or to just to notify the user of such inconsistencies.
The proposed platform is general in its scope, and is in principle able to process any kind of data. However, in order to succeed, any business requires a clearer strategy and focus. Genialis was created as a spin-off of the Bioin-formatics Laboratory at the Faculty of Computer and Information Science, University of Ljubljana. Consequently, the platform’s primary focus was the processing of data related to bioinformatics. The Bioinformatics Labo-ratory has previously developed two web solutions: PIPA10, a platform for
next-generation sequence analytics, and dictyExpress [28], a gene expression analytics platform. The platform that Genialis developed was envisioned as the new generation and expansion of the two previous solutions.
While PIPA and dictyExpress served as inspiration, the actual planning and later development of the platform we are describing in this Thesis started from scratch. The basic idea was an application with a multi-layered, loosely coupled architecture. Each part of the system should be independent and interchangeable, all communication between parts should be done through application programming interfaces – APIs. The core layers were the web application, the application server, the persistence layer, and the processing layer. The technologies for the implementation were already chosen for some layers while others, especially the client facing web application, required ad-ditional research. We first conducted a survey of JavaScript frameworks for building web applications (the details fir which can be found Section 4.2.1). After choosing the technological solutions, we started planning the architec-ture. The database outline was constructed and the APIs for interconnecting the parts were devised. Finally, implementation began as an iterative
4 CHAPTER 1. INTRODUCTION
cess, first creating a very basic solution that was gradually upgraded and expanded with additional features.
Thesis outline
We continue with the description of the proposed architecture in Chapter 2 which looks at the theoretical concepts and architectural practices we leaned on during development. The first part of the chapter details the concepts related to multi-layered software architecture and the second part explains dataflow programming. Chapter 3 is a survey of existing and related solu-tions where both relevant desktop and web applicasolu-tions are examined. Chap-ter 4 describes how the theoretical concepts and ideas were put into practice when implementing the platform. It begins with the development goals and architecture, continues with more specific solutions for each part of the ap-plication, and finally explains the implementation details of the key parts. Chapter 5 concludes the Thesis by reflecting on the work that was done and considering further features that can still be implemented in the future.
Chapter 2
Theoretical background
2.1
Architecture
The client-server architecture provides the scaffold of any distributed appli-cation that communicates through the Internet. It naturally evolved from the times of centralised computing to how (simple) client-server communi-cation in web browsers works today. With the advent of cloud computing, the architecture of applications has become much more complicated, but in the most general terms it still adheres to the old client-server separation of a service provider and a service consumer. Best design practices have emerged and the standard for modern web applications is a multi-layered architecture. Most commonly there are three layers: the presentation layer, the applica-tion (also called business, business logic, logic, or just the middle) layer, and the persistence (or data) layer. There is some confusion regarding the us-age of the terms layer and tier when describing an architecture, the words often being interchanged. Fowler [12] explains that the difference between the terms is in their implication – tier implies a physical separation (different machine). A multi-layered application is thus not necessarily multi-tiered, the application and persistence layer can run on the same physical machine. The presentation layer of a web application is the interface through which a user interacts with the application; it displays information and results,
6 CHAPTER 2. THEORETICAL BACKGROUND
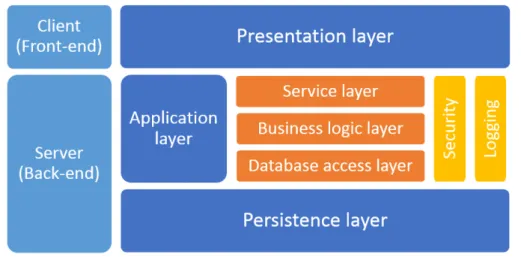
handles users’ actions, and transforms these actions into requests to the ap-plication layer when required. The presentation layer is the client portion of the client-server architecture and because of that, it is also often referred to as thefront-end; the same analogy applies to the rest of the layers resulting in the termback-end being used to refer to the server part of the application. The persistence layer concerns itself with data storage and the interfaces for accessing the stored data. Between them is the application layer which handles communication between the other two layers as well as all the func-tionality of the web application. The application layer is usually the most complex of the layers and often ends up being multi-layered itself. Because of this, the three-layered architecture is sometimes referred to as multi- or n-layered to account for the additional separation. Additional layers inside the application layer can be, for example, the service, business logic/domain, data access, and the processing layers. This separation can once again either be logical or physical (different machines) as well, thus resulting in additional tiers. Even if some components of the application layer end up logically sep-arate, other parts, like logging or security measures, are vertically integrated throughout the layers to ensure proper functionality. An example of such an architecture is shown in Figure 2.1.
The service layer represents the middle-ware interface to which the pre-sentation layer connects. Such an interface substitutes the typical request-response communication between the client and the server, applying an ad-ditional level of abstraction between the user interface and the application layer. The benefit of such an abstraction is that various kinds of clients familiar with the API of the service can access it – instead of just the user interface, the service can also be accessed by other applications. This concept is further explained in Section 2.1.6. The business logic or domain layer is an abstraction of the concepts, rules, and functionality of the problem domain, encoding the possibilities of what can be done with the data. Evans [10] calls it “the heart of business software”. The data access layer is the bot-tom middle-ware, responsible for the communication with the data layer. It
2.1. ARCHITECTURE 7
Figure 2.1: A multi-layered architecture with a separation between the front-and back-end, the three typically used layers, front-and a more detailed breakdown of the application layer. The security and logging blocks are examples of modules that are accessible throughout the inner layers of the application layer.
typically contains an object-relational mapping system.
Lastly, there is the processing layer, although the processing ‘part’ would probably be more accurate. Typical architecture descriptions do not involve a discussion of this part but we believe it is an important one. We under-stand the processing layer as the one handling the scheduling of jobs and management of the processing units – workers – that perform the tasks. If the jobs ordered by a user through the interface are long-running and nu-merous, they require a dedicated system for their execution. This becomes important when the scalability of the application is considered and is further explored in Section 2.1.2.
Most of the benefits of a multi-layered architecture stem from the separa-tion of concerns principle. Separation of concerns is one of the core software architecture design paradigms and aims to split the whole into parts that address different concerns. When describing this technique of ordering one’s thoughts, Dijkstra [9] explains concerns as a way of focusing on one aspect of the whole that can be viewed as independent from the rest. The principle
8 CHAPTER 2. THEORETICAL BACKGROUND
can be put into practice by utilising modular design.
2.1.1
Modular design
Modular design is attributed to David Parnas [25], who introduced it as a design principle that shortens development time along with improving the flexibility and comprehensibility of the product. The key to a good modular design of a system is the correct utilisation of information hiding. Modules should be isolated parts of the system based on their functionality and they should separate the interface from the implementation – hiding internal data and functions while exposing the functions that other modules can access as an interface. This way, if the implementation of the module has to be modified, it will not break the system. Other modules access only the inter-face which should remain stable even if how the functionality is implemented changes completely.
Stevens et al. [33] use two additional terms to describe the modularity of a system – cohesion and coupling. Cohesion describes the degree to which the elements of a module are bound together; each module should be highly cohesive, both in terms of its implementation and the functions it can per-form. For example, a part of an application with multiple responsibilities can be split into multiple modules with high cohesion that handle one of those responsibilities. Coupling describes the relationship between modules, examining how interconnected and (in)dependent they are. Modular design strives towards loosely coupled modules – a module should use little or no knowledge of the implementation of other modules. Ideally, two modules with the same interface and completely different implementations should be interchangeable without breaking the system.
Examples of modular design can be found on all levels of software develop-ment, from object-oriented programming paradigms to how software libraries and modules are packaged and developed. On the higher levels, it separates parts of a system into logical units, an example of which is the multi-layered design mentioned above. By utilising the principles of modular design and
2.1. ARCHITECTURE 9
therefore developing loosely coupled, highly cohesive modules for each part of our multi-layered design solution, we should end up with modules that com-municate through application programming interfaces. An API is the stable interface of a module through which its functionality is accessed; an API can also be understood as a specification of the functionality. Development can happen in both directions – implementing the functionality of a specific interface as well as exposing the capabilities of a piece of software by defining its interface. Sometimes APIs can be standardised, for example the POSIX
family of standards which describe the interfaces of Unix operating systems or SOAP and REST service specifications, which are further explained in Section 2.1.6. As mentioned above, modules with equivalent APIs should be interchangeable, regardless of their implementations.
An examination of the benefits of modular design can begin by looking at Parnas’ goals and how they are achieved. Development time is shortened be-cause different independent modules can be developed simultaneously, after the common interfaces are agreed upon. Maintenance is shortened because a change to a module affects just the module and there is no need to mod-ify additional parts of the application; the dreaded ripple-effect of changes affecting increasing portions of an application should not happen with good modular design. Comprehensibility of the whole system is significantly im-proved compared to tightly coupled systems because each module concerns itself with one role instead of functionality being implemented in multiple interconnected parts of the application. Flexibility is also increased. As we have mentioned above, ideally a module should be easily replaceable with a different module with an equivalent API. This becomes important when software eventually becomes outdated or better solutions are found – inte-grating these into the system is much easier when only the interface has to be compatible.
Module re-usability is another important benefit – self-contained parts of the system can easily be reused elsewhere when their functionality is needed. To make sure the written code performs in the way it is expected, tests are
10 CHAPTER 2. THEORETICAL BACKGROUND
performed. Specifically, unit (also known as component) testing is usually employed to ensure that each part functions correctly. Modular design on all levels helps keep components succinct, loosely coupled and thus easily testable.
There are, of course, some drawbacks to modular design as well. The biggest is a communication overhead. The amount of overhead is relative to the size and the heterogeneity of a system. Modular applications inside the same domain experience minor overhead through the use of interfaces, while communication in large multi-layered applications, spread across machines and technologies, can have a significant impact on performance. Commu-nication between components based on different technologies often happens through standardised messages. Such messages need to be transported, trans-lated, and interpreted before they can be used (an example of such messaging systems are web services, explained further in Section 2.1.6). Another po-tential drawback is the so-calleddependency hell that can occur when using various modules and packages that come with dependencies of their own – the more that are used, the greater the potential for circular and/or conflict-ing dependencies, which has a detrimental impact on the comprehensibility and maintainability of a project.
The communication overhead is an acceptable drawback when all the ben-efits of modular design are considered. In cases where different technologies are communicating between each other, some kind of an API will always have to be used. Potential problems with dependencies can be avoided by care-ful planning or by utilising systems for managing dependencies. In general, modular design incorporates so many of software development best practices that it should be used at any scale, but with large, multi-layered applications, it seems quite necessary.
2.1.2
Scalability
When developing a web platform with as grand a scope as we had, it is very important to keep scalability in mind – the system should be able to handle
2.1. ARCHITECTURE 11
anything it may eventually encounter. To discuss scalability, we first need to clarify two important concepts: big data and cloud computing. Both seem to lack a clear definition, changing and evolving over the years to suit emerging trends. The original definition of big data can be traced back to a research report by Laney in 200111that defined big data as data exhibiting an increase
in the three Vs – volume, velocity, and variety. Highly varied data, ever increasing in size and scope, was (and still is) being created at unprecedented speeds (velocity does not just refer to the speed of data generation but also to the speed at which such data needs to be processed). Such (big) data could not be handled by what was then conventional data processing; it required new approaches and ideas. This was the basis of the currently most commonly accepted definition of big data – data that is too large and complex to be processed with standard approaches [31], with ‘processing’ referring to anything to do with data, be it capturing, storage, analysis, etc.
Cloud computing is another similarly ambiguous term. The authors of a paper titled “Demystifying Cloud Computing” [19] write that they uncov-ered 22 distinct definitions of cloud computing and opted for one taken from Gartner, Inc. which states that is is “a style of computing where massively scalable IT-enabled capabilities are delivered “as a service” to external cus-tomers using Internet technologies”. This is an accurate definition of cloud computing but it mostly refers to the so-called public cloud, where infras-tructure, platforms, and software are offered as a service. The other option it does not include is the possibility of building a private cloud where the same massively scalable IT-enabled capabilities are harnessed by only the company that built it.
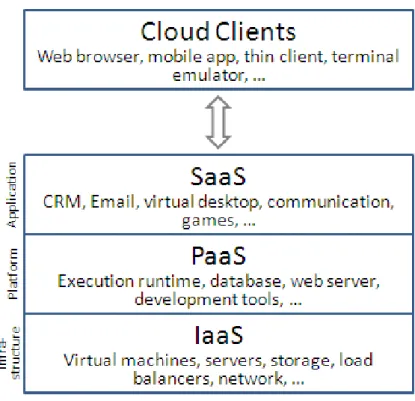
X-as-a-Service (XaaS) or anything as a service, is the model that de-scribes how cloud computing providers offer their products. In exchange for a fee (or sometimes free of charge) the service is offered through cloud clients. Figure 2.2 shows the hierarchy of these services. The clients are devices or
11
blogs.gartner.com/doug-laney/files/2012/01/ad949-3D-Data-Management-Controlling-Data-Volume-Velocity-and-Variety.pdf
12 CHAPTER 2. THEORETICAL BACKGROUND
software receiving the service, typically web browsers or mobile applications, but also various other thin clients. The functionality, or the level of con-trol, a user is granted through the service corresponds to the level of service the user is using. The following explanations are based on the NIST defi-nitions12. Infrastructure-as-a-Service (IaaS) usually offers virtualised
funda-mental computing resources (processing power, storage, networks,. . . ). The user is granted full or a high level of control over the components but not over the underlying cloud infrastructure – they can create and manage their own virtual machines. The next level is Platform-as-a-Service (PaaS) where the user is provided a platform with resources on which they can run their appli-cations (if the execution of the appliappli-cations is supported by the service). The user thus has control over the application and can manage how it is run, yet has no access to how the infrastructure is setup and run – the user can usually manage the deployment and configuration of the application. The big benefit of PaaS is the reduction in complexity when compared to IaaS, as users can focus on the application and let the service provider solve the infrastructure portion. Software developers choose between IaaS and PaaS depending on the level of control they require over their application; interestingly, PaaS providers usually do not build their own clouds, they use IaaS to offer their services. Software-as-a-Service (SaaS) grants end users the usage of appli-cations deployed on cloud infrastructure. It can be understood as a model of software distribution and licensing, where the software is centrally hosted and accessed through clients by subscribing users/customers. Developers use such a model because of the numerous benefits it offers when compared to regular software distribution through binary files, these include: control over software updates, access to user data and behaviour, cross-platform and device compatibility. The end-users also benefit from some of the listed ad-vantages, but others are potentially big drawbacks of the model, especially the fact that end-users often relinquish control of their data, thus facing potential privacy and security issues; and a complete copy of the software
2.1. ARCHITECTURE 13
is never owned by the user. Mitigating these drawbacks – particularly the security and privacy aspects – is one of the keys to successfully developing SaaS products.
Figure 2.2: The hierarchy of cloud computing services.
Lastly, let us touch upon scalability. Bondi [5] defines it as “the ability of a system to accommodate an increasing number of elements or objects, to process growing volumes of work gracefully, and/or to be susceptible to enlargement”. In general, there are two ways a system can add resources: scaling horizontally or scaling vertically [21]. A system running on a compu-tational node can be scaled up by increasing the power of the node, for ex-ample by adding additional memory or CPU power to the node. Scaling out, or horizontally, means adding additional computational nodes. Of course, a system needs to be designed with such horizontal scalability in mind to prop-erly utilise additional nodes. By adhering to the above-mentioned modular design, such horizontally scalable applications can be written.
14 CHAPTER 2. THEORETICAL BACKGROUND
key to the achieving affordable, flexible scalability of a web platform. IaaS and PaaS can be used to deploy an application in a manner that allows for easy horizontal scaling simply by adding additional instances of whichever module or modules the system needs. A good example of such scaling can be found in the above-mentioned processing part of the hypothetical multi-layered application. When the job scheduler is given many jobs to handle – an amount that would take too long to process with the current number of workers – additional worker nodes can be temporarily spawned on the cloud infrastructure to handle the surge in jobs and once the work is processed the additional worker nodes are destroyed. With a major surge of job requests, even more additional job schedulers can be spawned – the same principle applies to all parts of the application.
2.1.3
Data storage
A modern web platform for data processing should be able to store and pro-cess any and all kinds of (big) data. The most commonly used database management systems (DBMS) have been (and still are, for most use cases) relational databases. Along with the rise of cloud computing and big data use-cases have appeared that could not be solved with relational databases adhering to the ACID standard of transactions. The acronym ACID was first used by Haerder and Reuter [16] and stands forAtomicity,Consistency,
Isolation, and Durability, although the definition of these properties is at-tributed to Gray [15]. The properties describe how transactions within a database need to be processed to ensure reliability, accuracy, and efficiency. Relational databases were able to offer such transactions and the solution was satisfactory until the need for massive scaling of databases arrived. Classical relational databases have come up against the Brewer’s CAP theorem [7] which states that no distributed system can simultaneously guarantee Con-sistency,Availability andPartition tolerance. A consistent system ensures all nodes have the same data at all times, the guarantee of availability requires that every request to any (non-failing) node must result in a response, and
2.1. ARCHITECTURE 15
partition tolerance guarantees that the system will continue to operate even if parts of it fail. Classical relational databases sacrifice partition tolerance to ensure consistency and availability, thus sacrificing horizontal scalability. In a 2012 update [6], the author of the CAP theorem adds that the three categories are not binary and should be understood as continuous and also that the two-out-of-three rule can be potentially misleading if understood categorically instead of with a nuanced approach. New solutions have been gathered under the umbrella term NoSQL (Not only SQL) – SQL is the most commonly used query language in relational databases – though a more ac-curate term for it would be non-relational databases.
No definitive categorisation of the NoSQL databases exists but they are generally grouped based on the data model they use to represent informa-tion: key-value databases, document databases, graph databases, and col-umn databases. Additionally, there are two general directions that NoSQL databases are able to choose from in order to gain partition tolerance – either sacrificing consistency or availability. If the DBMS sacrifices availability, it can still perform ACID transactions but usually has to limit them to those that can be consistent, refusing others. The other option is giving up on consistency, and responding to all requests, but potentially returning out-dated data. To describe this opposite end of an ACID transaction, another acronym was created – BASE [27], standing forBasically Available,Soft state, and Eventual consistency. The most important one of the three is eventual consistency – in a distributed system, one node receives new data and even-tually propagates it through the other nodes, thus ensuring they eveneven-tually all have the same information (this is a very simple example, glossing over potential conflicts and security measures). An additional important differ-ence between NoSQL and relational databases is that the former usually gives up on complex data schemata and efficient complex queries that relational databases are able to do, in order to gain the benefits described above.
16 CHAPTER 2. THEORETICAL BACKGROUND
2.1.4
Model-View-Controller
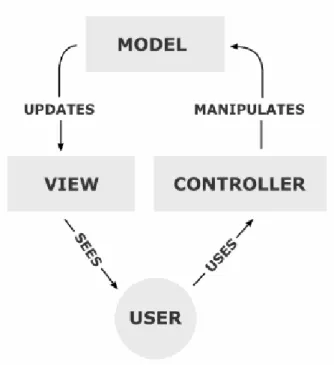
Model-View-Controller (MVC) is an architectural pattern for implementing user interfaces. It was described by Krasner and Pope [20] as a way of separating how data is presented inside the application (model), how the user sees the data (view), and how the user interacts with the data (controller); Figure 2.3 shows a simple MVC diagram. This separation increases the modularity and portability of interface components.
The model portion of the application is an implementation of the problem domain of the application – what data represents a certain state and how it can be changed. The view is a presentation of the model (or parts of it) as information in the user interface. The controller defines the possible interactions a user can input, transforming these inputs into commands. The controller sends commands to the model to cause some change in the model or commands the view to change how the model is represented. Changes in the model cause the view to update the representation.
2.1. ARCHITECTURE 17
The same model can have multiple views and controllers defined for it. A simple example is a hypothetical drawing application. The state of the drawing and possible manipulations of it are defined in the model. The view of the drawing represents its canvas but could also be a zoomed-in view of a portion of the canvas – a different view of the same underlying model. The controller converts the mouse inputs (e.g. drawing a circle) into commands for the model and the changes of the state of the drawing end up reflected in the view. Because of the modular nature of the architecture, adding support for a pen and tablet input device is relatively simple – only the controller needs to be updated.
Since the specification of the MVC pattern, various implementations of it have ended up working off the initial idea to, creating derivative patterns such asModel-View-Adapter,Model-View-ViewModel, Model-View-Presenter, etc. The whole class of such patterns are commonly referred to asMV* because they mostly differ in how they define what the original pattern refers to as the controller, as well as the connections between the three parts.
2.1.5
Object-relational mapping
Query languages are typically used to communicate between an application and a database and the most commonly used query language isSQL. When data needs to be fetched, an SQL query is constructed and executed, the returned data entries are then usually converted to objects (in object oriented programming languages) to be used in the application. Object-relational mapping (ORM) exists as an abstraction of this process, automating the saving, query generation, fetching, and the conversion into objects so that programmers only work with objects.
ORM frameworks are a very welcome level of abstraction, significantly cutting down on the amount of code that needs to be written and allowing the programmers to stay within the object oriented world and not having to write SQL at all. The ORM system essentially handles everything related to the database, starting with the creation of tables that match the objects.
18 CHAPTER 2. THEORETICAL BACKGROUND
Additionally, the database solution can be exchanged for another compatible one without major changes to the code of the application, usually just by switching the adaptor handling the communication to a specific database solution.
ORM frameworks are often criticised for being bloated, inefficient and guilty of obfuscation, the gap between object-oriented and relational ap-proaches – the so called impedance mismatch – is difficult to bridge as well [29]. The conversions between the objects and data add overhead, the generated queries can be inefficient, and the programmer is often not aware of what exactly happens. However, when programming in object oriented lan-guages, the data from the database will eventually have to be transformed into objects, meaning the programmer will end up writing some sort of map-ping between objects and the relations inside the database – so why not just use an ORM framework? Most ORM frameworks support manually written queries for when performance is critical and at the same time offer plenty of benefits. Object-relational mapping is supported by all commonly used object oriented languages with various modules/packages/frameworks, and although SQL was often mentioned, ORM solutions for NoSQL databases also exist.
2.1.6
Representational state transfer
Service oriented architecture (SOA) is an architectural pattern where com-munication between components happens through services, typically over a network – one component of a system provides the service and another consumes it. Because the underlying platforms of services can be very di-verse, a standardised way of defining services and the communication between providers and consumers was needed. Solutions were proposed and the Sim-ple Object Access Protocol (SOAP) was chosen as the standard protocol for communication13. SOAP wraps messages to be exchanged in an envelope and
transfers them through common transport protocols like HTTP or SMTP.
2.2. DATAFLOW PROGRAMMING 19
SOAP was designed for expansion, and many additional standards and pro-tocols have been developed as solutions to the problems and shortcomings of the original protocol. Examples of such solutions are WS-Security, devel-oped to provide end-to-end security, andWS-Atomic Transaction, developed to ensure the atomicity of transactions. Web services related specifications are often referred to by using the termWS-*.
SOAP, along with the whole WS-* stack, is perceived to be complicated and unnecessarily complex when the goal is exposing a relatively simple ser-vice [26]. An alternative solution is representational state transfer (REST, also ReST), which was first described by Fielding and Taylor [11]. APIs developed according to this style are called RESTful APIs. REST is not a standard but an architectural style, although most implementations do fol-low a set of rules. Compared to SOAP, which packages data inside XML envelopes, REST uses the capabilities of HTTP and its standard methods (such as GET, PUT, POST, DELETE) to expose a service’s resources. With-out the XML envelope, RESTful resources can return data in a form that can immediately be used, most often objects in the JSON notation – the output can match the intended usage.
Choosing an appropriate solution mostly comes down to intended usage. Developers of simple APIs that are intended to be used through HTTP only usually opt for RESTful APIs, while more complicated solutions requiring advanced features across multiple platforms and communication channels use the WS-* solutions and SOAP [26].
2.2
Dataflow programming
Dataflow programming is a programming paradigm that models programs as directed graphs, where data flows between nodes that represent opera-tions [17, 32]. It represents a shift away from the traditional thinking about programs as a sequence of instructions executed one by one by a von Neu-mann processor. In the directed dataflow graph, an operation can be
exe-20 CHAPTER 2. THEORETICAL BACKGROUND
cuted as soon as its inputs are available; this allows instructions independent of each other to be executed in parallel. Because of this separate processing model, we can speak of the dataflow architecture, which seeks to implement the paradigm as a computer architecture, anddataflow programming, which tries to achieve the goals of the paradigm through software.
The discussion about the hardware implementations, the history of dataflow programming, and the details of its implementation are beyond the scope of this work. Interested readers are referred to the article by Johnston et al. [17]. We will take a look at the basic dataflow execution model as it is the conceptual basis of later research.
2.2.1
Dataflow execution model
As we have already stated, a program in the dataflow paradigm is represented by a directed graph where the nodes represent primitive instructions, such as arithmetic or comparison operations; the following paragraphs are a para-phrase of the explanation of the pure dataflow model in [17]. The directed arcs of the graph represent data dependencies between nodes, inputs flow towards the node andoutputs flow from it. The data flows between nodes in the form of data tokens and an arc functions as a first-in, first-out queue for the tokens. At the beginning of the program, the so-calledactivation nodes
place data tokens onto initial arcs and with that the network can begin pro-cessing. When a node has the specified set of input tokens available through its arcs (a firing set) it is said to be fireable. Such a node is executed at an undefined time after it becomes fireable, removing its input tokens from the queues, processing then, and placing new data tokens on some or all of its output arcs. After this, the node waits until it becomes fireable again. This is the key difference from the von Neumann execution model, where an instruction is only executed when the program counter reaches it, even if it could have been executed earlier. Dataflow processing supports parallel execution at the instruction level.
2.2. DATAFLOW PROGRAMMING 21
Figure 2.4: An example of a simple program (a) and its dataflow equivalent (b), shown as proposed by Johnston et al. [17].
equivalent (b). The capital letters represent variables and the number in the box represents a hard-coded value. The two arcs coming out of variable Y
represent a duplication of the value of the variable, the copies ending up in their respective nodes. Program (a) requires three time units to complete but the dataflow version can be completed in two time units because the first level of operations can be completed in parallel. The dataflow nodes are functional, meaning they do not modify the input data and have no side effects on other nodes.
This is the basic description of the dataflow execution model at the instruction level, the finest possible granularity. In the 1990s, researchers started realising that the von Neumann and the dataflow architectures are not mutually exclusive, but are instead two extremes among the possible architectures [24]. Fine-grained dataflow was seen as a multithreaded archi-tecture where each machine-level instruction is executed in its own thread. This shift in perception moved research towards the so-calledhybrid dataflow, or dataflow of varying granularity. With this we move onwards toward a more macro perspective.
22 CHAPTER 2. THEORETICAL BACKGROUND
2.2.2
Flow-based programming
Flow-based programming (FBP) was invented by Morrison [22, 23] in the early 1970s. In the past, it used to be referred to as dataflow programming
(as well as by other names) but it was renamed to FBP to differentiate it from the research being done in the dataflow field and because dataflow is more general in scope.
FBP views an application as a network of asynchronous processes, com-municating by exchanging streams of structured data called information packets (IPs). As with dataflow, the focus is on the data being exchanged and the transformations applied to it. The network is defined externally as a list of connections, separate from the processes. These connections are inter-preted and executed by a piece of software that Morrison calls thescheduler. Before we continue with a more in-depth look into FBP, it is important to understand that Morrison is describing both the paradigms of FBP as well as the manner of their implementation. We are more interested in the concepts and will be simplifying some parts that are too focused on the implementa-tion.
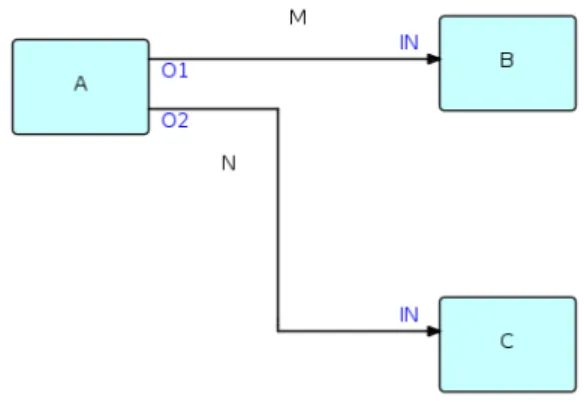
Figure 2.5: A simple example of a FBP diagram14.
In essence, FBP splits the development of an application into two parts
14Image created by Morrison and shared on Wikipedia (
en.wikipedia.org/wiki/
2.2. DATAFLOW PROGRAMMING 23
– designing the network diagram and implementing the components (nodes, processes). The components are treated as functional black boxes with in-puts and outin-puts and the network describes the connections between them. Figure 2.5 is an example of a very simple network definition. A, B, and C
are the black box processes,O1,O2 and the twoIN represent ports through which connectionsM andN connect the components. Morrison notes that it is possible for theB andC boxes to be executing the same code, and because of that, each component must be independent from the rest, with its own local storage and control blocks. For the same reason, shared port names are not a problem because they are relevant only in the context of a component. The connections are referred to as bounded buffers with a fixed capacity of IPs; if the buffer is full, the process feeding stops, and when the buffer is empty, the process is suspended. This very high-level overview should be enough to show how the components are defined and the similarity to the classical dataflow approach explained above. Readers that are interested in further details should refer to Morrison’s book [22].
FBP can be implemented in various programming languages, and Mor-rison provides some example implementations on his website15. The
imple-mentation allows programmers to write the high-level components and deter-mine how they are interconnected in conventional imperative programming languages. Morrison notes that if the scheduler is written in a sufficiently low-level language, components written in different programming languages can be used within a single network.
FBP exhibits the properties of modular design on a relatively low level, connecting together functional chunks of code to create parts of, and ulti-mately complete, applications. Building an application with the components naturally leads to loose coupling because the components only exchange data (and signals) between themselves. It also leads to the possibility of compo-nent re-use, easier maintenance, and a straightforward way to utilise hori-zontal scaling as well. Morrison also states that FBP is very useful for rapid
24 CHAPTER 2. THEORETICAL BACKGROUND
prototyping, first using simulated components that can later be swapped with components containing real process logic. It also never loses sight of the big picture, offering a macro overview of the functions of each compo-nent/module. The network schema as a medium eases the communication between everyone involved – from designers and developers to users and man-agement.
2.2.3
Visual programming languages
In the past, dataflow programming used diagrams (also called schemata or just graphs) as a visual aid to facilitate understanding. The concept of the
data flow diagram as the flow of data inside an information system can be traced back to the authors [33] of structured design that we discussed at the beginning of the Section 2.1.1 on modularity. Because the diagrams were so useful for understanding and reasoning about systems, it is no surprise that there were also incentives to use them as a means of constructing systems; this resulted in the invention ofvisual programming languages (VPLs). VPLs also exist at varying levels of abstraction, from very simple programming constructs to whole modules being connected together into a system.
Johnston et al. [17] present a well referenced historical review of visual (as well as text-based) dataflow programming languages. It includes an assess-ment of the state of the art and identifies areas that are still in need of devel-opment, but the overview focuses mostly on dataflow execution paradigms and implementation. We will examine their conclusions on data visual pro-gramming environments.
Developers face a paradigm shift when switching between the design phase and the coding phase [1]. When designing, they are naturally inclined to use the dataflow approach but the coding is typically imperative. Visual gramming languages blend the design and coding phases into a seamless pro-cess. As stated before, the graphical representation is helpful on many levels, Baroth and Hartsough [1] cite examples of dramatic gains in productivity as a result of the improved communication between the customer, developer,
2.2. DATAFLOW PROGRAMMING 25
and the computer due to the usage of visual programming tools. The level of success depends not only on the VPLs but also on the development envi-ronment in which they are used – the distinction between the envienvi-ronment and language is difficult to make because of the graphical nature of VPLs. Well-designed development environments with animated executions of pro-grams and the ability to seamlessly reason on multiple levels of abstraction can greatly benefit both the development and the design phase, especially.
Finally, the most important benefit in the context of this work is the fact that visual programming languages are intuitive to people with little to no programming experience. There are plenty of successful tools using visual dataflow interfaces as part of their interfaces, and many educational tools that teach programming and robotics to children also employ visual programming interfaces. For example, MathWorks Simulink16 is a graphical programming environment for modelling and simulating dynamic systems,
Scratch17 is a free educational VPL, and the LEGO Mindstorms robots18
can be programmed with a VPL. Dataflow interfaces are ideal when the end user requires complex operations but does not have the programming knowledge to implement them.
2.2.4
Triggers
The concept of triggers was touched upon in this Thesis when discussing the dataflow execution model. A node becomes fireable when all its inputs are available and is then processed at some undetermined time. It is important to note that the execution does not necessarily happen immediately after the last input arrives; this is the difference between a task being enabled – fulfilling all the prerequisites for execution – and being executed [34]. The external condition that leads to the execution is thetrigger. Actual execution is in the case of the dataflow execution model handled by the underlying
16www.mathworks.com/products/simulink
17
scratch.mit.edu
26 CHAPTER 2. THEORETICAL BACKGROUND
hardware or software implementation processing the instructions of the node (for example Morrison’s scheduler).
Triggers can be understood in two ways [18]: as a verb – an eventtriggers
an action if the event’s occurrence causes the action to be performed; and as a noun, where atrigger is an object (or event) that causes a triggering event. Triggers are mostly discussed in the context of workflow management [18, 34], which is the management and logistics of business processes and activities. Van der Aalst distinguishes between four types of triggers: automatic, user, message, and time triggers. Each represents an external cause that leads to the execution of a task in a workflow. We will move away from the area of workflow management and explain them in the context of a hypothetical web platform on which tasks can be performed. User events are the most straightforward, as the execution of an enabled task is triggered by a human, usually by selecting a possible action through an interface. Time and message events trigger actions periodically and upon the arrival of some sort of a request, respectively. Lastly, there are automatic triggers that trigger the execution of a task as soon as the task is enabled. The dataflow execution model described above can be considered a system with automatic triggering. When designing the platform, we tried to envision a system wherein au-tomatic processing could be done; ideally, the user would upload the data and a potentially hours-long workflow of linked tasks could be automatically executed. The problem, however, is that the automatic system has to be aligned with what the user wants. Because of this, we envisioned triggers as a set of rules/filters that the user can specify for a task. If potential input data meets the conditions expressed in the pre-set rules, it is automatically processed. This way, the whole workflow can be set up to run automati-cally upon the arrival of the appropriate data. The details and challenges of implementing such a system are explored in Section 4.3.2.
Chapter 3
Related work
In this Chapter we will examine existing software solutions that are similar or related to the platform we have developed. Some (PIPA3.1,dictyExpress3.2, andOrange 3.3) were chosen because they were highly related and served, in part, as inspiration for the platform. These three solutions were developed by the Bioinformatics Laboratory at the Faculty of Computer and Information Science. Others were chosen because they either provide solutions for data analytics and data visualisation or are related to the concepts of dataflow programming. Furthermore, because the domain field for the platform was primarily bioinformatics, solutions from there were considered as well.
3.1
PIPA
PIPA19 is a web application for managing and analysing next generation sequencing (NGS) data. The application supports data storage and pro-cessing with a multi-layered client-server architecture – the users access the application through a web browser client. The application fetches data from the server, displaying relevant information in the interface; data processing requests are also handled by the back-end server. Users can annotate the data entries based on pre-set templates, adding all the information they find
19pipa.biolab.si
28 CHAPTER 3. RELATED WORK
relevant. In addition to storing, managing, and processing data the appli-cation also supports data visualisation; for example, it usesJBrowse [30] to interactively visualise genomes.
One of the most significant limitations of the application is that it is written in Flash (Adobe Flash), a once widely used solution for developing rich web applications which was slowly phased out in favour of HTML5 and JavaScript. While the history of Flash is complex, one of the major reasons for its decline can be traced back to Steve Jobs’ “Thoughts on Flash”20, where
he describes why Adobe’s Flash is not an optimal solution because of its proprietary player as well as issues with reliability, security, and performance. Apple has not supported Flash on its mobile devices and thus Flash was, and is being, slowly phased out throughout the Internet. Maintaining and updating Flash applications in such an environment is a losing battle.
PIPA is important because it was a direct influence for the platform – one of the goals of development was to replace PIPA for the storage and processing of bioinformatics data. Some of PIPA’s architecture and solutions were used as inspiration to create a more modern, modular, and scalable product, particularly the multi-layered design with background workers and the open APIs which can be accessed through the web application or through a Python library.
3.2
dictyExpress
dictyExpress[28] is the second of the solutions developed by the Bioinformat-ics Laboratory in cooperation with Gad Shaulsky’s and Adam Kuspa’s labs at Baylor College of Medicine – a tool for the visualisation of gene expression experiments of the amoeba belonging to the Dictyostelium genus. dictyEx-press is also a Flash web application with a database server from which experiment data is retrieved and an analytics server, where the requests for various visualisation combinations are processed and the results cached for
3.3. ORANGE 29
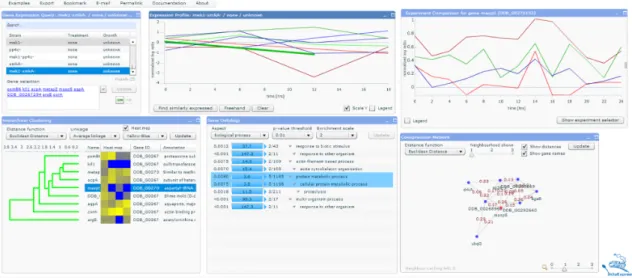
faster retrieval. Figure 3.1 shows the interface of the client application. The concept of this application is similar to the one used in PIPA, in fact through the exposed interfaces dictyExpress can query PIPA for its data; the technological limitations of Flash apply to dictyExpress as well. Ideally, both applications should run on the same platform, and this is where our solution comes into play – dictyExpress was supposed to be one of the first applications the platform would support.
Figure 3.1: dictyExpress’ interface for exploring and visualising Dic-tyostelium gene expressions.
3.3
Orange
Orange [8] is a general open source data analysis suite for machine learn-ing, data minlearn-ing, and data visualisation. It offers a Python scripting library as well as a graphical interface for interaction with the library. The visual programming interface is of particular interest to us because it is a good im-plementation of the high-level visual dataflow programming. An example of a dataflow schema created withOrange Canvas was shown in the Introduction (Figure 1.1). With simple drag and drop operations processing components
30 CHAPTER 3. RELATED WORK
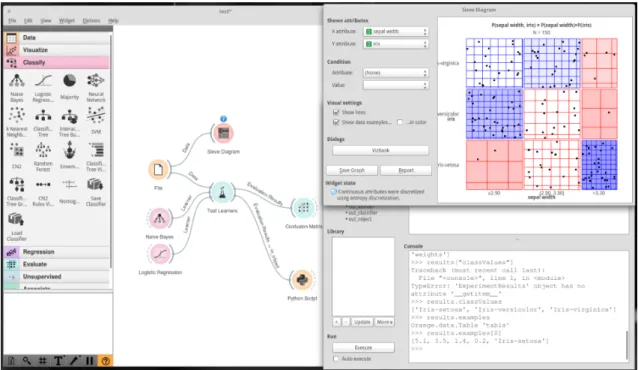
(widgets) can be added to the schema, starting with the input File. Data flows into the visualisation and processing widgets and updates the compo-nents automatically when the preceding widgets or their parameters change. Such an interface enables users to execute relatively complex data analysis workflows without needing to write a single line of code (programmers can use Python scripts as well). Figure 3.2 shows another example of Orange interface, with an open Python interpreter where the results can be analysed programmatically.
Figure 3.2: A data analysis workflow example in Orange with a Sieve Di-agram visualisation and a Python interpreter that uses the results of the prediction.
Orange is not a web application but its visual programming interface is something that the web platform should support to fully implement the dataflow paradigms and reach the widest possible user base.
3.4. KNIME 31
3.4
KNIME
The Konstanz Information Miner (KNIME) [3] is an open source environ-ment for data analysis with a strong visual programming interface. The application is written in Java and does not have an online component; it does, however, offer purchasable extensions to the free open source platform. With these extensions, the platform can become an enterprise level solution with central execution servers and centralised management. Enterprise users work with a desktop client and can remotely execute the workflows they create; results of the executions can also be accessed through web browsers. KNIME is not a web application in the typical sense, as full functionality is not accessible through the web client (although the enterprise edition does have a full SOAP-based API).
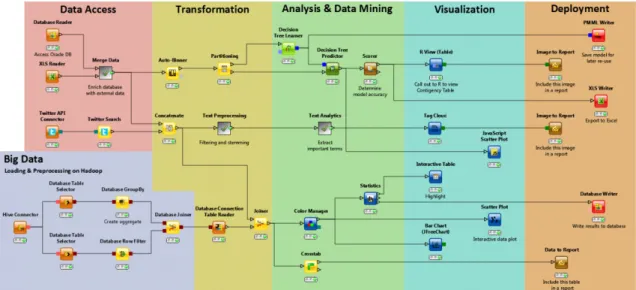
Figure 3.3: An example of an annotated schema from the KNIME platform22.
As with Orange, the component of interest is the visual interface. It is also a good implementation of dataflow paradigms. A special point of interest is the system of notification semaphores – an intuitive way to inform the platform users of the status of execution (red represents error, orange is