Classi
fi
cation of autistic individuals and controls using cross-task
characterization of fMRI activity
Guillaume Chanel
a,b,⁎
, Swann Pichon
a,c, Laurence Conty
d, Sylvie Berthoz
e,f, Coralie Chevallier
g, Julie Grèzes
g,h aSwiss Center for Affective Sciences, Campus Biotech, University of Geneva, Geneva, Switzerland bComputer Vision and Multimedia Laboratory, University of Geneva, Geneva, Switzerland c
Faculty of Psychology and Educational Sciences, University of Geneva, Geneva, Switzerland d
Laboratoire de Psychopathologie et Neuropsychologie EA 2027, Université Paris 8, France e
CESP, INSERM, Univ. Paris-Sud, Univ. Paris Descartes, UVSQ, Université Paris-Saclay, Paris, France f
Departement de Psychiatrie de l'Institut Mutualiste Montsouris, Paris, France g
Laboratoire de Neuroscience Cognitive, INSERM U960, Ecole Normale Supérieure, Paris, France h
Centre de Neuroimagerie de Recherche (CENIR), Centre de Recherche de l'Institut du Cerveau et de la Moelle épinière (CRICM), Université Pierre et Marie Curie-Paris 6 UMRS 975, Inserm U975, CNRS UMR 7225, Institut du cerveau et de la moëlle épinière (ICM), Paris 75013, France
a b s t r a c t
a r t i c l e i n f o
Article history:
Received 15 June 2015
Received in revised form 12 November 2015 Accepted 14 November 2015
Available online 17 November 2015
Multivariate pattern analysis (MVPA) has been applied successfully to task-based and resting-based fMRI record-ings to investigate which neural markers distinguish individuals with autistic spectrum disorders (ASD) from controls. While most studies have focused on brain connectivity during resting state episodes and regions of in-terest approaches (ROI), a wealth of task-based fMRI datasets have been acquired in these populations in the last decade. This calls for techniques that can leverage information not only from a single dataset, but from several existing datasets that might share some common features and biomarkers. We propose a fully data-driven (voxel-based) approach that we apply to two different fMRI experiments with social stimuli (faces and bodies). The method, based on Support Vector Machines (SVMs) and Recursive Feature Elimination (RFE), isfirst trained for each experiment independently and each output is then combined to obtain afinal classification output. Sec-ond, this RFE output is used to determine which voxels are most often selected for classification to generate maps of significant discriminative activity. Finally, to further explore the clinical validity of the approach, we correlate phenotypic information with obtained classifier scores. The results reveal good classification accuracy (range be-tween 69% and 92.3%). Moreover, we were able to identify discriminative activity patterns pertaining to the social brain without relying on a priori ROI definitions. Finally, social motivation was the only dimension which corre-lated with classifier scores, suggesting that it is the main dimension captured by the classifiers. Altogether, we believe that the present RFE method proves to be efficient and may help identifying relevant biomarkers by tak-ing advantage of acquired task-based fMRI datasets in psychiatric populations.
© 2015 The Authors. Published by Elsevier Inc. This is an open access article under the CC BY-NC-ND license (http://creativecommons.org/licenses/by-nc-nd/4.0/). Keywords:
fMRI
Autistic spectrum disorder Diagnosis
Pattern classification SVM
Recursive Feature Elimination Emotion
Anger Face perception Body perception
1. Introduction
Identifying biomarkers in psychiatry is a challenge that has been the focus of intense research in the past decade. Multiple approaches have been used to overcome this challenge, including attempts to identify biomarkers in genetics, metabolism or neuroimaging (Goldani et al., 2014). As far as functional neuroimaging (fMRI) is concerned, the recent development of multivariate pattern classification (MVPA) methods to brain imaging data appears to be a promising approach (Ecker and Murphy, 2014). One of the main advantages of these methods is that in-formation sensitivity is much higher compared to the standard
univariate approaches routinely used in neuroscience. Specifically, ma-chine learning makes it possible to retrieve patterns of information within populations of voxels, that univariate analyses may fail to reveal (Haxby et al., 2001, 2014). Applied to psychiatry, MVPA is a promising method to detect brain states that discriminate patients from controls and thus constitutes a valuable tool to identify potential biomarkers (Mourão-Miranda et al., 2005; Pereira et al., 2009). In recent years, MVPA has indeed successfully been used on fMRI data to classify pa-tients with major depression (Fu et al., 2008) or drug addiction (Zhang et al., 2011) with accuracy rates ranging from 70% to 80%.
However, given the wealth of existing fMRI datasets collected in psy-chiatry research, there is a need for techniques that can go beyond the analysis of single datasets and that allow researchers to leverage infor-mation from multiple datasets at once. Such methods would increase biomarker sensitivity and allow us to make the most of existing data.
⁎ Corresponding author at: Campus Biotech, CISA, University of Geneva, Case Postale 60, 1211 Geneva 20, Switzerland.
E-mail address:[email protected](G. Chanel).
http://dx.doi.org/10.1016/j.nicl.2015.11.010
2213-1582/© 2015 The Authors. Published by Elsevier Inc. This is an open access article under the CC BY-NC-ND license (http://creativecommons.org/licenses/by-nc-nd/4.0/).
Contents lists available atScienceDirect
NeuroImage: Clinical
While there are obvious benefits in reanalyzing large datasets, the ab-sence of efficient methods to merge information across datasets makes the process quite labor-intensive. Existing methods such as non-parametric permutation tests (Nichols and Holmes, 2001) and searchlight methods (Kriegeskorte et al., 2006) cannot be directly ap-plied to mine information from several experiments, or when the as-sumption of sample independence does not hold.
This rationale applies particularly well to Autism Spectrum Disor-ders (ASD), where large corpuses of brain data have been collected and, for a good fraction of them, made publicly available. Autism is a neurodevelopmental disorder characterized by a unique profile of im-paired social interaction and communication which takes the form of an inadequate appreciation and modulation of behavior according to socio-emotional information (World Health Organization, 1992). ASD individuals display hypo-connectivity in brain networks engaged dur-ing rest (Kennedy et al., 2006) and aberrant activity in several nodes of the“social brain”(i.e. fusiform gyrus, superior temporal sulcus and amygdala) while they process social or emotional information (Dichter, 2012; Pelphrey et al., 2004).
To date, most ASD fMRI classification studies have used resting-state functional connectivity patterns (Anderson et al., 2011; Deshpande et al., 2013; Iidaka, 2014; Murdaugh et al., 2012; Zhou et al., 2014) and only two have applied task-based paradigms that tap into ASD core social and emotional deficits (Coutanche et al., 2011; Deshpande et al., 2013). Using a limited set of a priori regions of interest (ROI) pertaining to the so-cial brain, both studies showed hypo-connectivity and hypo-activation in regions involved in face processing or theory of mind, functions that are indeed atypical in ASD participants. While restricting classification to a limited set of ROI is a laudable conservative approach, combining infor-mation from multiple fMRI datasets may help to improve the detection reliability of relevant biomarkers, in particular those having a small spatial extent. This goal requires a data-driven approach that can mine informa-tion from the entire brain at the voxel-wise level.
The goal of this paper is to propose a multivariate method that can combine information from several studies to detect activity patterns at the voxel-wise level which are significantly predictive of autism. We used data from two distinct experiments acquired in the same group of ASD and control participants. As in Coutanche et al.'s study (Coutanche et al., 2011), the tasks we used were initially designed for univariate analysis and were not planned with MVPA in mind. Both tasks required to process emotional stimuli under different conditions of social relevance or feature-based attention: thefirst experiment in-vestigated the perception of angry or neutral faces with direct or averted gaze (adapted fromConty et al., 2012); the second experiment required participants to direct attention to or away from angry and neu-tral body expressions (adapted fromPichon et al., 2012). We report two analyses on these datasets. In Analysis 1, we estimated the classifier's ability to discriminate patients from controls after training the classifier on both studies. In Analysis 2, we extended this diagnosis-based ap-proach to assess whether this classifier is correlated with individual dif-ferences in social motivation, a dimension of behavior that likely plays an important role in social deficits observed in ASD. Moreover, given that recent studies have raised the concern that head motion may intro-duce spurious biases in classification problems (Deen and Pelphrey, 2012; Power et al., 2012), we compared the results of our classifiers after regressing out 6 motion parameters (x, y, z, pitch, yaw, roll), which is still one standard practice in thefield of BOLD imaging, with a more stringent method which includes 24 motion parameters that has been used elsewhere (Power et al., 2014; Satterthwaite et al., 2013).
2. General method
2.1. Participants
All participants gave their informed written consent and the study was conducted in accordance with the Declaration of Helsinki and the
local Ethics Committee. The sample comprised 29 adults, 15 with ASD and 14 Typically Developing (TD) subjects. All ASD participants had re-ceived a formal diagnosis of an ASD by licensed psychologists or psychi-atrists according to standard diagnostic criteria (American Psychiatric Association, 2000) and using module 4 from the Autism Diagnostic Ob-servational Schedule (ADOS,Lord et al., 2000). Participants were matched on age and IQ (Table 1). As it is often the case, participants in the ASD group had higher trait anxiety scores than controls. This poten-tial confound was taken into account in our analyses by ensuring that classification scores were uncorrelated to anxiety scores.
2.2. Experimental procedures
2.2.1. The static faces task (Experiment 1)
This experiment aimed at addressing whether ASD participants au-tomatically process anger expressions directed at themselves (com-pared to averted expressions) as self-relevant communicative signals. It was adapted from a previous study (Conty et al., 2012) and crossed two factors: gaze direction and emotion (see below). Participant's task was to press a button whenever a face was presented upside down. This oddball paradigm has the advantage of leaving the trials of interest uncontaminated by motor responses.
We used color pictures of 10 actors (5 males) for which we manipu-lated two factors: 1) gaze direction (direct gaze condition: head, eye-gaze directed toward the participant; averted eye-gaze condition: head, eye-gaze averted by 30°; and 2) emotional expression (angry or neu-tral). An additional picture was taken of each actor, with a neutral ex-pression, arms by their sides with an intermediate eye direction of 15°. This position is thereafter referred to as the“initial position”. The full description of the stimuli can be found inConty et al. (2012). In the scanner, each trial began by a uniform gray screen (800 ms) follow-ed by afixation area (500 ms) consisting of a central redfixation point and four red angles. We instructed participants tofixate the central point and to keep their attention inside thefixation area at the level of the central point. An apparent movement was then created by the con-secutive presentation of two pictures. Thefirst picture showed the actor in the initial position during a random time (mean duration = 450 ms, range 300–600 ms) and was immediately followed by a second picture of the same actor in one of the 4 conditions of interest (Fig. 1A.). This second stimulus remained on the screen for 1300 ms. A total of 230 tri-als were presented including, in addition to the 160 tritri-als of interest (10 actors∗4 conditions∗2 directions∗2 repetitions), 20 oddballs (the sec-ond picture is upside-down) and 50 null events (mean duration = 3050 ms).
2.2.2. The dynamic bodies attention task (Experiment 2)
This experiment aimed at drawing attention toward or diverting at-tention from the emotional meaning of movie-clips depicting angry, fear and neutral body actions. It was adapted from a previous study (Pichon et al., 2012) and crossed two factors: attention (to emotion stimuli/to color dots) and emotion (anger/fear/neutral). Attention was manipulated using instruction screens and alternated every six trials. During the emotion-naming instruction, subjects were asked to judge whether the action expressed anger, fear or was neutral. During the color-naming instruction, subjects viewed the same video-clips but were requested to detect the color of a small dot (red, green, blue, visual angle = 0.3°) that was brieflyflashed during 40 ms. To minimize shifts in spatial attention between tasks, the location of the color dot was care-fully chosen so that it always fell on the actor's upper body. Colors were randomized across emotional expressions and appeared in both tasks. The experiment was divided into two successive scanning runs of 21 min each. Within each run, stimuli were blocked by task and blocks alternated between series of attention to emotion or attention to color conditions. Each block contained 6 trials (including 5-seconds null events). A total of 36 blocks per attention condition was presented (142 video-clips + 74 null events per task). At the beginning of each
block, subjects were instructed by a text on the screen lasting 2 s wheth-er they had to recognize emotions or detect colors. Stimuli and null events were randomly mixed within blocks. After each stimulus presen-tation, subjects were instructed by a response screen (fear/anger/neu-tral or red/green/blue) to push the corresponding button using a response pad placed in their right hand. Subjects had a delay of 2 s to
give their answer. The order of response options on the screen was ran-domized between trials to avoid motor anticipation related effects.
We used 73 movie-clips (24 anger, 23 fear and 24 neutral) with a length of 3 s for the present experiment. The full description and valida-tion of this set of stimuli can be found in previous studies (Pichon et al., 2008, 2009, 2012). Briefly, actions were performed by professional ac-tors who werefilmed opening a door while they enacted different sce-narios corresponding to angry, fear or neutral situations. Actors were facing the camera and facial expressions were blurred at the post-processing stage such that only information from the body was avail-able. In the present manuscript, we only focused our analyses on anger and neutral stimuli, thus only the four conditions of interest of Ex-periment 2 are presented inFig. 1B.
2.3. fMRI data acquisition
For both experiments, gradient-echo T2*-weighted transverse echo-planar images (EPI) with BOLD contrast and a high-resolution T1-weighted anatomical image were acquired with a 3T. Each volume contained 40 axial slices (TR/TE/Flip angle = 2000 ms/27 ms/78°, resolution = 64 ∗ 64, voxels size 3∗3 mm with 3 mm thickness, Par-allel Acquisition Technique (PAT) factor 2). A shimming procedure min-imized inhomogeneity of the static magneticfield. Image acquisition started after the recording of three dummy volumes to avoid T1 satura-tion. For each subject and for each task, we collected 370 functional vol-umes. In addition, we collected a high-resolution T1-weighted anatomical image (TR/TI/TE/Flip angle = 2300 ms/ms/4.18 ms/9°, resolution = 256∗ 256 ∗ 64, voxels size 1 × 1 mm with 1 mm thick-ness, no IPAT acceleration, 176 sagittal slices).
2.3.1. Preprocessing of functional images
Image processing and analyses were carried out using SPM8 (Wellcome Dept. of Cognitive Neurology, London, UK). Functional im-ages were realigned to thefirst volume by rigid body transformation, corrected for time differences, spatially normalized to the standard Montreal Neurological Institute (MNI) EPI template, resampled to an isotropic voxel size of 2 mm, and spatially smoothed with an isotropic 8 mm full-width at half-maximum (FWHM) Gaussian kernel.
2.3.2. Subject-wise fMRI analysis
At the individual level, we performed standard analyses using the general linear model (GLM) in SPM8. Each task was modeled separately and included 4 conditions of interest as described above (exp. 1 crossed gaze orientation ∗ emotion and exp. 2 crossed attention ∗ emotion). For each condition, a covariate was calculated by convolving stick func-tions at the onset of stimulus presentation with the canonical hemody-namic response function (HRF). The length of each event encompassed the stimulation and thefixed response period (exp. 2 only). Estimation of models resulted in the calculation of a beta map for each experimen-tal condition (i.e. a toexperimen-tal of 8 beta maps/conditions per participant) that was used for classification.
Table 1
Participant variables employed for group-matching and ADOS data.
ASD (n = 15) Controls (n = 14) Group difference Mean SEM Range Mean SEM Range t-test p-Value
Age 28.6 1.87 19–43 31.6 2.61 19–53 .94 0.35 IQ 108.06 4.5 77–150 116.78 4.6 84–141 1.35 0.18 Handedness⁎ 3L/12R 4L/10R .29 0.59 Gender⁎ 13M/2F 12M/2F .006 0.94 ADOS total 10.3 2.46 5–15 ADOS communication 3.23 1.73 0–7 ADOS social interaction 7.07 0.95 5–8
⁎ Pearson Khi-2; SEM: standard error of the mean.
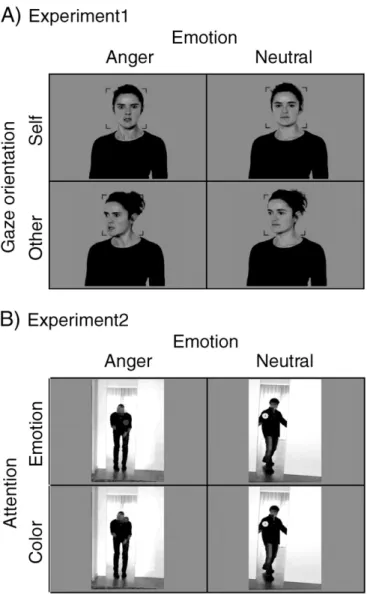
Fig. 1.The two paradigms and examples of stimuli. A) In Experiment 1 (static faces), par-ticipants observed angry or neutral facial expressions with direct or averted gaze. Partici-pants were instructed to observe each picture attentively and to press a button whenever they perceived an upside-down oddball picture (Conty et al., 2012). B) In Experiment 2 (dynamic bodies), participants observed short video-clips showing angry or neutral body expressions with a color-dot appearing briefly for 40 ms onto the actor's upper body. Depending on the instruction, subjects categorized the emotion or the color of the dot (Pichon et al., 2012).
2.3.3. Regression of motion parameters
We gave careful consideration to the issue of residual head motion-related artifacts which may contaminate results even after volume re-alignment and lead to spurious patterns biasing the classification. We regressed out the effect of head motion by including the realignment parameters estimated at the preprocessing stage in all GLM models. We compared the results of our classification using models which in-cluded twoflavors of motion parameters. In afirst set of models, we followed a standard procedure and included the 6 raw realignment pa-rameters (referred here as Rawrp6 models). In a second set of models (referred here as Friston24 models), we applied a more conservative method proposed by (Friston et al., 1996), which takes into account the participant's movement in the current but also in the previous scan and that has been used elsewhere (Power et al., 2014; Satterthwaite et al., 2013). The later method takes 24 motion regressors into consideration: the 6 raw realignment parameters, the same 6 re-gressors shifted-back by one time point to take into account the move-ment during the preceding scan (to capture a“memory”effect as in Volterra expansions), and each of the 12 regressors squared. We could have used other regression method, yet our goal was more to ensure that classification results remained high despite a more stringent con-trol of motion artifact, rather than investigating the influence of differ-ent motion correction methods on classification per se.
3. Analysis 1—classification of autistic individuals and controls
3.1. Method
Ourfirst goal was to train classifiers to discriminate patients from controls and to evaluate the classifier's performance. The proposed clas-sification method took into account the specificity of our dataset, which consists of non-uniformly distributed beta maps generated from differ-ent tasks and experimdiffer-ents. Secondly, feature selection was applied to improve classification performance and to identify the most discrimina-tive voxels across the two experiments.
We used the beta maps of each condition estimated at the individual step level as inputs for the classification to verify the hypothesis that fMRI brain activity discriminates ASD individuals from the controls. The space formed by the beta map voxels was directly used as the fea-ture space for classification, without including any prior information such as a priori ROIs. Hence, our classification method was fully data-driven and aimed tofind the most discriminative voxels. Indeed, using the information of the entire brain in an explorative approach may allow for: A) more accurate classification than restricting classification to a limited set of a priori regions; and B) identifying brain activity pat-terns which may not have been identified using a ROI approach, for in-stance because the discriminative activity would lie at the boundary of two ROIs.
Voxels that were not available due to brain volume differences be-tween participants were rejected, still leading to a high dimensional space represented by N = 186217 features (i.e. beta map voxels). Many machine learning algorithms are available and applicable to fMRI data (Pereira et al., 2009). We opted for a Support Vector Machine (SVM), as implemented in Matlab 2014a (The MathWorks Inc.), given its ability to perform well in high dimensional spaces (Bishop, 2006). Since the number of samples employed for training the SVM is rather low compared to the dimension of the feature space, the two classes are always separable by a linear hyperplane and employing non-linear decision boundaries is of limited interest. We used a linear SVM with a model of the form:
fð Þ ¼xi wTxiþb
wherexirepresent a feature vector (i.e. a 3D beta mapflattened into a vector). When minimizing its cost function to obtain the weightsw, the SVM relies on the parameterCthat adjusts the tradeoff between
misclassification and regularization. Following the advices inLaconte et al. (2005), regularization was achieved by setting theCparameter to 1. The classyiassociated to a given feature vectorxiis determined by the nature of the corresponding participant with:
yi¼ − 1 1
if the participant is a control if the participant is diagnosed with ASD:
It follows thatf(xi) will be negative (respectively positive) for sam-ples classified as controls (respectively ASD).
As for most classification methods, SVMs make the assumption that the input data is identically and independently distributed. In our case, the assumption of identically distributed data is violated since beta maps come from several experimental conditions which can activate different brain regions. For this reason a classifier was trained on the data of each condition independently (2 experiments∗4 conditions per experiment = 8 conditions) and the decisions of these classifiers were subsequently combined to obtain afinal decision for each partici-pant. This fusion of classifiers decisions was achieved by averaging the outputsf(xi) of each conditionibelonging to a given participantj, which gives afinal decision scorefðjÞ. For one participant where an ex-periment was missing, the decision was taken using the available condi-tions. The sign of fðjÞ then determined the class assigned to the participantj.
3.1.1. SVM training and leave-one-participant out cross-validation method This method was employed to test the performance of the classifi ca-tion method on unseen data. For each participant and each condica-tion, a classifier was trained using the data of all other participants (on the same condition); the obtained model was then applied on the beta map of the tested participant. As described above average fusion was performed to combine the models of both experiments and obtain a final decision per participant. Finally performance was computed. Two types of fusion were employed by combining different conditions to-gether to assess:
1. whether the combination of all models (i.e. both experiments) im-proved the classification accuracy; the performance obtained from combining the conditions of all experiments (i.e. 8 conditions in total) was compared with the performance obtained from combining the conditions separately for each experiment (i.e. 4 conditions per experiment);
2. whether models trained on emotional versus neutral information improved classification accuracy; the performance obtained from combining the conditions corresponding to angry expressions was compared with the performance obtained with combining the condi-tions corresponding to neutral expressions (independently of the ex-periment, 4 conditions in both cases).
The complete classification framework, in the case data from the two experiments was used, is depicted inFig. 2. Using this method, 8 classi-fiers were trained (4 conditions per experiment∗2 experiments) at each cross validation loop. Given the high accuracy variance of the leave-one-out validation method, a leave-pair-out cross-validation was also employed. As results from both methods were very similar, only the leave-one-out results are reported here. 3.1.2. Classification using SVM Recursive Feature Elimination
Although SVMs achieve good performance in high dimensional spaces, they can still benefit from feature selection methods. Therefore we employed a modified version of the SVM Recursive Feature Elimina-tion (SVM RFE) algorithm (Guyon et al., 2002) to restrain the classifi ca-tion to a subset of discriminant voxels. In SVM RFE the classification is first achieved on the whole set of features using a linear SVM classifier. The feature with the lowest weightwiis eliminated and the procedure is iterated on the remaining features up to the point where no feature
remains. The features are then ranked according to their order of elim-ination, thefirst eliminated feature being the worse. Because the num-ber of features is very high, we chose to speed up the RFE algorithm by removing 10% of the remaining features at each iteration. Hence, many features are rejected at thefirst iteration while during subsequent iterations, the algorithm rejects fewer and fewer features and becomes more and more specific in feature ranking. The value of 10% was chosen to obtain a reasonable processing time while trying to keep the number of rejected features low. Once features are ranked, it is possible to select the best (b⁎) features on the training set to perform the classification. The number b⁎was chosen by nested cross-validation (Fig. 2) among several possiblebivalues. For computational speed, thebinumbers were following the geometric progression defined below:
b0¼ N 2 bi¼ bi−1 2 8 > < > : i∈½0;11:
Thebi's were rounded to select an exact number of features. Using this method the number of selected features ranged fromb11= 45 to b0= 93109.
3.1.3. Classification performance
The classification performance was measured using accuracy (per-centage of correctly classified participants), sensitivity (i.e. recall) and specificity. The significance of the classification accuracy was tested using a binomial test with the null hypothesis that the class labels are estimated randomly and equiprobably. Given that Binomial tests can be too lenient when applied on small datasets (Noirhomme et al., 2014), we also performed permutation tests. The two tests were found to be very similar and only the Binomial tests are presented. 3.1.4. Visualization of the most discriminative voxels
After testing the classification performance, we sought to identify the most discriminative voxels across experiments to render them on a whole-brain anatomical volume. A possibility is to employ permuta-tion tests tofind which of the classifier weightsware significantly high or low. However this method is suboptimal because spatial corre-lation drives the weights of correlated (but discriminative) voxels to-ward zero (Pereira et al., 2009). This is particularly problematic for our data-driven approach considering all voxels of the brain volume.
Another solution could be to combine correlated voxels together using, for instance, a searchlight algorithm (Kriegeskorte et al., 2006). Here, we propose to perform the voxel analysis using the output of the previously described SVM RFE algorithm. The basic idea is that voxels which are often well ranked by SVM RFE are significantly dis-criminative, while those which are not well ranked or only occasionally well ranked are not very discriminative. As proposed inBreitling et al (2004), the rank product test can be used to determine which features (i.e. voxels) are better ranked than chance. When the number of fea-tures and the rank products are high, it is possible to use an accurate and cost effective approximation (gamma distribution based) of the rank product test (Eisinga et al., 2013; Koziol, 2010). Since we are deal-ing with N = 186217 voxels, this Gamma test was employed. As defined in Koziol (Koziol, 2010), the test consists of computing thezstatistic fromkrankings. Thezstatistic follows a Gamma distribution under the null hypothesis that the features are ranked equiprobably with:
z¼ −X k i¼1 log ri Nþ1 ZΓðk;1Þ ð2Þ
whereriis the rank of the tested feature for rankingi. It is necessary to generatekindependent rankings of voxels to apply the test. This was achieved by building a model for each condition. As described previous-ly, the SVM RFE algorithm was applied 8 times (one time per condition), each iteration generating a unique ranking of voxels. The Gamma test was then applied to sets of rankings tofind the most discriminative voxels. More precisely, this test was applied on the conditions of each experiment independently (k= 4) and on both experiments (k= 8) leading to the generation of 3 maps representing discriminative brain activities for Experiment 1, Experiment 2 and the fusion of the two ex-periments. Since the numberkof rankings can be different (4 or 8), we adjusted the Gamma test so that thezstatistics are comparable by replacing the sum in Eq.(2)by an average:
z0¼ − Xk i¼1log ri Nþ1 k Z0Γ k;1k :
Fig. 2.Classification and feature selection frameworks. Left) For each participant and each condition a classifier was trained using the data of the other participants (on the same condition). Next, the outputs of the classifiers were averaged across conditions and afinal decision was taken for each participant based on the sign of the average classification score. Right) Cross-validated feature selection was applied to select the most discriminative features and tofind discriminative patterns of brain activity.
This method allowsfinding voxels which are discriminative among all conditions and experiments by selecting voxels wherepðZ0≥z0Þbα
N. In our studyαwas set to 0.05. Note that the proposed modification does not change the statistical significance of the test since p(Z′≥z') =p(Z≥z).
However, the proposed test is not informative of the direction of the effect. To circumvent this issue, we retrieved voxels' weight signs by training a unique SVM model on the full dataset and we displayed in Fig. 3thezstatistics (which are always positive) multiplied by the sign of the associated weights to visualize the main direction of the ef-fect. Anatomical labeling was performed with reference to the anatomy toolbox (Eickhoff et al., 2005). Coordinates of homologue regions in both hemispheres were pooled together inTable 4when distance was less than 10 mm. Rendering was made using MRIcron (Rorden et al., 2007) and the standard Colin brain available in SPM8.
3.2. Results
3.2.1. Classification accuracy
The accuracy, sensitivity and specificity of the different classification methods and movement correction are reported inTable 2. For better readability, sensitivity and specificity are reported only for the SVM RFE feature selection algorithm, which performed best in most cases.
When both experiments were considered together for classification, and no feature selection was applied, the Friston24 motion correction method reached a better performance than the Rawrp6 method (Friston24: 82.8%, Rawrp6: 72.4%). This suggests that regressing out re-sidual motion helps improving the classification. When applying feature selection (RFE), the accuracy remained relatively unchanged for the Friston24 method but improved considerably for the Rawrp6 method (Friston24: 79.3%, Rawrp6: 89.7%). While specificity (true negative Fig. 3.Visualization of the most discriminative voxels. These voxels were found in regions related to social cognition and consistently showed reduced contribution in ASD participants compared to controls. Overall, the fusion of both experiments increased the size of the largest significant clusters while smaller clusters disappeared. Results were corrected for multiple comparisons (FWE pb0.05).
rate) was equivalent for both methods (80%), sensitivity (true positive rate) was much higher in the Rawrp6 method than in the Friston24 method (100% versus 78.6%), possibly because of the influence of resid-ual motion artifacts that were less well accounted for by the Rawrp6 method than by the Friston24 method.
When experiments were considered separately, the best accuracy was achieved with Experiment 2 (performance: 92.3%, sensitivity: 92.3%, specificity: 92.3%) which manipulated attention toward or away from emotional bodily actions. In conclusion, these results con-firmed that potential residual motion in the signal has a relatively low but non-null influence on classification and indicates that the Friston24 correction method helps to reduce spurious classification linked to re-sidual head-motion. Moreover, our results indicate that there seems to be an advantage of using SVM RFE to increase classification accuracy (mostly for the Rawrp6 models) since performance improved in 4 anal-yses (out of 6), was left unchanged in 1 analysis, and marginally de-creased in 1 analysis. This also demonstrates that brain activity was discriminative in all experiments, despite the explorative method we employed.
To ensure that RFE and fusion are not selecting features related to movement, we computed correlations between the continuous output of classifiers and 13 motion parameters. Importantly, we observed no correlations for the fusion of both experiments after Friston24 motion correction and/or the application of RFE feature selection (all pN0.05 uncorrected). Furthermore, the RFE algorithm helped reducing the in-fluence of motion on classifiers' output. For additional details, see Sup-plementary Fig. 1 and results.
Finally, since it has been proposed that ASD individuals have a spe-cific deficit in processing emotional cues, we tested whether or not clas-sification performed on“anger”conditions achieved a better accuracy than when it was performed on“neutral”conditions. To do so, we com-bined the classifier scores of the two experiments for anger and neutral conditions separately. Results indicate that accuracy for anger or neutral conditions was very similar with an average accuracy difference of 1.7% (Table 3). It is important to note, however, that the fact that
classification with emotional stimuli was only marginally better than the one with neutral stimuli does not necessarily mean that emotions are not beneficial to classification. The use of a diverse set of social stim-uli probably increases subjects' attention, which benefits to classifi ca-tion overall.
3.2.2. Visualization of the most discriminative voxels
The most discriminative voxels (seeFig. 3) across experiments were found in regions related to social cognition, namely regions involved in the processing of faces and bodies [FFA: fusiform face area, OFA: occip-ital face area, EBA: extrastriate body area—(Kanwisher et al., 1997; Puce et al., 1996), and STS: sulcus temporal superior—(Allison et al., 2000; Giese and Poggio, 2003; Pitcher, 2014)], active during mentalizing [TPJ: temporo-parietal junction and precuneus—(Castelli et al., 2000; Samson et al., 2004)] or during action and emotion perception [PM: premotor cortex—(Grèzes et al., 2007; Pichon et al., 2008, 2012)]. These regions consistently showed reduced contribution in ASD partic-ipants compared to controls. The fusion of both experiments dramati-cally increased the significance of discriminative features, which is probably due to the increased sample size with a stable effect size. The fusion of both experiments increased the number of significant discrim-inative voxels by roughly 50%, with 139 significant voxels for Experi-ment 1 (gaze), 219 for ExperiExperi-ment 2 (bodies) and 546 for the fusion of both experiments.
4. Analysis 2—dimensional approach
4.1. Methods
In analysis 1, we focused on the accuracy of the classifier to discrim-inate participants based on their diagnosis and we examined discrimi-native brain activity patterns between patients and controls. Thisfirst step was useful to compare the benefits of our cross-experiment MVPA methodology with classification performed on single tasks. How-ever, recent recommendations in psychiatry have emphasized the need to go beyond diagnostic boundaries and to adopt a more dimensional approach for afiner understanding of the neurobiological substrate of psychiatric conditions. The rationale is that until the formulation of clin-ical diagnosis is improved, research in neuroscience should focus on dis-crete dimensions of behavior which are likely to be more directly linkable to neurobiology (London, 2014). One promising dimension in the domain of ASD research is social motivation (Chevallier et al., 2012b). Social motivation can be described as a set of biological mecha-nisms driving individuals to preferentially orient their attention to the social world and to treat social interactions as rewarding. Social motiva-tion can be assessed using a number of tools including self-report ques-tionnaires (Eckblad et al., 1982). In analysis 2, we therefore departed from the standard diagnosis-based approach in order to assess whether the classification outputsfðjÞwere related to social anhedonia (SAS) and other personality or diagnostic measures. Since the classifiers were trained to distinguish participants with ASD from control partici-pants, we expected that correlations would be driven by mere group differences. Hence we used partial correlations to remove the group ef-fect. We computed additional correlations within each group whenever the partial correlation was marginally correlated (pb0.1).
4.1.1. Questionnaires
Participants completed the revised-Social Anhedonia Scale (Kosmadakis et al., 1995), which is a 40-item true/false scale commonly used to assess the ability to anticipate and experience interpersonal pleasure (e.g., being with people, talking, exchanging expressions of feelings, and doing things with others). High scores reflect diminished pleasurable responses, hence greater social anhedonia. We recently re-vealed selective social anhedonia (deficit in social desire and drive) in adolescents with ASD, with ASD severity (ADOS scores) correlating Table 2
Classification performance for the fusion of conditions belonging to each or both experiments. Fusion/experiment Motion correction Accuracy (%) Sensitivity (%) Specificity (%) SVMnoFS SVM RFEFS SVM RFEFS SVM RFEFS
Both experiments Rawrp6 72.4⁎ 89.7⁎⁎⁎ 100 80 Friston24 82.8⁎⁎⁎ 79.3⁎⁎ 78.6 80 Exp. 1 (faces) Rawrp6 62.1 69.0⁎ 71.4 66.7
Friston24 65.5† 69.0⁎ 57.2 80 Exp. 2 (bodies) Rawrp6 76.9⁎⁎ 92.3⁎⁎⁎ 92.3 92.3
Friston24 80.8⁎⁎ 80.8⁎⁎ 92.3 69.2
Significance values assessing that the classification achieved best than chance are indicated only for the accuracy columns (FS: features selection,†: pb 0.1, *: pb0.05, **: pb0.01, ***: pb0.001). Exp. 1 stands for the experiment where static faces were used. Exp. 2 stands for the experiment where dynamic bodies were used.
Table 3
Classification accuracy (%) after the fusion of either the Anger conditions or the Neutral conditions from both experiments.
Motion correction
Classification method
Accuracy (%) for anger conditions
Accuracy (%) for neutral conditions Rawrp6 SVMnoFS 69 75.9 Friston24 SVMnoFS 82.8 72.4 Rawrp6 SVM RFEFS 89.7 89.7 Friston24 SVM RFEFS 79.3 75.9 Mean accuracy (±STD) 80.2 (±8.6) 78.5 (±7.7)
The mean accuracy and standard deviation were computed across all movement correc-tion and classification methods.
positively with the level of social anhedonia (Chevallier et al., 2012a). In addition to the ADOS, autistic traits were assessed using the AQ ques-tionnaire (Baron-Cohen et al., 2001).
Participants alsofilled the STAI (form Y) questionnaire assessing state and trait anxiety (Spielberger et al., 1983). Indeed, anxiety is one of the most common psychiatric co-morbidities in ASD, with as many as 40–50% of individuals with ASD meeting conditions for clinical anxi-ety (Kerns et al., 2015). Since anxianxi-ety influences brain responses to emotional stimuli (Bishop, 2007; Pichon et al., 2015) and interferes with social motivation (Nettle and Bateson, 2012), we tested whether classification scores were related to inter-individual differences in anx-iety (seeTable 5).
4.2. Results
Given that the SVM RFE algorithm performed the best, we used its classification outputsf(j)to estimate correlations with questionnaires and ASD scores inTable 6. Afirst glance at the correlations shows that the Rawrp6 and Friston24 methods gave very similar results.
Interestingly, social anhedonia scores predicted classification scores in Experiment 2 (bodies) for the ASD group (r = 0.76, pb.01, seeFig. 4) and for all subjects after removing the effect of group (r = .56, pb.01). Importantly, neither trait (p = .09) nor state anxiety (p = .60) was re-lated to classification scores when considering both groups. Multiple re-gression confirmed that social anhedonia predicted classification scores in ASD participants (t(6) = 2.57, p = .04) while anxiety state (p = .31) or trait (p = .21), IQ (p = .32) and age (p = .13) were not significant. Our result supports the suggestion that social motivation is an impor-tant factor to consider in autism research (Chevallier et al., 2012b).
5. Discussion
The data-driven method proposed in this paper combines BOLD measures from two heterogeneous experiments in order to classify ASD subjects and controls without any prior information such as the definition of ROIs. The originality of our approach is that the discrimina-tive maps rely on feature selection rather than on the standard statisti-cal methods commonly used in multivariate fMRI analyses. An advantage of this approach is that the computed statistic is only based on the rank of the feature. Consequently this method can be employed to combine heterogeneous data sources such as different fMRI experi-ments, different BOLD-related signals (beta maps, functional connectiv-ity, etc.) or even different brain imaging modalities (i.e. structural MRI, voxel-based morphometry, functional MRI, and PET). The only require-ment is that the brain images should be co-registered and have the same spatial resolution, a constraint that can easily be achieved at the preprocessing stage using realignment and interpolation methods.
Importantly, we show that the usage of a more stringent motion cor-rection method than the classic inclusion of the 6 motion parameters in regression models helps to reduce potential residual influences of head motion on classification results. The use of SVM RFE improved classifi ca-tion accuracy for the Rawrp6 models, and this increase of performance was not due to motion artifacts since RFE reduced the correlation of classifiers' output with motion parameters observed in Experiment 1 (but not in Experiment 2 or after the fusion of both experiments). Taken together, these results hold the promise that the present method may become a valuable tool to help remove any potential residual infl u-ence of head movements in classification problems that involve com-paring ASD Subjects (and more generally patients) with controls. Table 4
Discriminative voxels across experiments using SVM RFE.
Both experiments Experiment 1 (faces) Experiment 2 (bodies) R/L Anatomical region MNI coordinates MNI coordinates MNI coordinates
x y z x y z x y z
TDNASD
R Premotor cortex 52 10 46
R Temporo-parietal junction (TPJ) 54 −36 24 R Supramarginal gyrus 68 −42 26
R & L Fusiform face area (FFA) ±44 −54 −16 ±39 −52 −23 L Superior temporal sulcus (STS) −54 −56 10
L Lingual gyrus −18 −58 0
L Superior parietal lobule (SPL) −16 −56 70
R & L Calcarine sulcus ±12 −68 16 ±14 −70 16
R Occipital face area (OFA) 44 −70 −4 44 −70 −2
R & L Extrastriate body area (EBA) −52 −72 6 −54 −68 14
R Precuneus 14 −72 62 14 −70 60
L Superior occipital gyrus −20 −76 38 −18 −78 −40
R Lunal gyrus 20 −80 −6
L Occipito-temporal face area (OFA) −42 −80 −6
L Middle/superior occipital gyrus −20 −82 16 −18 84 18 R & L Occipital pole ±18 −92 −8 ± 22 −95 −6
R & L Occipital pole ±32 −96 −10 30 −95 −7
ASDNTD
L Angular gyrus/inferior parietal lobule (IPL) −36 −70 40 −36 −70 38 R Angular gyrus/inferior parietal lobule (IPL) 48 −60 50 48 −62 52 L Posterior cingulate cortex (PCC) −14 −40 38 −16 −44 36
R Inferior temporal gyrus 64 −30 −18 52 −20 −26
R Middle temporal gyrus 64 −38 −10
Table 5
Participant scores for social anhedonia (SAS) and anxiety.
ASD (n = 15) TD (n = 14) Group difference
Mean SEM Range Mean SEM Range T (ASD vs TD) p-Value Social Anhedonia SAS 18.76 2.19 8–31 7.42 0.84 2–13 −5.39 b0.001 Anxiety (trait) 47.5 2.96 29–77 38 2.98 23–63 −2.2 b0.05 Anxiety (state) 36.3 2.69 20–51 32 2.48 20–52 −1.14 0.26
In the past few years, most fMRI classification studies relied on resting-state functional connectivity patterns and/or ROI analyses and reached categorization accuracy ranging from 79% to 96% (Anderson et al., 2011; Deshpande et al., 2013; Iidaka, 2014; Murdaugh et al., 2012; Wang et al., 2012; Zhou et al., 2014). Our method achieved accu-racies in a similar range (between 69% and 92.3%) than the studies above relying on resting state connectivity measures. Note that even though RFE was not associated with obvious gains in all conditions, the best accuracy was obtained with this method (92.3%). These results are all the more encouraging that we faced a number of methodological challenges: 1) we relied on tasks that were not designed with multivar-iate pattern analysis in mind; 2) the samples we classified did not have
the same distribution (i.e. they derived from different tasks and exper-iments); 3) we relied on relatively small samples lying in a highly di-mensional space, which might have raised a curse of didi-mensionality issue. In response to this last challenge, our results indicate that feature selection with SVM RFE reduces the impact of the curse of dimensional-ity by selecting discriminant subsets of voxels. In response to the second challenge, the proposed fusion approach allowed to build a model for each task and condition thus solving the problem of non-identically dis-tributed samples. Taken together, the present study confirms that clas-sifiers can be successfully applied to mine information from multiple BOLD datasets without relying on a priori ROIs and even if they are not originally designed for multivariate pattern analysis.
Our second goal was to evaluate whether the fusion of heteroge-neous data sources improved classification performance and revealed new additional topological information. We found that accuracy remained approximately the same when fusing the classifier outputs of our two experiments. However, the fusion method revealed 50% more significant voxels compared to the method taking each experi-ment separately. Specifically, the fusion led to an increase in the size of the largest significant clusters and to a disappearance of the smallest clusters. This suggests that the fusion method favors the selection of dis-criminative features that are common across experiments and validates the proposed method. Identified areas were astonishingly consistent with brain regions of the“social-brain”known to show aberrant func-tioning in ASD (Castelli et al., 2002; Pierce et al., 2004; Schultz, 2005; Zilbovicius et al., 2006). More specifically, we found a hypo-contribution of the fusiform gyrus and the occipital face area (OFA), which are both involved in face perception (Kanwisher et al., 1997; Puce et al., 1996); of the posterior STS, which plays a role in processing gaze direction (Allison et al., 2000), emotional displays (Pitcher, 2014) and biological motion (Giese and Poggio, 2003); and of the TPJ which is part of the mental state attribution network (Castelli et al., 2000; Samson et al., 2004).
Finally, to explore the clinical validity of our classifiers, we correlated classifier scores and phenotypic information. We focused on social mo-tivation deficits, which are arguably an important dimension of the ASD phenotype and found that the classifier scores of the fusion method cor-related with social motivation scores. In contrast to this dimensional ap-proach past studies have often focused on overall diagnosis.Anderson et al., (2011)andCoutanche et al (2011), for instance, found that their classifier scores correlated with ADOS total scores. Similarly, Deshpande et al. (2013)found that top rank features of connectivity measures were positively correlated with autistic traits' scores (AQ). In line with the RDoC framework (NIMH Research Domain Criteria), we would like to highlight that looking at relevant dimensions of behav-ior instead of overall diagnosis is a promising approach to understand the biological roots of ASD and, ultimately, to identify biomarkers.
In conclusion, the present study indicates that RFE is an interesting method to leverage information from several datasets and explore po-tential brain atypicalities in ASD or other psychiatric conditions (e.g. de-pression). In this paper, social brain areas were identified as most discriminative. Thisfinding, however, is only afirst step in the identifi -cation of potential biomarkers:first, our sample size was relatively Table 6
Pearson r values for partial correlations (both) and correlation in each group (ASD and TD) between the averaged SVM outputs (with SVM RFE feature selection) and scores from scales. Rawrp Social anhedonia (SAS) Autism quotient (AQ) Anxiety (trait)
Both ASD TD Both ASD TD Both ASD TD
Both exp Rawrp6 0.3 – – .36† 0.46† 0.14 0.15 – –
Friston24 .32† 0.29 .49† .33† 0.45 0.14 0.11 – –
Exp. 1 (gaze) Rawrp6 0.15 – – .38† 0.35 .46† 0.2 – –
Friston24 0.01 – – 0.23 – – 0.14 – –
Exp. 2 (bodies) Rawrp6 .50⁎ .65⁎ 0.05 0.28 – – 0.15 – –
Friston24 .56⁎⁎ .76⁎⁎ 0.14 0.3 – – 0.11 – –
The“Both”column indicates that a partial correlation was employed to remove the effect of group. The columns ASD and TD refer to the correlations performed in either group (†: pb= 0.1, *: pb0.05, **: pb 0.01, Two-tailed positive Pearson correlation). Correlations within each group were further computed when the partial correlation approached significance (pb0.1).
Fig. 4.Correlations for Experiment 2 (bodies) for which classification scores best predicted social anhedonia in the ASD group. Anxiety scores were unrelated to classification scores (we used classification scores from the SVM RFE feature selection and the Friston24 move-ment correction methods).
limited, which prevents us from grasping the heterogeneity that is so characteristic of ASDs; second, and perhaps more importantly, we only compared participants with ASD to typically developing controls, which means that we cannot know whether the discriminative brain pattern we identified is specific to ASD. These cautionary notes have been underlined recently and suggest that“we must be patient when searching for an autism biomarker” (Goldani et al., 2014; Tager-Flusberg, 2014).
Contributors
Study conception and design: Sylvie Berthoz, Coralie Chevallier, Lau-rence Conty, Julie Grèzes, and Swann Pichon.
Acquisition of data: Sylvie Berthoz, Coralie Chevallier, and Julie Grèzes.
Analysis and interpretation of data: Guillaume Chanel, Coralie Chevallier, Julie Grèzes, and Swann Pichon.
Drafting of manuscript: Guillaume Chanel, Coralie Chevallier, Julie Grèzes, and Swann Pichon.
Critical revision: All authors.
Acknowledgments
The authors would like to acknowledge Prof. Dimitri Van De Ville and Dr. Djalel Eddine Meskaldji for their helpful comments and insight-ful suggestions on some of the methodological aspects of this work. This work was supported by grants from the French National Research Agen-cy ANR-11-EMCO-00902, ANR-11-0001-02 PSL*, ANR-10-LABX-0087, by the Fondation ROGER DE SPOELBERCH, Fondation pour la Recherche Psychiatrie & Santé Mentale and by INSERM. Guillaume Chanel is sup-ported by the National Center of Competence in Research (NCCR) Affec-tive sciencesfinanced by the Swiss National Science Foundation (no. 51NF40_104897) and hosted by the University of Geneva. Swann Pichon is supported by an Ambizione starting grant of the Swiss Nation-al Science Foundation (no. PZ00P1_148035).
Appendix A. Supplementary data
Supplementary data to this article can be found online athttp://dx. doi.org/10.1016/j.nicl.2015.11.010.
References
Allison, T., Puce, A., McCarthy, G., 2000.Social perception from visual cues: role of the STS region. Trends Cogn. Sci. 4, 267–278.
American Psychiatric Association, 2000.Diagnostic and Statistical Manual of Mental Dis-orders DSM-IV-TR Fourth Edition, Diagnostic and Statistical Manual of Mental Disor-ders. 4th edition. (TR).
Anderson, J.S., Nielsen, J.A., Froehlich, A.L., DuBray, M.B., Druzgal, T.J., Cariello, A.N., Cooperrider, J.R., Zielinski, B.A., Ravichandran, C., Fletcher, P.T., Alexander, A.L., Bigler, E.D., Lange, N., Lainhart, J.E., 2011. Functional connectivity magnetic resonance imaging classification of autism. Brain 134, 3742–3754.http://dx.doi.org/10.1093/ brain/awr263.
Baron-Cohen, S., Wheelwright, S., Skinner, R., Martin, J., Clubley, E., 2001.The autism-spectrum quotient (AQ): evidence from Asperger syndrome/high-functioning au-tism, males and females, scientists and mathematicians. J. Autism Dev. Disord. 31, 5–17.
Bishop, C.M., 2006.Pattern Recognition and Machine Learning. Springer.
Bishop, S.J., 2007. Neurocognitive mechanisms of anxiety: an integrative account. Trends Cogn. Sci. 11, 307–316.http://dx.doi.org/10.1016/j.tics.2007.05.008.
Breitling, R., Armengaud, P., Amtmann, A., Herzyk, P., 2004. Rank products: a simple, yet powerful, new method to detect differentially regulated genes in replicated microarray experiments. FEBS Lett. 573, 83–92.http://dx.doi.org/10.1016/j.febslet.2004.07.055. Castelli, F., Happe, F., Frith, U., Frith, C.D., 2000.Movement and mind: a functional imaging
study of perception and interpretation of complex intentional movement patterns. Neuroimage 12, 314–325.
Castelli, F., Frith, C., Happe, F., Frith, U., 2002.Autism, Asperger syndrome and brain mech-anisms for the attribution of mental states to animated shapes. Brain 125, 1839–1849.
Chevallier, C., Grèzes, J., Molesworth, C., Berthoz, S., Happé, F., 2012a. Brief report: selec-tive social anhedonia in high functioning autism. J. Autism Dev. Disord. 42, 1504–1509.http://dx.doi.org/10.1007/s10803-011-1364-0.
Chevallier, C., Kohls, G., Troiani, V., Brodkin, E.S., Schultz, R.T., 2012b. The social motivation theory of autism. Trends Cogn. Sci. 16, 231–239.http://dx.doi.org/10.1016/j.tics.2012. 02.007.
Conty, L., Dezecache, G., Hugueville, L., Grezes, J., 2012.Early Binding of Gaze, Gesture, and Emotion: Neural Time Course and Correlates. J. Neurosci.
Coutanche, M.N., Thompson-Schill, S.L., Schultz, R.T., 2011. Multi-voxel pattern analysis of fMRI data predicts clinical symptom severity. Neuroimage 57, 113–123.http://dx.doi. org/10.1016/j.neuroimage.2011.04.016.
Deen, B., Pelphrey, K., 2012.Perspective: brain scans need a rethink. Nature 491, S20.
Deshpande, G., Libero, L.E., Sreenivasan, K.R., Deshpande, H.D., Kana, R.K., 2013. Identifi ca-tion of neural connectivity signatures of autism using machine learning. Front. Hum. Neurosci. 7, 670.http://dx.doi.org/10.3389/fnhum.2013.00670.
Dichter, G.S., 2012.Functional magnetic resonance imaging of autism spectrum disorders. Dialogues Clin. Neurosci. 14, 319–351.
Eckblad, M.L., Chapman, L.J., Chapman, J.P., Mishlove, M., 1982.The Revised Social Anhe-donia Scale: University of Wisconsin. Dep. Psychol. Unpubl. test, Madison.
Ecker, C., Murphy, D., 2014. Neuroimaging in autism—from basic science to translational research. Nat. Rev. Neurol. 10, 82–91.http://dx.doi.org/10.1038/nrneurol.2013.276. Eickhoff, S.B., Stephan, K.E., Mohlberg, H., Grefkes, C., Fink, G.R., Amunts, K., Zilles, K., 2005.
A new SPM toolbox for combining probabilistic cytoarchitectonic maps and function-al imaging data. Neuroimage 25, 1325–1335.
Eisinga, R., Breitling, R., Heskes, T., 2013. The exact probability distribution of the rank product statistics for replicated experiments. FEBS Lett. 587, 677–682.http://dx.doi. org/10.1016/j.febslet.2013.01.037.
Friston, K.J., Williams, S., Howard, R., Frackowiak, R.S., Turner, R., 1996.Movement-related effects in fMRI time-series. Magn. Reson. Med. 35, 346–355.
Fu, C.H.Y., Mourao-Miranda, J., Costafreda, S.G., Khanna, A., Marquand, A.F., Williams, S.C.R., Brammer, M.J., 2008. Pattern classification of sad facial processing: toward the development of neurobiological markers in depression. Biol. Psychiatry 63, 656–662.http://dx.doi.org/10.1016/j.biopsych.2007.08.020.
Giese, M.A., Poggio, T., 2003.Neural mechanisms for the recognition of biological move-ments. Nat. Rev. Neurosci. 4, 179–192.
Goldani, A.A.S., Downs, S.R., Widjaja, F., Lawton, B., Hendren, R.L., 2014. Biomarkers in au-tism. Front. Psychiatry 5, 100.http://dx.doi.org/10.3389/fpsyt.2014.00100. Grèzes, J., Pichon, S., de Gelder, B., 2007.Perceiving fear in dynamic body expressions.
Neuroimage 35, 959–967.
Guyon, I., Weston, J., Barnhill, S., Vapnik, V., 2002. Gene selection for cancer classification using support vector machines. Mach. Learn. 46, 389–422.http://dx.doi.org/10.1023/ A:1012487302797.
Haxby, J.V., Gobbini, M.I., Furey, M.L., Ishai, A., Schouten, J.L., Pietrini, P., 2001.Distributed and overlapping representations of faces and objects in ventral temporal cortex. Sci-ence 293, 2425–2430 (80-.).
Haxby, J.V., Connolly, A.C., Guntupalli, J.S., 2014. Decoding neural representational spaces using multivariate pattern analysis. Annu. Rev. Neurosci. 37, 435–456.http://dx.doi. org/10.1146/annurev-neuro-062012-170325.
Iidaka, T., 2014. Resting state functional magnetic resonance imaging and neural network classified autism and control. Cortex 63C, 55–67.http://dx.doi.org/10.1016/j.cortex. 2014.08.011.
Kanwisher, N., McDermott, J., Chun, M.M., 1997.The fusiform face area: a module in human extrastriate cortex specialized for face perception. J. Neurosci. 17, 4302–4311.
Kennedy, D.P., Redcay, E., Courchesne, E., 2006. Failing to deactivate: resting functional abnormalities in autism. Proc. Natl. Acad. Sci. U. S. A. 103, 8275–8280.http://dx.doi. org/10.1073/pnas.0600674103.
Kerns, C.M., Kendall, P.C., Zickgraf, H., Franklin, M.E., Miller, J., Herrington, J., 2015. Not to be overshadowed or overlooked: functional impairments associated with comorbid anxiety disorders in youth with ASD. Behav. Ther. 46, 29–39.http://dx.doi.org/10. 1016/j.beth.2014.03.005.
Kosmadakis, C.S., Bungener, C., Pierson, A., Jouvent, R., Widlöcher, D., 1995.Translation and validation of the Revised Social Anhedonia Scale. Study of the internal and con-current validity in 126 normal subjects. Encéphale 21, 437–443.
Koziol, J.A., 2010. Comments on the rank product method for analyzing replicated experiments. FEBS Lett. 584, 941–944.http://dx.doi.org/10.1016/j.febslet.2010. 01.031.
Kriegeskorte, N., Goebel, R., Bandettini, P., 2006. Information-based functional brain map-ping. Proc. Natl. Acad. Sci. U. S. A. 103, 3863–3868.http://dx.doi.org/10.1073/pnas. 0600244103.
Laconte, S., Strother, S., Cherkassky, V., Anderson, J., Hu, X., 2005. Support vector machines for temporal classification of block design fMRI data. NeuroImage 26 (2), 317–329.
http://dx.doi.org/10.1016/j.neuroimage.2005.01.048.
London, E.B., 2014. Categorical diagnosis: a fatalflaw for autism research? Trends Neurosci. 37, 683–686.http://dx.doi.org/10.1016/j.tins.2014.10.003.
Lord, C., Risi, S., Lambrecht, L., Cook, E.H., Leventhal, B.L., DiLavore, P.C., Pickles, A., Rutter, M., 2000.The autism diagnostic observation schedule-generic: a standard measure of social and communication deficits associated with the spectrum of autism. J. Autism Dev. Disord. 30, 205–223.
Mourão-Miranda, J., Bokde, A.L.W., Born, C., Hampel, H., Stetter, M., 2005. Classifying brain states and determining the discriminating activation patterns: Support Vector Ma-chine on functional MRI data. Neuroimage 28, 980–995.http://dx.doi.org/10.1016/j. neuroimage.2005.06.070.
Murdaugh, D.L., Shinkareva, S.V., Deshpande, H.R., Wang, J., Pennick, M.R., Kana, R.K., 2012. Differential deactivation during mentalizing and classification of autism based on default mode network connectivity. PLoS One 7, e50064.http://dx.doi. org/10.1371/journal.pone.0050064.
Nettle, D., Bateson, M., 2012. The evolutionary origins of mood and its disorders. Curr. Biol. 22, R712–R721.http://dx.doi.org/10.1016/j.cub.2012.06.020.
Nichols, T.E., Holmes, A.P., 2001.Nonparametric Permutation Tests For Functional Neuro-imaging: A Primer with Examples. 25, 1–25.
Noirhomme, Q., Lesenfants, D., Gomez, F., Soddu, A., Schrouff, J., Garraux, G., Luxen, A., Phillips, C., Laureys, S., 2014. Biased binomial assessment of cross-validated estima-tion of classification accuracies illustrated in diagnosis predictions. NeuroImage Clin. 4, 687–694.http://dx.doi.org/10.1016/j.nicl.2014.04.004.
Pelphrey, K., Adolphs, R., Morris, J.P., 2004. Neuroanatomical substrates of social cognition dysfunction in autism. Ment. Retard. Dev. Disabil. Res. Rev. 10, 259–271.http://dx.doi. org/10.1002/mrdd.20040.
Pereira, F., Mitchell, T., Botvinick, M., 2009. Machine learning classifiers and fMRI: a tuto-rial overview. Neuroimage 45, S199–S209.http://dx.doi.org/10.1016/j.neuroimage. 2008.11.007.
Pichon, S., de Gelder, B., Grèzes, J., 2008. Emotional modulation of visual and motor areas by dynamic body expressions of anger. Soc. Neurosci. 3, 199–212.http://dx.doi.org/ 10.1080/17470910701394368.
Pichon, S., de Gelder, B., Grèzes, J., 2009.Two different faces of threat. Comparing the neu-ral systems for recognizing fear and anger in dynamic body expressions. Neuroimage 47, 1873–1883.
Pichon, S., de Gelder, B., Grèzes, J., 2012.Threat prompts defensive brain responses inde-pendently of attentional control. Cereb. Cortex 22, 274–285.
Pichon, S., Miendlarzewska, E., Eryilmaz, H., Vuilleumier, P., 2015. Cumulative activation during positive and negative events and state anxiety predicts subsequent inertia of amygdala reactivity. Soc. Cogn. Affect. Neurosci. 10, 180–190.http://dx.doi.org/10. 1093/scan/nsu044.
Pierce, K., Haist, F., Sedaghat, F., Courchesne, E., 2004. The brain response to personally fa-miliar faces in autism:findings of fusiform activity and beyond. Brain 127, 2703–2716.http://dx.doi.org/10.1093/brain/awh289.
Pitcher, D., 2014. Facial expression recognition takes longer in the posterior superior tem-poral sulcus than in the occipital face area. J. Neurosci. 34, 9173–9177.http://dx.doi. org/10.1523/JNEUROSCI.5038-13.2014.
Power, J.D., Barnes, K.A., Snyder, A.Z., Schlaggar, B.L., Petersen, S.E., 2012. Spurious but sys-tematic correlations in functional connectivity MRI networks arise from subject mo-tion. Neuroimage 59, 2142–2154.http://dx.doi.org/10.1016/j.neuroimage.2011.10. 018.
Power, J.D., Mitra, A., Laumann, T.O., Snyder, A.Z., Schlaggar, B.L., Petersen, S.E., 2014. Methods to detect, characterize, and remove motion artifact in resting state fMRI. Neuroimage 84, 320–341.http://dx.doi.org/10.1016/j.neuroimage.2013.08.048. Puce, A., Allison, T., Asgari, M., Gore, J.C., McCarthy, G., 1996.Differential sensitivity of
human visual cortex to faces, letterstrings, and textures: a functional magnetic reso-nance imaging study. J. Neurosci. 16, 5205–5215.
Rorden, C., Karnath, H.O., Bonilha, L., 2007. Improving lesion-symptom mapping. J. Cogn. Neurosci. 19, 1081–1088.http://dx.doi.org/10.1162/jocn.2007.19.7.1081.
Samson, D., Apperly, I.A., Chiavarino, C., Humphreys, G.W., 2004. Left temporoparietal junction is necessary for representing someone else's belief. Nat. Neurosci. 7, 499–500.http://dx.doi.org/10.1038/nn1223.
Satterthwaite, T.D., Elliott, M.A., Gerraty, R.T., Ruparel, K., Loughead, J., Calkins, M.E., Eickhoff, S.B., Hakonarson, H., Gur, R.C., Gur, R.E., Wolf, D.H., 2013. An improved framework for confound regression andfiltering for control of motion artifact in the preprocessing of resting-state functional connectivity data. Neuroimage 64, 240–256.http://dx.doi.org/10.1016/j.neuroimage.2012.08.052.
Schultz, R.T., 2005. Developmental deficits in social perception in autism: the role of the amygdala and fusiform face area. Int. J. Dev. Neurosci. 23, 125–141.http://dx.doi. org/10.1016/j.ijdevneu.2004.12.012.
Spielberger, C.D., Gorsuch, R.L., Lushene, R., Vagg, P.R., Jacobs, G.A., 1983.Manual for the State-Trait Anxiety Inventory. Consulting Psychologists Press, Inc., Palo Alto, CA.
Tager-Flusberg, H., 2014. Why we must be patient when searching for an autism biomarker [WWW Document] URL http://sfari.org/news-and-opinion/columnists/helen-tager-flusberg/2014/why-we-must-be-patient-when-searching-for-an-autism-biomarker
(accessed 5.6.15).
Wang, H., Chen, C., Fushing, H., 2012. Extracting multiscale pattern information of fMRI based functional brain connectivity with application on classification of autism spec-trum disorders. PLoS One 7, e45502. http://dx.doi.org/10.1371/journal.pone. 0045502.
World Health Organization, 1992. The ICD-10 classification of mental and behavioural disorders. Int. Classif. 10, 1–267.http://dx.doi.org/10.1002/1520-6505(2000)9: 5b201::AID-EVAN2N3.3.CO;2-P.
Zhang, Y., Tian, J., Yuan, K., Liu, P., Zhuo, L., Qin, W., Zhao, L., Liu, J., von Deneen, K.M., Klahr, N.J., Gold, M.S., Liu, Y., 2011. Distinct resting-state brain activities in heroin-dependent individuals. Brain Res. 1402, 46–53.http://dx.doi.org/10.1016/j.brainres. 2011.05.054.
Zhou, Y., Yu, F., Duong, T., 2014. Multiparametric MRI characterization and prediction in autism spectrum disorder using graph theory and machine learning. PLoS One 9, e90405.http://dx.doi.org/10.1371/journal.pone.0090405.
Zilbovicius, M., Meresse, I., Chabane, N., Brunelle, F., Samson, Y., Boddaert, N., 2006. Au-tism, the superior temporal sulcus and social perception. Trends Neurosci. 29, 359–366.http://dx.doi.org/10.1016/j.tins.2006.06.004.