Insurance Program Development for Poultry Business Interruption
Insurance Program Development
for Poultry Business Interruption
Order Number: D15PD00545
Submitted to:
USDA-RMA COTR: Jaime Padget
6501 Beacon Drive
Kansas City, Missouri 64133-4676 (816) 926-3466
Submitted by:
Watts and Associates, Inc. 4331 Hillcrest Road Billings, Montana 59101
(406) 252-7776
[email protected] Due Date: August 12, 2015
This document includes data that shall not be disclosed outside of the Government and shall not be duplicated, used, or disclosed, in whole or in part, for any purpose. The Government shall have the right to duplicate, use, or disclose the data to the extent provided in Order D15PD00545. All pages of this document are subject to this restriction.
Use or disclosure of information or data Risk Management Agency contained on this sheet is subject to the Order No: D15PD00545 restrictions on the title page of this report.
i
Table of Contents
Executive Summary ... 1
I. Insurance Product Description... 4
II. Marketing Environment ... 6
III. Statutory Authority Parameters... 31
IV. Data Collection and Pricing ... 34
V. Review of Other Programs ... 42
VI. Stakeholder Sessions ... 53
VII. Risk Analyses ... 55
VIII. Feasibility Recommendations ... 67
List of Tables Table 1. 2012 Top Ten Broiler Production States ... 8
Table 2. 2012 Top Ten Turkey Production States ... 8
Table 3. 2012 Top Ten Layer Production States ... 8
Table 4. Top Integrators ... 9
Table 5. Top Broiler Integrators, United States, Through July 2015 ... 11
Table 6. Economic Indicators–Broiler, United States ... 13
Table 7. Broiler Production by States, 2014 ... 14
Table 8. Top U.S. Turkey Processors in 2013 ... 18
Table 9. Geographic Distribution of 2014 Turkey Production in the United States... 19
Table 10. Economic Indicators – Turkeys, United States ... 20
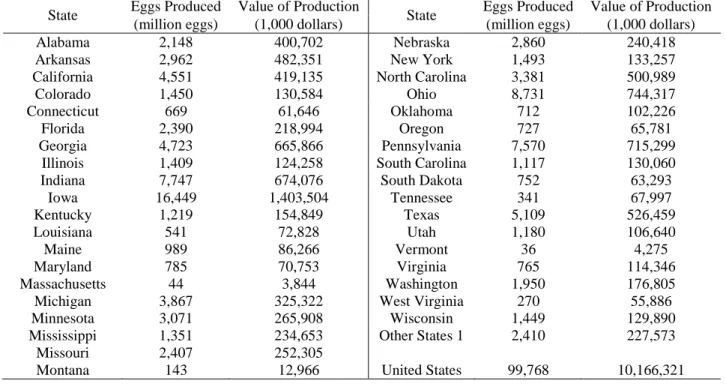
Table 11. 2014 United States Egg Production by State ... 24
Table 12. Economic Indicators – Layer Segment United States ... 25
Table 13. Top Ten Egg Production Companies: 2013 ... 26
Table 14. Top Ten States (in order of Value Sold): Number of Farms Reporting Layers 2012 Census of Agriculture ... 27
Table 15. Game Birds Reported in 2012 Census of Agriculture by Inventory... 30
Table 16. Census of Agriculture Poultry Species for which Data are Collected and Reported ... 36
Table 16. Historical Integrator Bankruptcies – 2009 - 2015 ... 66
List of Appendices
Appendix A. Grower/Integrator Contracts Appendix B. Stakeholder Input
Exhibit 1. Sample Listening Session Agenda Exhibit 2. Sample Press Release
Insurance Program Development for Poultry Business Interruption
Use or disclosure of information or data Risk Management Agency contained on this sheet is subject to the Contract No: D15PD00545 restrictions on the title page of this report.
1 EXECUTIVE SUMMARY
The Statement of Work (SOW) for Order Number D15PD00545 identifies the objectives of the project as “…to obtain information; provide analyses; and produce a data gathering report that may support developing an insurance program covering business interruptions incurred by poultry growers1 as a result of an integrator’s bankruptcy” and if feasible under a contract option to develop an insurance pilot program consistent with the requirements of the United States Department of Agriculture (USDA) Risk Management Agency (RMA).
The agricultural economy is structured such that certain crop production is carried out by growers. In the poultry industry, growers produce birds and/or eggs under contract with integrators2 in facilities3 the growers own. Growers and integrators, as defined in the contract, are distinguished in this report from owner/producers, who own poultry and grow birds or eggs for sale into markets for human consumption or for release into the wild.
Much of the poultry meat industry is vertically integrated. Integrators typically control feed supply, grow-out requirements, transportation, slaughter, processing, and wholesale distribution and may control brood egg production and hatching. The integrators consequently have
remarkable control of their products and vast market power relative to growers. There are many fewer growers in the layer and gamebird sectors than in the meat sectors.
Under the terms of the contract for this project4 and the enabling legislation5 for this study, the proposed insurance product would provide coverage for growers by paying an indemnity for a single cause of loss: the bankruptcy of the integrator. Insurance for business interruption is available for many businesses, including sectors of the poultry industry. The Contractor has identified insurance in the private sectors covering business interruption losses of a grower resulting from integrator bankruptcy. A determination would need to be made about whether this insurance is “generally available.”
The proprietary nature of poultry industry data, especially those data maintained by integrators has made it particularly difficult to obtain industry data about potential integrator bankruptcies. This proprietary nature extends to poultry industry contracts, which has made it difficult to obtain grower data. Such data are important for development of an actuarially-sound crop insurance product as well as appropriate measures of the potential liability under such products. Poultry industry data, including estimates derived by the USDA National Agricultural Statistics Service (NASS) from surveys, are available for the larger sectors of the industry: chickens
1
The contract on page 22 defines grower as: “Individual(s) who raise poultry under a production contract for an integrator.” For the purpose of this report, the term “growers” will be used to identify persons (in the legal sense) retained under contract by the owner of poultry or an agent of that owner to manage the growth of poultry for delivery of mature birds or eggs to the owner.
2
The contract on page 22 defines an integrator as: “An individual or company that owns poultry that is raised by a contracted grower/producer or that is involved with harvesting, processing and marketing goods from poultry (may include slaughter and processing).
3 Generally called houses. 4
USDA, RMA, 2015, SOW, Order Number D15PD00545, page 25 of 39, Section 2.2., Section 2.2. 5
75-30 - Agricultural Adjustment Act of 1938 & Federal Crop Insurance Act as amended through P.L. 113–79 enacted February 7, 2014, Subsection 522(c)(22)(C)(i) and (ii).
Use or disclosure of information or data Risk Management Agency contained on this sheet is subject to the Contract No: D15PD00545 restrictions on the title page of this report.
2
(including layers and the eggs they produce), ducks, and turkeys. Production data on other sectors of the poultry industry are geographically limited, sporadic, and in many cases anecdotal. Over the course of 6 telephone listening sessions, the Contractor gathered feedback from more than 50 stakeholders, although it is challenging to determine a precise number of participants on a telephone listening session. There were several common themes in the stakeholder feedback. Growers frequently have heavily leveraged operations and an integrator bankruptcy that results in the loss of even a single production cycle can cause bankruptcy. Growers are in fact interested in business interruption insurance and would like that insurance to be incorporated into the Federal Crop Insurance Corporation (FCIC) portfolio. However, the causes of loss for which growers expressed interest was catastrophic disease and the subsequent down times required to address the potential of contamination in their houses. Insurance for business interruption caused by integrator bankruptcy was not a topic growers considered vital to their management of risk. Consequently, if the FCIC were to add insurance for business interruption caused by integrator bankruptcy to its portfolio, the Contractor believes marketing the insurance would be unusually difficult when compared to other insurance products offered. Bankruptcy of the integrator is not the risk of greatest concern to these persons.6
Insurance for the interruption of a grower’s business caused by integrator bankruptcy does not meet all the FCIC insurance program criteria outlined by RMA in the Work Statement (SOW) for the contract.7 Substantial barriers would exist during a development effort in establishing acceptable risk as defined in the contract.8 In the whole Farm Revenue Protection (WFRP) program, the insurance precludes provision of insurance for rent and labor payments to growers because the authority for indemnities is limited to “… losses of the insured commodity…”9 Due to the sporadic nature of the proposed cause of loss, traditional quantitative rating
approaches would be ineffective and most likely rates would need to be established based on the financial condition and business plan of the integrator. The necessary data are considered proprietary. The lack of a market for the proposed insurance makes it particularly difficult to assure a development meet the FCIC insurance program criteria.
From RMA’s perspective, there are the fundamental questions regarding the insurability of the grower’s interest, and non-trivial questions regarding identification, measurement, and tracking of the value of a grower’s business. The two contracts the Contractor was able to obtain from the thousands that exist provides no basis for demonstrating the contract language would be sufficient for establishing an appropriate liability to be insured under a business interruption policy as described in the contract for this study. Furthermore, the existing reinsurance
agreements with Approved Insurance Providers (AIPs) may not be appropriate for an insurance program covering business interruptions incurred by poultry growers as a result of an integrator’s bankruptcy. However, an appropriate reinsurance agreement could no doubt be developed. In light of the many issues identified in this study, including the failure of the proposed insurance product for the poultry industry to meet the FCIC insurance program criteria, the Contractor
6
The term person is used in the context of the Common Crop Insurance Policy Basic Provisions: any entity with an insurable interest.
7
USDA, RMA, 2015, Op. cit., page 25 and 26 of 39. 8
Ibid., page 20 of 39. 9
Insurance Program Development for Poultry Business Interruption
Use or disclosure of information or data Risk Management Agency contained on this sheet is subject to the Contract No: D15PD00545 restrictions on the title page of this report.
3
believes it is not currently feasible to develop a FCIC insurance program covering business interruptions incurred by poultry growers as a result of an integrator’s bankruptcy.
Use or disclosure of information or data Risk Management Agency contained on this sheet is subject to the Contract No: D15PD00545 restrictions on the title page of this report.
4 I.INSURANCE PRODUCT DESCRIPTION
The SOW identifies the objectives of the contracted effort as “…to obtain information; provide analyses; and produce a data gathering report that may support developing an insurance program covering business interruptions incurred by poultry growers as a result of an integrator’s
bankruptcy.”10 To address this objective, the Contractor is required to provide a description of an insurance product covering business interruptions incurred by poultry growers with the sole insurable cause of loss being an integrator’s bankruptcy. Providing a policy11
is beyond the scope of this element of the contract. Product development is an option under the contract that has yet to be exercised the RMA on behalf of the FCIC.
The product description in this section of the report is intended to assist the reader in
understanding the logical construct of an insurance product within the FCIC portfolio covering a poultry grower’s losses resulting from business interruption caused by an integrator’s
bankruptcy. Details about poultry production and the prevalence of growers and integrators within poultry industry sectors are provided elsewhere in this report.
The FCIC “promotes the economic stability of agriculture through a sound system of crop insurance.”12
The Federal Crop Insurance Act (Act) establishes a Board of Directors to manage the FCIC subject to supervision by the Secretary of Agriculture. “The Board delegates to the manager of the FCIC (RMA Administrator) certain authorities and powers.”13
RMA “operates and manages the FCIC… Private-sector insurance companies sell and service the policies. RMA develops and/or approves the premium rates, administers premium and expense subsidies,
approves and supports products, and reinsures the companies.” 14
The Federal Crop Insurance Act15 provides the legislative authority for the Federal Crop Insurance program. The general administrative regulations of the FCIC are codified at 7 CFR Part 400. Crop is defined in the contract for this report as “An agricultural commodity insured under the authority of the [Crop Insurance] Act.”16 The FCIC portfolio covers a wide variety of crops and covers losses of production and, in some cases, of revenue.
The contract for this report provides essential definitions for a business interruption policy within the FCIC portfolio. A grower is defined as: “Individual(s) who raise poultry under a production contract for an integrator.”17 The contract defines producer using exactly the same language. Integrator is defined in the contract as: “An individual or company that owns poultry that is raised by a contracted grower/producer or that is involved with harvesting, processing and
10
USDA, RMA, 2015, SOW, Order Number D15PD00545, page 25 of 39. 11
A formal contract issued by an insurance company to an insured that identifies coverage limit, serves as legal evidence of the conditions of the insurance agreement, sets precise terms of the coverage provides, and states information such as the specific perils covered, duration of coverage, amount of premium, mode of payment, and deductibles/co-pay structure.
12
USDA, RMA, 2015, Federal Crop Insurance Corporation, http://www.rma.usda.gov/fcic/, accessed July 2015. 13
Ibid.
14 USDA, RMA, 2013, About the Risk Management Agency, http://www.rma.usda.gov/pubs/rme/aboutrma.pdf, accessed July 2015.
15 75-30 - Agricultural Adjustment Act Of 1938 & Federal Crop Insurance Act as amended through P.L. 113–79, enacted February 7, 2014, accessed July 2015.
16
USDA, RMA, 2015, SOW, Op. cit., page 21 of 39. 17
Insurance Program Development for Poultry Business Interruption
Use or disclosure of information or data Risk Management Agency contained on this sheet is subject to the Contract No: D15PD00545 restrictions on the title page of this report.
5
marketing goods from poultry (may include slaughter and processing).”18
The growers who raise poultry under a production contract for an integrator are the potential insureds.
The contract for this report does not define a production contract or bankruptcy. However, production contracts are defined in many FCIC policies. A typical definition for a production contract in a crop insurance policy includes the requirement the contract be a written agreement between the insured and the buyer, signed by both parties on or before the date specified in the crop insurance policy, containing at a minimum:
The insured’s commitment to grow the crop;
The buyer’s commitment to purchase all the production that meets the quality standards identified in the contract; and
Generally states there is a price for production, such as a fixed price, or a method to determine such price based on published information compiled by a third party, that will be paid to the insured for the production.
Generally, the requirement is that the contract be submitted on or before the acreage reporting date. Insurance attaches at “planting,” which in the case of poultry would likely be population of the house.
In the case of a poultry production contract, because there are such limited spot markets, the Contractor expects a FCIC product would require a poultry production contract to commit the buyer to a mechanism to determine the price at which all production meeting the quality standards identified in the contract will be purchased.
Mechanisms exist in existing policies to address cases where an owner/producer who is an integrator and processes its own production would fit the contract definition of grower. Similar terms could be drafted for a poultry policy.
Bankruptcy has a precise legal definition. It is a federally-authorized procedure by which a debtor, be it an individual, corporation, or municipality, is relieved of most liability for its debts by making court-approved arrangements for the partial repayment of those debts. Further discussion of bankruptcy is found in the risk management section.
The liability for the product would be the potential uncontrollable losses to the net income of the grower. While fixed costs would be included in calculation of the net income, variable costs that can be avoided would not. Indemnities would be calculated by loss adjustment procedures that determine both actual insurable losses to the grower’s net income and verify the cause of those losses was exclusively the bankruptcy of the integrator. If there were additional causes of loss, adjustments to the indemnities would reflect the impact of each cause on the loss, and only that portion of the loss that could be attributed to the integrator’s bankruptcy would be indemnified.
18
Use or disclosure of information or data Risk Management Agency contained on this sheet is subject to the Contract No: D15PD00545 restrictions on the title page of this report.
6 II.MARKETING ENVIRONMENT
The SOW requires the Contractor to describe how prices are impacted or how monetary changes occur in the poultry industry. Furthermore, the SOW instructs the Contractor to provide copies of entire contracts if prices are determined by contract and establish the insurable interest of the potential insured. Finally, the SOW instructs the Contractor to identify critical time periods impacting marketing in the poultry industry for a given region. The Contractor examined those aspects of the poultry industry directly impacted by the grower/integrator relationship and investigated the financial character of those relationships. The results of those investigations are discussed in this section.
II.A.Background
The U.S. commercial poultry industry includes production of more than 15 species of domesticated fowl and commercial game-birds, production of eggs from these species for hatching, and production of eggs from a limited number of these species for direct consumption by humans. Production of all poultry and eggs comprises approximately $43 billion of the U.S. agricultural economy. 19 The financial impact of the three major commercial poultry sectors (broilers, layers, and turkeys) collectively in the U.S. agricultural economy is comparable to the financial impact of soybeans. There is also a large processing added-value component in all poultry sectors.
Much of the poultry industry is vertically integrated. A small number of very large firms have “integrated” many elements of production, marketing, and sales. Integrators for poultry meat production may control feed production, brood egg production, hatching, grow-out,
transportation, slaughter, initial processing (preparation of a marketable whole bird), further processing to retail products such as lunch meat, and wholesale distribution. Although integrators play a smaller role in egg production, they may control feed production, layer
hatching and grow-out, transportation, processing, and wholesale distribution. Furthermore, this same level of integration characterizes many egg producers, including most of the larger
producers. Even relatively small egg and poultry producers/integrators may own and manage many aspects of their businesses (e.g., rearing of birds, feeding, housing, husbandry, and marketing of their product) and are capable of managing many elements of the process. Consequently, the major sector stakeholders have a tremendous amount of control of their products and vast market power relative to their growers.
II.B.Poultry Industry Production and Value
The report “Poultry - Production and Value Summary (Summary)” issued annually by NASS provides a view into the poultry industry for the previous year. These reports are released at the end of April each year beginning 1986. The Summary reports replaced the Poultry Production, Disposition, and Income reports released in 1984 and 1985. The Poultry Production,
Disposition, and Income reports replaced the Poultry: Production, Disposition & Income reports of 1977 through 1983.
19
USDA, NASS, 2012 Census of Agriculture, Table 2,
http://www.agcensus.usda.gov/Publications/2012/Full_Report/Volume_1,_Chapter_1_US/st99_1_002_002.pdf, accessed April 2015.
Insurance Program Development for Poultry Business Interruption
Use or disclosure of information or data Risk Management Agency contained on this sheet is subject to the Contract No: D15PD00545 restrictions on the title page of this report.
7
Though poultry is raised in every state in the Union, the Summary only reports broiler production data from a selected grouping of states: the top 20 production states, Other States (California, Illinois, Indiana, Iowa, Louisiana, Michigan, Nebraska, New York, Oregon, and Washington), and a 19 State Total (Alabama, Arkansas, California, Delaware, Florida, Georgia, Kentucky, Louisiana, Maryland, Mississippi, Missouri, North Carolina, Oklahoma,
Pennsylvania, South Carolina, Tennessee, Texas, Virginia, and West Virginia). The data for the Other States category is aggregated to avoid disclosing individual operations. Of the 20 states reported individually, Wisconsin, Minnesota, and Ohio are not included in the 19 state
aggregated total and California and Louisiana are added.20 The U.S. poultry industry produced 8.5 billion broilers in 2014 resulting in 51.4 billion pounds live weight. The average value of broilers, as reported in the Summary report, can be extrapolated by head or pound by dividing the total value of production by either the total number produced or the total pounds produced. In 2014 the average value per bird for broilers was $3.83 and the average value per pound was $0.64 as compared to $3.60 and $0.61 in 2013. Broiler production makes up about 68 percent of the total value of poultry production in the United States.
For turkeys, the Summary reports production data from the top 14 production states and then combines all other production under the aggregated Other States category. The U.S. poultry industry produced 237.5 million turkeys in 2014 resulting in 7.2 billion pounds live weight (an average of 30.4 pounds of meat per bird). Turkey value per bird in 2014, on average, was $22.33 as compared to $20.16 in 2013. Per pound, turkey meat was valued at $0.74 in 2014 as
compared to $0.67 in 2013. Turkey production makes up about 11 percent of the value of poultry production in the United States.
Egg production occurs and is tracked in every state. The Summary reports individual state-level data for 37 states and aggregates the other 13 under the heading Other States. The other states in the 2014 report included Alaska, Arizona, Delaware, Hawaii, Idaho, Kansas, Nevada, New Hampshire, New Jersey, New Mexico, North Dakota, Rhode Island, and Wyoming. These 13 states account for less than 3 percent of the total value of egg sales in the United States in 2014. The U.S. poultry industry produced 99.7 billion eggs in 2014 valued at more than $10.1 billion or $0.82 per dozen. This value includes all eggs for sale, both broken for processing and shell eggs (table eggs). Egg production makes up about 21 percent of the value of poultry production in the United States.
As can be seen in the tables from the USDA NASS 2012 Census of Agriculture, poultry is produced in every state. However, there are very distinct regions where production of certain segments within the poultry industry is highly concentrated. Broiler production is concentrated in the southeastern United States, stretching from Arkansas to the south and east through Mississippi, Alabama, Georgia, and North Carolina. Turkeys have two primary production regions, the Midwest (Minnesota, Arkansas, Missouri, Indiana, Iowa, and Wisconsin) and the Southeast (North Carolina, South Carolina, and Virginia). Layer production is also centered primarily in the Midwest (Iowa, Ohio, Indiana, Michigan, and Arkansas). Due to the fact that poultry production is geographically dispersed, even in the concentrated regions, the Contractor
20
USDA, NASS, April 2015, Poultry – Production and Value 2014 Summary,
Use or disclosure of information or data Risk Management Agency contained on this sheet is subject to the Contract No: D15PD00545 restrictions on the title page of this report.
8
does not believe an insurance product covering losses associated with integrator bankruptcy will adversely affect the market for poultry.
Table 1. 2012 Top Ten Broiler Production States
State Farms Number Sold Georgia 2,743 1,369,162,943 Alabama 2,356 1,001,776,907 Arkansas 2,109 975,950,973 North Carolina 1,969 801,883,037 Mississippi 1,430 761,180,486 Texas 1,566 600,353,797 Kentucky 826 305,383,434 Maryland 854 304,729,435 California 421 273,277,272 Missouri 784 272,389,497 Source: USDA, NASS, 2012 Census of Agriculture, Volume 1, Chapter
2, US State Level, Table 19,
http://www.agcensus.usda.gov/Publications/2012/Full_Report/V olume_1,_Chapter_2_US_State_Level/st99_2_019_019.pdf, accessed July 2015.
Table 2. 2012 Top Ten Turkey Production States
State Farms Number of Birds Minnesota 559 19,449,992 North Carolina 829 17,191,277 Arkansas 458 8,821,769 Missouri 885 7,572,505 South Carolina 430 6,999,565 Virginia 663 5,160,805 Indiana 663 5,084,794 California 682 4,532,307 Iowa 402 4,383,172 Wisconsin 631 3,468,522 Source: USDA, NASS, 2012 Census of Agriculture, Volume 1,
Chapter 2, US State Level, Table 19,
http://www.agcensus.usda.gov/Publications/2012/Full_Rep ort/Volume_1,_Chapter_2_US_State_Level/st99_2_019_01 9.pdf, accessed July 2015.
Table 3. 2012 Top Ten Layer Production States
State Farms Number of Birds Iowa 3,821 52,218,870 Ohio 8,548 28,312,692 Indiana 5,584 25,587,222 Pennsylvania 9,539 25,147,630 Texas 19,748 20,902,244 California 6,744 19,000,779 Georgia 3,483 17,445,067 North Carolina 4,996 13,091,384 Michigan 6,783 12,676,021 Arkansas 3,549 12,545,952 Source: USDA, NASS, 2012 Census of Agriculture, Volume 1,
Chapter 2, US State Level, Table 19,
http://www.agcensus.usda.gov/Publications/2012/Full_Rep ort/Volume_1,_Chapter_2_US_State_Level/st99_2_019_01 9.pdf, accessed July 2015.
Insurance Program Development for Poultry Business Interruption
Use or disclosure of information or data Risk Management Agency contained on this sheet is subject to the Contract No: D15PD00545 restrictions on the title page of this report.
9
Inasmuch as this project is geared toward integrator business interruption; the number of birds on a particular operation or within a particular region may only serve to indicate a small part of the risk associated with such focused coverage. The state with the highest percentage of poultry farms is Texas with nine percent of the total poultry operations in the United States. The number two state is Pennsylvania with 4.73 percent. Texas has at least nine integrators operating in the state and Pennsylvania has seven. Should an integrator declare bankruptcy in either of these states, there are multiple integrator companies with whom the affected operators might contract. The Contractor researched integrator geographical dispersion to determine how many states are only served by one integrator. There are multiple small integrators which service smaller niche markets throughout the United States. As these are generally regional or local in their focus, the Contractor focused this research on 47 top integrators as identified by Watt Poultry USA. The Contractor identified 15 broiler integrators, 11 layer integrators and 21 turkey integrators (See Table 4).
Table 4. Top Integrators
Processor Bird Processor Bird Processor Bird
Butterball, LLC Turkey House of Raeford
Farms Inc. Broilers Prestage Foods Turkey Cal-Maine Foods Layers Jennie-O Turkey
Store Turkey
Rembrandt
Enterprises Layers Cargill Turkey &
Cooked Meats Turkey Keystone Foods LLC Broilers Rose Acre Farms Layers Center Fresh Group Layers Koch Foods Inc. Broilers Sanderson Farms Inc. Broilers
Centrum Valley
Farms LP Layers
Kraft Foods, Inc.
(Oscar Mayer) Turkey Simmons Foods Inc. Broilers Cooper Farms Turkey Michael Foods Layers Trillium Farm
Holdings Layers Dakota Provisions Turkey Michigan Turkey
Producers Turkey Turkey Valley Farms Turkey Daybreak Foods Layers Midwest Poultry
Services LP Layers Tyson Foods
Turkey / Broilers Empire Kosher
Poultry Inc. Turkey Mountaire Farms Inc. Broilers
Virginia Poultry
Growers Coop. Turkey Farbest Foods, Inc. Turkey Norbest, Inc. (Moroni
Feed Co) Turkey Wayne Farms LLC Broilers Fieldale Farms Broilers Northern Pride Inc. Turkey Weaver Brothers Layers
Foster Farms Turkey /
Broilers O.K. Industries Broilers West Liberty Foods Turkey George's Inc. Broilers Peco Foods Broilers Whitewater
Processing Turkey Hain Pure Protein
Corp. Turkey Perdue Farms Inc.
Turkey /
Broilers Zacky Farms, LLC Turkey Hillandale Farms Layers Pilgrim's Broilers
Source: Broilers – After WATTAgNet.com, 2015, Top Poultry Companies, The world’s leading broiler, turkey and egg producers, http://www.wattagnet.com/worldtoppoultry.html, accessed July 2015.
Use or disclosure of information or data Risk Management Agency contained on this sheet is subject to the Contract No: D15PD00545 restrictions on the title page of this report.
10
The Contractor assigned each state to one of three categories: 1) states where poultry value amounted to less than 2 percent of the total agricultural production value for that state; 2) states with only one integrator identified as operating in that state; and 3) states where multiple
integrators were identified as operating in that state. There were 15 states which were identified as being in category 1, 6 states with a single integrator, and 30 states with multiple integrators. The state with the most identified integrators was North Carolina with 15, followed closely by Arkansas with 14. The Contractor believes the number of integrators, particularly in highly populated poultry production states, is such that risk associated with a bankruptcy by one integrator would be lessened by the affected grower having relatively quick access to another integrator for future contracts.
Private insurance is available for business interruption resulting from integrator bankruptcy through HUB International. These insurance brokers and consultants work with contractors in many industries to address financial risks in contractual agreements. The liability covered is generally tied to potential lost revenues and to existing credit obligations of the insured. Rating is based on integrator finances when available (from public sources such as annual financial reports of publicly traded integrators) and from additional information identified by underwriters in drafting one-off contracts. Some of these policies are offered as standard policies while others are on offer as surplus line policies.
II.C.Broiler Sector
The term ‘broiler’ is the poultry industry name for a young chicken raised for meat. With the value of broiler production in 2014 totaling almost $33 billion,21 broilers account for about two thirds of the farm-level value of production and sales of poultry products in the United States.7,22 The broiler sector is dominated by vertically-integrated agribusiness firms. People in the
industry refer to these firms as either broiler companies or integrators. In the government literature they are occasionally called “dealers” or “contractors.” In 2015, 15 vertically integrated firms controlled almost 90 percent of U.S. broiler production (Table 5).23 Consolidation in the industry has resulted in “…significant structural change in recent
decades…the industry has evolved to a structure including vertical integrators that contract with producers to raise their animals under strict specifications.” Under this integrated structure, “Vertically integrated companies in a supply chain are united through a common owner. Usually each member of the supply chain produces a different product or service, and the products
combine to satisfy a common need…”24 To avoid confusion in the discussions in this report, the Contractor will avoid using the term “producer” except in quotations and will generally refer to either integrators, growers, or owner/producers.
21
USDA, NASS, 2015, Poultry Production and Value, 2014 Summary,
http://usda.mannlib.cornell.edu/usda/current/PoulProdVa/PoulProdVa-04-30-2015.pdf, accessed July 2015 22
The Poultry Site, Poultry News, “Value of US Poultry Production Has Doubled in 14 Years”,
http://www.thepoultrysite.com/poultrynews/33264/value-of-us-poultry-production-has-doubled-in-14-years, accessed July 2015.
23 WATT Poultry USA, 2015, Top Broiler Producing Companies,
http://www.wattagnet.com/Worldtoppoultry/US_broiler_producers.html, accessed July 2015. 24
National Chicken Council, Vertical Integration, http://www.nationalchickencouncil.org/industry-issues/vertical-integration/, accessed July 2015.
Insurance Program Development for Poultry Business Interruption
Use or disclosure of information or data Risk Management Agency contained on this sheet is subject to the Contract No: D15PD00545 restrictions on the title page of this report.
11
Table 5. Top Broiler Integrators, United States, Through July 2015
Integrator Percent of Market Head Processed
Tyson Foods 25.30% 1,862.10 Pilgrim’s Pride 17.50% 1,493.40 Perdue Farms 7.60% 644.80 Koch Foods 7.30% 624.00 Sanderson Farms 5.30% 451.90 Wayne Farms 3.90% 335.40 Mountaire Farms 3.80% 322.40 Foster Farms 3.40% 293.80 George’s 3.40% 286.00 Peco Farms 2.30% 194.50 Keystone Farms 2.20% 188.80 Simmons Foods 2.20% 189.80
House of Raeford Farms 2.10% 177.80
O.K. Foods 1.80% 150.80
Fieldale Farms 1.80% 150.80
Source: After WATT Poultry USA, 2015, Top Broiler Producing Companies,
http://www.wattagnet.com/Worldtoppoultry/US_broiler_producers.html, accessed July 2015. The Contractor converted weekly numbers in that report to annual processed numbers.
The Crop
Modern commercial broilers, typically known as Cornish crosses or Cornish-Rocks, are specially bred for large-scale, efficient meat production and grow much faster than egg or traditional dual purpose breeds. Modern commercial broilers are noted for having very fast growth rates, a high feed conversion ratio, and low levels of activity. Broilers often reach a harvest weight in only eight weeks. Commercial broilers have white feathers and yellowish skin. These birds also lack the typical “hair”25
characterizing many breeds that requires singeing after plucking. Both male and female broilers are slaughtered for their meat. The genetic lines for most broilers produced in the United States are managed by three companies: Aviagen Inc., Hubbard LLC (Americas), and Avian Technology Intl LLC.26 These companies also have substantial international sales of chicks and parent stock (e.g., Aviagen reports sales in 130 countries).
Growers own the broiler houses, provide labor, and generally have the responsibility to manage biosecurity, house preparations, and litter. The vast majority of broiler production operations are managed under a contractual structure that dictates both the manner in which the enterprise is managed and how returns are distributed. The impact of these contracts on grower enterprises is the central focus of literature regarding risk management in the poultry industry.
At the outset, it is important to clarify that farm-level broiler prices, receipts, and values reported by various agencies, including NASS, are calculated or estimated values. They are not the values received by broiler growers which are dictated by the contractual agreement entered into between the grower and integrator. The published “prices received” values are live-weight-equivalent prices calculated by subtracting processing costs from ready-to-cook wholesale prices and multiplying that result by the dressing percentage. These values are useful primarily as
25
A filoplumes consists primarily of the rachis, the main shaft of a feather. In some breeds filoplumes lie under the contour (surface) feathers providing support.
26
Use or disclosure of information or data Risk Management Agency contained on this sheet is subject to the Contract No: D15PD00545 restrictions on the title page of this report.
12
industry-wide indicators of the relative price trends. The revenue contract growers actually receive is a contracted payment for capital and labor services rendered. Payment is based on pounds of bird delivered multiplied by the contract price, which is derived from a two-part, piece-rate tournament scheme, i.e., a base rate plus an incentive determined by the grower’s performance relative to others in the tournament. Under the tournament system, the integrator sets an average price for raising the chickens (e.g., 5 cents per pound live weight). The contract growers are ranked. The top-ranking contract growers can be paid a premium of up to 25 percent. Since the contract price is a tournament average, the poorest performing contract growers will receive less than the average. The grower’s ranking is largely based on feed conversion rates: how much weight the broilers gained compared to how much feed the birds have consumed.
Enterprise Structure
An analysis of broiler operations reported by the USDA Economic Research Service (ERS) in 2014 provides the best snapshot of broiler production.27 Grower contracts dominate the industry, with only about 0.4 percent of birds produced by independent poultry owner/producers and 0.3 percent produced on integrator-operated farms. Few details about the contracts themselves are available. In spite of repeated requests for redacted copies of contracts from growers,
integrators, and crop experts, the Contractor obtained only two contracts (Appendix A). ERS reports that almost 94 percent of the contracts contain performance-based payment incentives; however, most of these broiler contracts have tournament or similar competitor-comparison-based incentive payments. The contracts obtained by the Contractor contain language providing the grower with performance-based incentives coupled with tournament-based performance payments.
The turnover in farms producing broilers is relatively low. About one third of all broiler
operations have been in business for at least 20 years. These older operations tend to be smaller and to have lower levels of technology. Only 4.5 percent of farms (6.6 percent of production by weight) produced broilers for 5 years or less. Interestingly, these newer operations have houses that are 11 years old on average, suggesting turnover in the grower cohort or farm-level
economic restructuring. Just under half of the new operations had new houses. Newer
operations tend to incorporate a larger number of houses. New operations with new houses also tend to carry a higher debt load compared to new operations using older houses.28
Newer operations tend to be larger and also tend to have more substantial investment in housing and technology. These newer operations are more reliant on income from the poultry operations rather than from a range of “crops” and are more sensitive to changes in energy prices and contract settlement terms. New large operations typically receive longer term contracts.29 Furthermore, in at least one of the contracts reviewed by the Contractor, the integrator offered a minimum guaranteed payment for new house construction based on dollars per 1,000 birds placed and the type of the new construction. Additionally, integrators search for and more
27 MacDonald, J.M., USDA, ERS, 2014, Technology, Organization, and Financial Performance in U.S. Broiler Production, Economic Information Bulletin No. 126., http://www.ers.usda.gov/media/1487788/eib126.pdf, accessed July 2015. 28
Ibid. 29
Insurance Program Development for Poultry Business Interruption
Use or disclosure of information or data Risk Management Agency contained on this sheet is subject to the Contract No: D15PD00545 restrictions on the title page of this report.
13
readily offer contracts to operations with newer facilities and updated technology when they expand into new areas or contract with growers.
The Industry
While the agricultural segment of the U.S. economy has grown slightly on a relative percentage basis from 1999 to 2014, the broiler sector share of the total U.S. agricultural economy declined from 8.04 percent to 8.02 percent (Table 6). This decline occurred in spite of increases in production, consumption, and exports of meat from broiler chickens.
Table 6. Economic Indicators–Broiler, United States ($ Billions)
Year Gross Domestic Product1 Agricultural Cash Receipts2 Value of Broilers3
1999 9,660.6 187.8 15.1 2000 10,284.8 192.1 14.0 2001 10,621.8 200.0 16.7 2002 10,977.5 194.6 13.4 2003 11,510.7 216.0 15.2 2004 12,274.9 237.9 20.4 2005 13,093.7 240.9 20.9 2006 13,855.9 240.6 17.7 2007 14,477.6 288.5 21.5 2008 14,718.6 316.1 23.2 2009 14,418.7 291.4 21.8 2010 14,964.4 322.2 23.7 2011 15,517.9 368.7 23.0 2012 16,163.2 404.8 24.8 2013 16,768.1 401.3 30.8 2014 17,418.9 407.4 32.7
Source: 1 Bureau of Economic Analysis, 2015, National Income and Product Accounts Table 1.1.5, Gross Domestic Product,
http://www.bea.gov/iTable/iTable.cfm?ReqID=9&step=1#reqid=9&step=1&isuri=1, accessed July 2015.
2 In Nominal dollars, USDA, ERS, 2015, Farm and Income Wealth Statistics, Annual cash receipts by commodity,
http://www.ers.usda.gov/data-products/farm-income-and-wealth-statistics/cash-receipts-by-commodity.aspx#.VFutk_nF9qW, accessed July 2015.
3
USDA, ERS, 2015, Poultry Production and Value,
http://usda.mannlib.cornell.edu/MannUsda/viewDocumentInfo.do?documentID=1130, accessed July 2015.
The southern and mid-Atlantic states form the major broiler producing areas of the United States (Table 7). Although number of head, pounds produced, and value all track relatively closely, variations in the harvest weight of birds lead to modest differences between percent of head produced and of pounds produced. The ERS estimated value produced is based on a constant price.
Use or disclosure of information or data Risk Management Agency contained on this sheet is subject to the Contract No: D15PD00545 restrictions on the title page of this report.
14
Table 7. Broiler Production by States, 20141
State Number Produced (1,000 Head) Percent of Number Head Produced Pounds Produced (1,000 Pounds) Value of Production2 (1,000 Dollars) Percent of Pounds/Value Produced Georgia 1,324,200 15.50% 7,547,900 4,808,012 14.69 Alabama 1,061,500 12.42% 6,050,600 3,854,232 11.78 Arkansas 969,800 11.35% 6,012,800 3,830,154 11.70 North Carolina 795,200 9.31% 6,043,500 3,849,710 11.76 Mississippi 727,200 8.51% 4,508,600 2,871,978 8.78 Texas 591,800 6.93% 3,550,800 2,261,860 6.91 Kentucky 308,000 3.60% 1,724,800 1,098,698 3.36 Missouri 288,500 3.38% 1,384,800 882,118 2.70 Maryland 287,800 3.37% 1,554,100 989,962 3.03 Virginia 262,000 3.07% 1,441,000 917,917 2.80 Delaware 244,100 2.86% 1,733,100 1,103,985 3.37 South Carolina 232,500 2.72% 1,650,800 1,051,560 3.21 Oklahoma 205,300 2.40% 1,334,500 850,077 2.60 Pennsylvania 181,300 2.12% 997,200 635,216 1.94 Tennessee 180,600 2.11% 939,100 598,207 1.83 West Virginia 95,300 1.12% 371,700 236,773 0.72 Ohio 75,600 0.88% 430,900 274,483 0.84 Florida 66,700 0.78% 386,900 246,455 0.75 Wisconsin 53,400 0.62% 224,300 142,879 0.44 Minnesota 46,800 0.55% 280,800 178,870 0.55 Other States3 546,500 6.40% 3,204,900 2,041,521 6.24 United States Total 8,544,100 51,373,100 32,724,667
Source: USDA, ERS. April 2015, Poultry - Production and Value 2014 Summary,
http://usda.mannlib.cornell.edu/usda/current/PoulProdVa/PoulProdVa-04-30-2015.pdf, accessed July 2015
1 Broiler production including other domestic meat-type strains.
2 Live weight equivalent price, derived from ready-to-cook prices minus processing costs, then multiplied by a dressing percentage. 3 California, Illinois, Indiana, Iowa, Louisiana, Michigan, Nebraska, New York, Oregon, and Washington combined to avoid disclosing
individual operations.
Nationally, broiler production decreased 5.5 percent from 2008 to 2014, from 9.01 billion birds in 2008 to 8.54 billion birds in 2014. Over the same time, weight per bird increased by 7.5 percent, from 5.594 pounds to 6.013 pounds. The combined decrease in bird numbers and increase in bird weight resulted in a 1.98 percent increase in total weight produced, from 50.4 billion pounds in 2008 to 51.4 billion pounds in 2014.
Alabama, Arkansas, and Georgia accounted for nearly 40 percent of the U.S. production in 2014 when two of these states (Georgia and Alabama) produced more than 1 billion birds.
Mississippi, North Carolina, and Texas comprise a second production tier, with harvests of over half a billion birds. Some states, primarily in the northeast and mountain states, reported little or no commercial broiler production in 2014.30
Despite substantial research, the Contractor was unable to identify national data other than the USDA NASS Census of Agriculture (Census) data at the county level for broilers. NASS annual statistics do not include number of growers or county-level statistics in estimates derived from its annual surveys. There are fragmented data available from a few state and county agencies and
30
USDA, NASS, 2015, Broiler Production by State Million Head, 2014,
Insurance Program Development for Poultry Business Interruption
Use or disclosure of information or data Risk Management Agency contained on this sheet is subject to the Contract No: D15PD00545 restrictions on the title page of this report.
15
industry associations. Farm-level data have not been obtained despite requests of people who attended the listening sessions. Integrators, who have the most complete farm-level records for substantial grower populations, consider all their data proprietary.
The 2012 Census reported 32,935 farms with “Broiler and other meat-type chickens sold,” a 21.5 percent increase over the 2007 reported 27,091 farms. NASS reported that 15,334 growers produced more than 100,000 birds in 2012, and 41 percent of those growers produced more than 500,000 birds. A total of 7,183 farms were located in the 3 states ranked highest in broiler production, and 42 percent of farms with reported sales over 100,000 birds were located in the same 3 states. Commercial broiler production is organized and operated around broiler houses, the major farm-level capital investment. No consistent national dataset that reported the number of houses or houses per farm was identified.
Under the integrator/grower contract structure, the broiler enterprise might seem a safe haven for the grower. However, this is not the case; growers must be concerned about performance of the birds they are raising under contract. Broiler production is influenced by disease, weather, equipment, building environment, and the quality of feed provided by the integrator. Also, growers are not free from domestic and international market outcomes, even with a contracted payment. The potential of subsequent contracts, and, to a lesser extent, the payment and incentive provisions of the production contracts depend upon the integrator’s inventory of processed meat and short- and intermediate-run market forecasts.
II.D.Turkey Sector
The United States is the world’s largest producer of turkeys. U.S. turkey production was reported at 7.2 billion pounds in 2014, with a total estimated farm-gate value of almost $5.3 billion. 31 The average estimated price received by U.S. turkey producers during 2014 was almost 74 cents per live-weight pound.32 The structure of the turkey sector, with a wide variety of processed products, has made turkey production a year round, rather than a seasonal, activity. Smoked and roasted turkey lunchmeats; ground breast meat; pre-roasted and ready to roast turkey rolls; heat-and-eat turkey dinners; and turkey sausage, hot dogs, “bacon,” “pastrami,” and “ham” illustrate the breadth of turkey products currently available. These products have a substantial impact on total integrator revenues, but have limited effects on prices received by growers.
The Crop
The domesticated turkey is a descendant of the wild turkey, Meleagris gallopavo. The dominant commercial breed of turkeys in the United States is the Broad-breasted White (similar to “White Holland,” but a distinct breed). Most commercial breeds have been selected for size as well as meat types and distribution.
31 USDA, RMA, 2015, Poultry - Production and Value, 2014 Summary,
http://usda.mannlib.cornell.edu/usda/current/PoulProdVa/PoulProdVa-04-30-2015.pdf, accessed July 2015. 32
USDA, RMA, 2015, Poultry - Production and Value, 2014 Summary,
Use or disclosure of information or data Risk Management Agency contained on this sheet is subject to the Contract No: D15PD00545 restrictions on the title page of this report.
16
Most turkey grow-out facilities raise 50,000 to 75,000 birds with 2.5 to 3.5 “turns” per year. Many of the larger facilities have a single structure (the brood house) with the capacity to house as many as 100 thousand poults. Poults are raised with an average density of one square foot per bird. Each of these brood houses generally serves two grow-out houses. Consequently, seven broods may be raised in a year to produce the livestock for 3.5 grow-out production cycles per year in each of the grow-out houses. On larger farms, multiple houses may be stocked, although normally all the birds on the farm are the same age.
The majority of U.S. turkeys are grown in controlled-environment confinement houses or in pole barns. The windowless confinement houses use modern systems of environmental control (heating, ventilation, and lighting). Ventilation systems provide sufficient oxygen for the normal growth and development and remove ammonia, carbon dioxide, dust, moisture, and heat.
Confinement houses may contain as many as 50,000 birds. Depending on the degree of
automation of the environmental control, feeding, and drinking systems, a single employee may provide all the necessary labor for a confinement house.
Environmental control within pole barns is more rudimentary. Consequently, labor requirements are greater and stocking densities are lower. Turkey poults reared in pole barns are generally raised in environmentally-controlled houses to 5 or 6 weeks of age. In the pole barns, the birds are raised in natural light, supplemented during the winter months with electric light. In the North, there is often limited control of temperature or ventilation in pole barns. The floor area of turkey pole barns ranges from 10,000 to more than 20,000 square feet. Automated feeders and watering systems maximize production, although the cost of such systems may limit their use. Turkeys in the pole barns are raised on litter (wood shavings) and allowed to move freely within the barn.
After removal of a flock, a two- to four-week period is allowed before a new flock is placed in turkey brood and grow-out houses. During this time, the house is cleaned and disinfected. Old litter is generally replaced after a flock is removed from turkey brood houses; however, wastes may be removed from turkey grow-out houses just once each year. The decision on the timing of cleaning of the grow-out houses is driven largely by the cost of labor and bedding.
Hens in grow-out houses are raised at a density of one per 2.5 square feet. Turkey hens consume about 40 pounds of feed in their lifetime with a feed conversion rate (pounds of feed per pound of weight gain) of about 2.5. Ten percent mortality during brooding and grow-out is assumed for planning the size of the houses and the initial population. For harvest, the hens are collected in “modules” or small cages, which are generally loaded onto flatbed trailers. Some additional mortality occurs during transportation. Those losses are generally not considered when an integrator evaluates a grower’s rank. However, the long-term trends of such losses may impact an integrator’s decisions about levels of restocking. Slaughter and processing are mechanized to minimize processing time.
Toms are raised at a density of 3 to 4 square feet per bird in the grow-out houses. Stocking densities in grower operations are generally based on the recommendations of the integrator. Toms consume about 90 pounds of feed during their lifetime with a feed conversion rate of about 2.9. Commercial toms, which are more aggressive than hens, have a higher mortality than the
Insurance Program Development for Poultry Business Interruption
Use or disclosure of information or data Risk Management Agency contained on this sheet is subject to the Contract No: D15PD00545 restrictions on the title page of this report.
17
hens. Toms are harvested at about 18 weeks (i.e., somewhat less than 3 production cycles each year). Some growers and producers reduce the density of older toms by moving a portion of the birds into houses vacated by the hens when they are harvested. This may reduce mortality marginally as the large birds compete for space and feed. The harvest process for toms is essentially the same as that for hens.
Free-range birds represent a small niche market in the turkey sector. The only requirement for labeling with the term ‘free-range’ is the birds have access to the outdoors.33
Housing for free-range birds is usually of the pole barn type. Natural daylight and green food may be available on the range, but some source of food is generally provided in the barn. Slower growing strains, low nutrient density feed, low stocking density, and longer production cycles characterize this minor sector of the crop.
Growers furnish the land, facilities, and labor under contract. They are paid based on the grade, live weight, and feed conversion ratios of the birds delivered to the processing plant. Each integrator contract is reported to be unique; and contracts between an integrator and individual growers may also be quite different, taking into consideration such things as the physical services available at a facility, mortality experience, and historic and current feed conversion ratios. If the grower realizes a return of $7 to $8 per bird, the facility described as “typical” may generate a cash flow of $1.25 million to $2.5 million per year. Cost of production is more difficult to assess under the current integrator/grower industry structure. In many cases, the integrator owns the turkeys, supplies feed, medicine, vaccines, and pays a grow-out supervisor. The grow-out supervisor monitors the turkeys’ health and growth and decides when veterinary attention, primarily medications or vaccinations, are required.
During the course of this and other poultry related projects, the Contractor spoke with
representatives of several operations that were not typical growers. These operations own the turkeys produced under a contract with an integrator and bear all the associated financial risks in regard to losses, price fluctuations, and poor weight gain. These owner/producer operations would have differing incentives to participate in a business interruption insurance product depending on their individual agreements and contracts with the integrators.
The Industry
The U.S. turkey sector is dominated by vertically integrated agribusiness firms. In the second half of the 20th Century, after a period of decline in the sector, turkey hatcheries began providing financing for the purchase of poults, while feed companies provided financing for both feed and poults as a means to stimulate feed sales. These financial arrangements eventually evolved into production contracts that shifted risk from grower to integrator. Under contract, the grower provides the buildings, equipment, and labor; the integrator, who is usually involved in a variety of post-harvest processing activities, provides poults, feed, veterinary services, and managerial assistance. Most growers receive a fee per bird or per pound and contracts may provide performance incentives for feed conversion and reduced mortality rates. Most, but not all,
33
USDA, Food Safety and Inspection Service, 2014, Food Labeling: Meat and poultry Labeling Terms,
http://www.fsis.usda.gov/wps/portal/fsis/topics/food-safety-education/get-answers/food-safety-fact-sheets/food-labeling/meat-and-poultry-labeling-terms/meat-and-poultry-labeling-terms, accessed April 2015.
Use or disclosure of information or data Risk Management Agency contained on this sheet is subject to the Contract No: D15PD00545 restrictions on the title page of this report.
18
integrators produce both whole bodied and further processed turkey products. The major turkey integrators and their associated production for 2013 are documented in Table 8.
Table 8. Top U.S. Turkey Processors in 2013
Processor Live Weight Processed (million pounds)
Butterball, LLC 1,300.0
Jennie-O Turkey Store 1,250.0
Cargill Value Added Meats 1,071.0
Farbest Foods, Inc. 411.0
Hillshire Brands Company (formerly Sara Lee) 402.0 Kraft Foods, Inc. (Oscar Mayer) 280.0
Perdue Farms, Inc. 277.0
Foster Farms 270.7
Virginia Poultry Growers Coop. 239.0
West Liberty Foods 216.3
Cooper Farms 205.0
Michigan Turkey Producers 190.0
Dakota Provisions 179.0
Hain Pure Protein Corp. 172.0
Turkey Valley Farms 145.0
Prestage Foods 140.0
Norbest, Inc. (Western Sales LLC) 82.0
Zacky Farms, LLC 68.3
Northern Pride Inc. 40.0
Whitewater Processing 30.0
Empire Kosher Poultry, Inc. 25.2
Koch's Turkey Farm 15.2
Jaindl Turkey Sales, Inc. 11.0
Source: The Contractor’s Research Department after Watt Poultry USA, 2015
Turkey production is scattered throughout the United States. However, over half of all the turkeys raised for slaughter in the United States in 2014 were raised in four states: Minnesota, Arkansas, North Carolina, and Indiana (Table 9). While U.S. consumers eat more turkey per capita and as a population than any other national consumer population, the U.S. turkey industry is also more reliant on exports than most U.S. agricultural sectors.34
34
USDA, NASS, 2014, Highlights, Turkey Industry Overview,
http://www.nass.usda.gov/Publications/Highlights/2013_Turkey_Industry/, accessed December 2014; USDA, NASS, 2015, Quick Stats, http://quickstats.nass.usda.gov/results/5487DA7B-D988-3DF0-8884-2E407CE067F6, accessed June 2015.
Insurance Program Development for Poultry Business Interruption
Use or disclosure of information or data Risk Management Agency contained on this sheet is subject to the Contract No: D15PD00545 restrictions on the title page of this report.
19
Table 9. Geographic Distribution of 2014 Turkey Production in the United States
State Number Raised (1,000 head) Pounds Produced (1,000 lbs.) Value of Production ($1,000) Minnesota 45,500 1,178,450 866,161 Arkansas 30,000 612,000 449,820 North Carolina 28,500 997,500 733,163 Indiana 19,000 754,300 554,411 Missouri 17,000 544,000 399,840 Virginia 16,800 443,520 325,987 California 11,000 310,200 227,997 Iowa 10,500 435,750 320,276 Pennsylvania 7,000 175,700 129,140 Ohio 5,100 209,100 153,689 Michigan 5,100 205,530 151,065 South Dakota 4,500 188,550 138,584 Utah 4,000 96,800 71,148 West Virginia 3,100 81,840 60,152 Other States1 30,400 983,816 723,104 United States 237,500 7,217,056 5,304,537 Source: USDA, NASS, 2015, Poultry - Production and Value - 2014 Summary, April 2015,
http://usda.mannlib.cornell.edu/usda/current/PoulProdVa/PoulProdVa-04-30-2015.pdf, accessed July 2015.
1 Includes State estimates not shown and States withheld to avoid disclosing data for individual operations.
By 1961, feed company contracts for production accounted for almost two-thirds of all turkey production. Subsequently, processors became increasingly involved in production decisions and began raising turkeys themselves to better ensure supplies. With the involvement of large feed and processing firms, the share of turkeys sold on the U.S. spot market decreased substantially. In 2011, turkey production contracts accounted for more than two-thirds of U.S. production.35 Vertically integrated operations, in which the processor (both integrators and owner/processors) owns the production facilities and hires labor to care for the birds, accounted for almost one-third of turkey production. With 2014 farm-level cash receipts of just over $5.3 billion (Table 10), turkeys accounted for approximately 11 percent of cash receipts for poultry in the United States.36
35 USDA, NASS, 2012, Census of Agriculture, Volume 1, Tables 32 and 45,
http://www.agcensus.usda.gov/Publications/2012/Full_Report/Volume_1,_Chapter_1_US/, accessed January 2015. 36
USDA, NASS, April 2015, Poultry - Production and Value 2014 Summary
Use or disclosure of information or data Risk Management Agency contained on this sheet is subject to the Contract No: D15PD00545 restrictions on the title page of this report.
20
Table 10. Economic Indicators – Turkeys, United States ($ Billions)
Year Gross Domestic Product1 Agricultural Cash Receipts2 Value of Turkeys3
1999 9,660.6 187.8 2.8 2000 10,284.8 192.1 2.8 2001 10,621.8 200.0 2.8 2002 10,977.5 194.6 2.7 2003 11,510.7 216.0 2.7 2004 12,274.9 237.9 3.1 2005 13,093.7 240.9 3.2 2006 13,855.9 240.6 3.6 2007 14,477.6 288.5 4 2008 14,718.6 316.1 4.5 2009 14,418.7 291.4 3.6 2010 14,964.4 322.2 4.4 2011 15,517.9 368.7 4.9 2012 16,163.2 404.8 5.4 2013 16,768.1 401.3 4.8 2014 17,418.9 407.4 5.3
Source: 1/ Bureau of Economic Analysis, 2015, National Income and Product Accounts Table 1.1.5, Gross Domestic Product, http://www.bea.gov/iTable/iTable.cfm?ReqID=9&step=1#reqid=9&step=1&isuri=1, accessed July 2015.
2/ In Nominal dollars, USDA, ERS, 2015, Farm and Income Wealth Statistics, Annual cash receipts by commodity,
http://www.ers.usda.gov/data-products/farm-income-and-wealth-statistics/cash-receipts-by-commodity.aspx#.VFutk_nF9qW, accessed July 2015.
3/ USDA, ERS, 2015, Poultry Production and Value, http://usda.mannlib.cornell.edu/MannUsda/viewDocument Info.do?documentID=1130, accessed July 2015.
On farms either owned by the integrators or managed under grower contracts, the integrator generally provides the stock, feed, veterinary services, production technical support, and
transportation. The grower provides the growing facilities and day-to-day care and management of the birds. The impact of production contracts on turkey enterprises are not as well
documented as are the impacts of production contracts on broiler enterprises.
The relative importance of direct production in the turkey sector to the U.S. agricultural and overall economies is approximately one-fifth that of the broiler sector (see Tables 6 and 9). However, it should be noted there are considerably more value-added processing activities in the turkey sector than in the broiler sector. This amplifies the financial effects of turkey production in the general economy.
Substantial research by the Contractor identified the NASS Census as the only source of national turkey data at the county level. The 2012 Census documents some commercial turkey
production in every state.37 NASS annual statistics do not include number of growers or county-level statistics in its annual surveys because there are insufficient numbers of growers in most counties to allow reporting of results under the disclosure rules followed by NASS. There are fragmentary data available from a few state and county agencies and industry associations. Commercial turkey production is organized and operated around turkey houses, the major farm-level capital investment. No dataset documenting the total number of houses by county or
37
USDA, RMA, NASS Census of Agriculture, 2012 Census Volume 1, Chapter 2: State Level Data, Table 19,
http://www.agcensus.usda.gov/Publications/2012/Full_Report/Volume_1,_Chapter_2_US_State_Level/st99_2_019_019.pdf, accessed July 2015.
Insurance Program Development for Poultry Business Interruption
Use or disclosure of information or data Risk Management Agency contained on this sheet is subject to the Contract No: D15PD00545 restrictions on the title page of this report.
21
houses per farm was identified. The 2014 Census reported 19,956 farms growing turkeys, a 15.8 percent increase over the 17,226 farms reported in the 2007 Census. The NASS Census reported 833 growers produced more than 100,000 birds in 2012.38 NASS reports 1,903 operations grew turkeys under contract, producing slightly more than two-thirds of the turkeys reported to have been sold.39
The turkey sector has evolved to fewer than 25 highly specialized, vertically integrated
agribusiness firms. Under the grower/integrator structure, the turkey growers must be concerned about performance of the contracted birds. Both turkey growers and integrators have benefited from economies of scale associated with the industry’s horizontal and vertical structure, but projected gains in efficiency over the next decade are anticipated to be less than historical gains. Trade restrictions have slowed growth in many U.S. animal product exports. Continuing
concerns with AI and Exotic Newcastle Disease (END) have affected trade.40 II.E.Layer Sector
The term ‘layer’ is the poultry industry name for a hen maintained for egg production. Hens from all varieties (breeds) of chickens lay eggs, but hens from only a few breeds consistently lay eggs of appropriate size. The egg laying breeds of chickens have been genetically selected for high egg productivity. Hens of laying breeds produce up to 300 eggs a year; however they usually have small bodies that make them undesirable as meat producers. The small bodies benefit laying breeds because the hens use fewer nutrients to produce and support body mass. Instead, layers direct much of their energy into the egg production. After approximately 12 months of age, the hen’s egg-laying declines. Hormonal changes resulting from changes in diet and photoperiod can be used to stimulate further egg production. After the layer reaches age one and a half to two and a half years, commercial hens are typically slaughtered (culled). However, laying can be stimulated by forcing the hen to molt. During the molt, laying stops completely. Following the molt, the frequency of laying is increased relative to the pre-molt frequency. Meat from culled layers is used in pet foods, soup, pot pies, and other processed foods.
Commercial chicken eggs include two categories of “table” eggs for human consumption, as well as hatching eggs. “Shell” eggs are table eggs sold at retail, generally by the dozen. “Breaking” or processed eggs are table eggs broken in specialized plants that transform the eggs into liquid eggs or further process the liquid eggs into products, such as powdered eggs, that have a longer shelf life. Production of processing eggs is generally a conscious output decision, rather than a salvage activity. Operators of table egg production facilities do not generally produce hatching
38
USDA, RMA, NASS Census of Agriculture, 2012 Census Volume 1, Chapter 1: U.S. National Level Data, Table 32, http://www.agcensus.usda.gov/Publications/2012/Full_Report/Volume_1,_Chapter_1_US/st99_1_032_033.pdf, accessed July 2015.
39
USDA, RMA, NASS Census of Agriculture, 2012 Census Volume 1, Chapter 1: U.S. National Level Data, Table 45,
http://www.agcensus.usda.gov/Publications/2012/Full_Report/Volume_1,_Chapter_1_US/st99_1_045_048.pdf, accessed July 2015.
40
Iowa State University, 2013, AgMRC, Turkey Profile,