Applying Process-Oriented Data Science to Dentistry
Frank Gerard Fox
Submitted in accordance with the requirements of the degree of
Doctor of Philosophy
The University of Leeds
School of Dentistry
School of Computing
Intellectual Property and Publication Statements.
The candidate confirms that the work submitted is his own except where work which has formed part of jointly authored publications has been included. The contribution of the candidate and the other authors to this work has been explicitly indicated below. The candidate confirms that appropriate credit has been given within the thesis where reference has been made to the work of others.
The work in Section 10.19.3 of the thesis has appeared in publications as follows: “A Data Quality Framework for Process Mining of Electronic Health Record Data”, F.Fox, V.R.Aggarwal, H.Whelton, O.Johnson, IEEE International Conference on Healthcare Informatics Proceedings, P.12-21, New York, 2018.
FF & OJ conceived and planned the theoretical framework with support from VA & HW. FF applied the framework to the use case data and identified the key data quality issues. FF wrote initial drafts & final draft of manuscript with input from all authors. All authors discussed results and commented on the manuscript generally.
“The ClearPath Method for Care Pathway Process Mining and Simulation”. Owen Johnson, Angelina Prima Kurniati, Frank Fox, Eric Rojas and Thamer Ba Dhafari, International Workshop on Process-Oriented Data Science for Healthcare, Sydney, 2018. FF contributed the section on data quality and discussed results and commented on the manuscript generally.
This copy has been supplied on the understanding that it is copyright material and that no quotation from the thesis may be published without proper acknowledgment.
The right of Frank G. Fox to be identified as Author of this work has been asserted by him in accordance with the Copyright, Designs and Patents Act 1988.
Acknowledgements
My heartfelt thanks to my three supervisors, Dr Vishal Aggarwal, Mr Owen Johnson and Professor Helen Whelton, first, for their faith in me and second, for their guidance and encouragement over the last three years. I would like to say a big thank you to my last principal supervisor, Vishal, for his support over the last year when getting the job finished was a real challenge, to Helen for her inspirational dedication to improving population oral health and to Owen for sharing his vast experience in applying data analytics in healthcare settings. They made my PhD experience challenging, inspiring, and fun.
Thanks to everyone in the University of Leeds School of Dentistry ADVOCATE office, especially Amy and Heather, for your help and all the fun we have had in the last few years. I would also like to thank my friends in both Ireland and the UK for all your support in helping keep things running smoothly during my studies. I would like to thank my friend and business partner Brendan Burke for supporting me throughout this work. Thanks to the staff of the Oral Health Services Research Centre in University College Cork, Mairead Harding, Patrice James and Maria Tobin for their help and support in this venture. I owe a debt of gratitude to the late Dr Gerard Meehan, Galway and Dr Niall O’Neil, Cork for the initial risks they took and their inspiration and support over many years.
I owe a huge thank you to my family. I couldn’t wish for better: my parents, Frank and Maura, for their love, support and belief in me always; my sons Eamonn, Joey, and Tom for being loving, responsible, and trustworthy lads. I could not have undertaken this work without knowing I could rely on them every day I was away. And to Majella, for her constant love, support and good humour in the face of frequent absences, and for always encouraging me take the opportunities presented, whatever the cost.
Abstract
Background: Healthcare services now often follow evidence-based principles, so technologies such as process and data mining will help inform their drive towards optimal service delivery. Process mining (PM) can help the monitoring and reporting of this service delivery, measure compliance with guidelines, and assess effectiveness. In this research, PM extracts information about clinical activity recorded in dental electronic health records (EHRs) converts this into process-models providing stakeholders with unique insights to the dental treatment process. This thesis addresses a gap in prior research by demonstrating how process analytics can enhance our understanding of these processes and the effects of changes in strategy and policy over time. It also emphasises the importance of a rigorous and documented methodological approach often missing from the published literature. Aim: Apply the emerging technology of PM to an oral health dataset, illustrating the value of the data in the dental repository, and demonstrating how it can be presented in a useful and actionable manner to address public health questions. A subsidiary aim is to present the methodology used in this research in a way that provides useful guidance to future applications of dental PM. Objectives: Review dental and healthcare PM literature establishing state-of-the-art. Evaluate existing PM methods and their applicability to this research’s dataset. Extend existing PM methods achieving the aims of this research. Apply PM methods to the research dataset addressing public health questions. Document and present this research’s methodology. Apply data-mining, PM, and data-visualisation to provide insights into the variable pathways leading to different outcomes. Identify the data needed for PM of a dental EHR. Identify challenges to PM of dental EHR data. Methods: Extend existing PM methods to facilitate PM research in public health by detailing how data extracts from a dental EHR can be effectively managed, prepared, and used for PM. Use existing dental EHR and PM standards to generate a data reference model for effective PM. Develop a data-quality management framework. Results: Comparing the outputs of PM to established care-pathways showed that the dataset facilitated generation of high-level care-pathways but was less suitable for detailed guidelines. Used PM to identify the care pathway preceding a dental extraction under general anaesthetic and provided unique insights into this and the effects of policy decisions around school dental screenings. Conclusions: Research showed that PM and data-mining techniques can be applied to dental EHR data leading to fresh insights about dental treatment processes. This emerging technology along with established data mining techniques, should provide valuable insights to policy makers such as principal and chief dental officers to inform care pathways and policy decisions.
Table of Contents
ABSTRACT ... 4
INTRODUCTION ... 13
1.1 Background ... 15
1.2 Research Technology Terms ... 16
1.3 Dental Domain Terms ... 21
1.4 Linking Process Mining to Care Pathways and Clinical Guidelines ... 31
1.5 Structure of the Thesis ... 33
LITERATURE REVIEW ... 34
2.1 Previous Literature Reviews & Related work ... 34
2.2 Process Mining Tools, Discovery Algorithms and Techniques ... 36
2.3 Data Mining in Dentistry ... 38
2.4 Review Method ... 39
2.5 Review Results ... 41
2.6 This Research’s Process Mining Vocabulary ... 49
RESEARCH AIMS, OBJECTIVES, AND RESEARCH QUESTIONS ... 64
3.1 Aims ... 64
3.2 Objectives ... 64
3.3 Research Questions ... 65
THE DATA AND THE RESEARCH DATA ENVIRONMENT ... 67
4.1 Research Data Description ... 67
4.2 Data Pipeline Environment ... 87
4.3 System Environment & Architecture... 88
CHALLENGES WHEN APPLYING PM TO ROUTINE DENTISTRY DATA... 90
5.1 Introduction ... 90
5.2 Data Access ... 91
5.3 Data Quality Management in this Research ... 93
5.4 Process Model Quality ... 99
5.5 Data Transforms ... 98
METHODOLOGY ... 104
6.1 Introduction ... 104
6.3 Process Mining Project Methods ... 107
6.4 Extending the Existing Methods for Dentistry Research ... 120
6.5 Policy and Strategy Questions Methodological Approach (RQ4) ... 130
6.6 Conclusion ... 131
VALIDATION OF THE METHODOLOGY: EXPERIMENTS AND RESULTS ... 132
7.1 Introduction ... 132
7.2 Assessing Compliance with Care Pathways and Clinical Guidelines ... 132
7.3 Establishing the Treatment Pathway for a Specific Outcome ... 144
7.4 Assessing the Impact of ‘frequency of screening’ Policies ... 152
7.5 Assessing the Impact of ‘age at first screening’ Policies ... 169
7.6 Rejected Validating Question ... 182
7.7 What Data is Needed in an EHR for Effective PM? (RQ5) ... 183
DISCUSSION ... 194
8.1 Introduction and Overview ... 194
8.2 Reflections on the Approach ... 194
8.3 Managing the Data Environment, the Data Quality, and the Data Analysis ... 195
8.4 Principal Outputs of this Research ... 200
8.5 Limitations of the Study ... 204
8.6 What unique insights does PM bring to analysing healthcare processes? ... 205
8.7 Meanings and Implications for Clinicians and Policymakers ... 206
CONCLUSIONS ... 208
9.1 Review of Research Questions ... 208
9.2 Future Research Opportunities ... 210
APPENDICES ... 222
10.1 Data Management Plan ... 222
10.2 Data Mappings For standardisation and SNOMED ... 224
10.3 BridgesPM1 Data attributes ... 229
10.4 Ethical Approval & Data-Owner Permission ... 234
10.5 Other Governing Documents ... 235
10.6 Anonymisation Standard Planning Record... 236
10.7 Sample Bridges EHR Application screen ... 236
10.8 Medical Questionnaire Questions (Alphabetically) ... 237
10.9 How DMFT is calculated in this research. ... 237
10.10 Posters and Oral Presentations ... 238
10.11 Code Reuse Guide ... 242
10.13 Frequency of Screening Details ... 244
10.14 Age at first screening details ... 258
10.15 Screening Base Data ... 263
10.16 Age at First Screening Process Mining Output ... 265
10.17 Data Quality Issues ... 280
10.18 Data Transforms ... 286
10.19 Data Quality Framework ... 288
10.20 Dental Literature Review Details ... 303
10.21 Application of the ADF ... 310
List of Figures
Figure 1-1: The Data Science Process (O'Neil & Schutt, 2014, p. 41) ... 17Figure 1-2: The Data Scientist's Role (O'Neil & Schutt, 2014, p. 44) ... 17
Figure 1-3: Data and Process Science Skills (van der Aalst, 2016, p. 18) ... 18
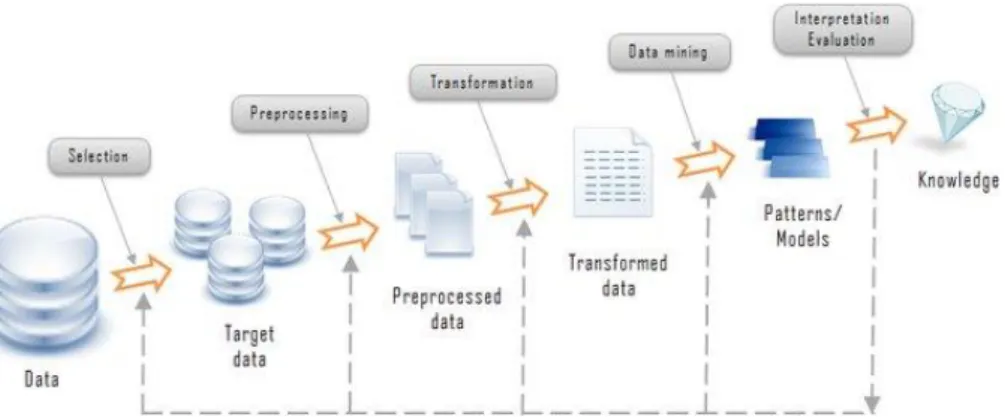
Figure 1-4: Data Mining in the Knowledge Discovery from Databases chain (Dragon1.com, 2018) ... 19
Figure 1-5: Machine Learning Types (Mathworks, 2018) ... 19
Figure 1-6: Process Mining Types and Environment (Mans, et al., 2015, p. 22) ... 21
Figure 1-7: Main kinds of organisational healthcare processes (Mans, et al., 2015, p. 13) ... 23
Figure 1-8: Factors involved in caries development (Selwitz, et al., 2007)... 26
Figure 2-1: Literature search results and removal criteria ... 40
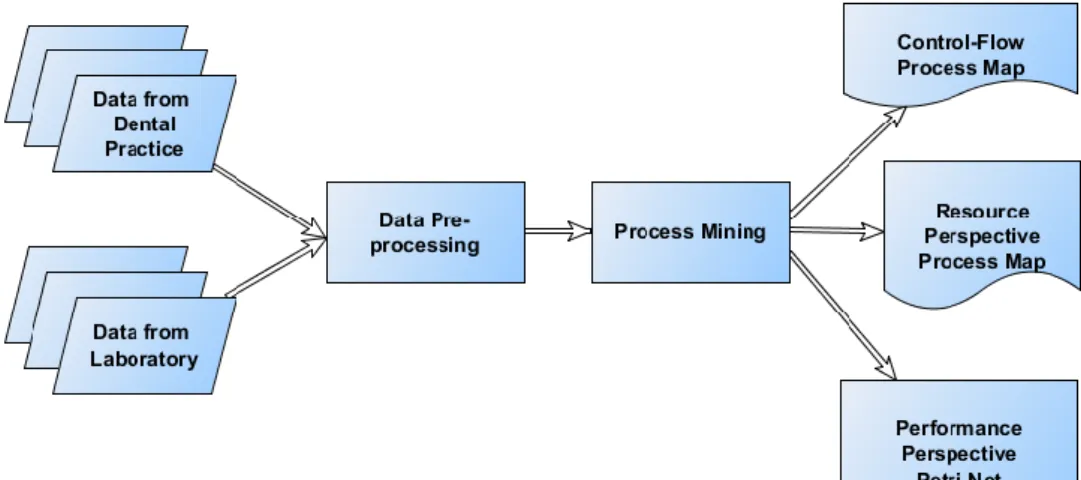
Figure 2-2: Process Mining in Dentistry adapted from Mans et al. (2012) ... 42
Figure 2-3. Evaluating the impact of IT using Process Mining adapted from Mans et al. (2013) ... 42
Figure 2-4: Is your upgrade worth it? adapted from van Genuchten et al. (2014) ... 43
Figure 2-5: Example Process Model ... 53
Figure 2-6: Process Mining Data-level Vocabulary Model ... 54
Figure 4-1: Organisation of Public Dental Services for children in Ireland. (Irish Oral Health Services Guideline Initiative, 2012, p. 12) ... 67
Figure 4-2: Sample Bridges Odontogram ... 68
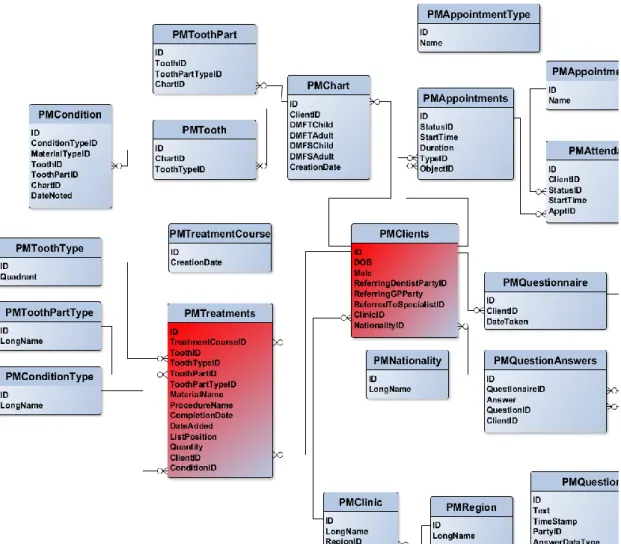
Figure 4-3: Entity Relationship Overview of the BridgesPM1 database ... 72
Figure 4-4: Clients’ year of birth histogram for data collected 1998-2014 ... 75
Figure 4-5: Clients' Nationalities ... 76
Figure 4-6: Procedure counts 1998-2014 ... 77
Figure 4-7: Distribution of DMFT values for patients examined in 2007 ... 78
Figure 4-8: Ages when treatment received for data collected 2000-2015 ... 78
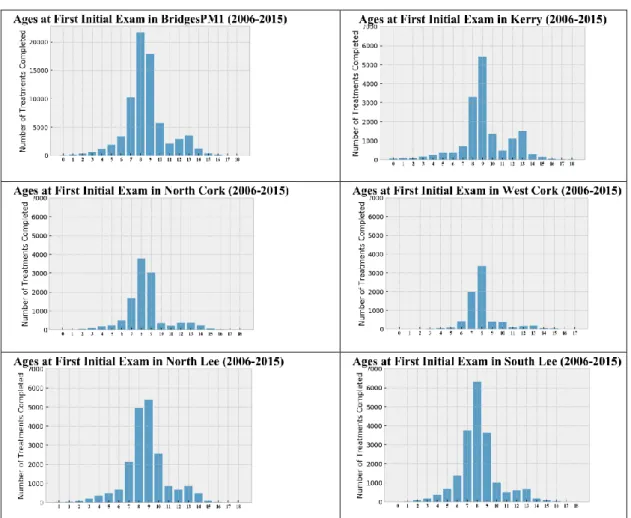
Figure 4-9: Ages at first School Screening Histograms ... 79
Figure 4-10: Geo-map of HSE South high DMFT values (>3). ... 80
Figure 4-11: Population Density (Central Statistics Office (Ireland), 2012, p. 12) ... 80
Figure 4-12: Recorded Medical Conditions and DMFT Distribution ... 82
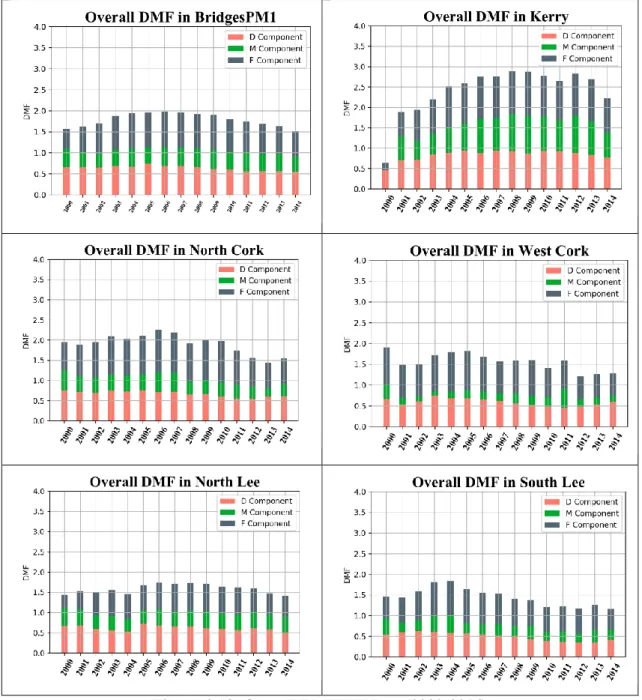
Figure 4-13: Overall DMFT Values (2000-2014) ... 83
Figure 4-14: DMFT Values, by tooth number for two sample years 2005 & 2014 ... 84
Figure 4-15: DMFT Values for the 6s, for the years 2000-2015 ... 84
Figure 4-16: DMFT Heat map, All Areas, All DMFT values, starting 2007 ... 86
Figure 4-17: Data Pipeline Environment ... 87
Figure 4-18: Process Mining Environment (Adapted from Mans, et al. (2015, p. 22)) .. 88
Figure 4-19: System Architecture representation adapted from Santos, et al. (2013, p. 275) ... 89
Figure 6-2: Deduction (top down) & Induction (bottom up) approaches to research ... 106
Figure 6-3: Phases of the methodology (Bozkaya, et al., 2009, p. 23) ... 108
Figure 6-4: Proposed Method for BPA in healthcare (Rebuge & Ferreira, 2012, p. 107) ... 110
Figure 6-5: The Sequence Clustering Analysis subprocess (Rebuge & Ferreira, 2012, p. 108) ... 110
Figure 6-6: L* life-cycle methodology (IEEE, 2011) ... 112
Figure 6-7: PM2 Method Steps... 113
Figure 6-8: Method for the analysis of medical treatment processes (Rovani, et al., 2015) ... 115
Figure 6-9: Question-Driven Methodology for Analyzing Emergency Room Process Using Process Mining (Rojas, et al., 2017)... 116
Figure 6-10: Policy and Strategy Questions Methodology with Example ... 131
Figure 7-1: Proposed Dental Care Pathway (NHS England, 2009, p. 45) ... 133
Figure 7-2: Event Log Characteristics (Care Pathway Compliance) ... 134
Figure 7-3: Routine and Urgent Care Pathway generated from a single week of data. 136 Figure 7-4L Urgent Care Pathway generated from a single week of data. ... 137
Figure 7-5: Routine Care Pathway generated from a single week of data. ... 137
Figure 7-6: Oral Health Assessment Program Proposal (adapted from Irish Oral Health Services Guideline Initiative (2012, pp. 6, 7)) ... 141
Figure 7-7: Fissure Sealant Cycle (Irish Oral Health Services Guideline Initiative, 2010, p. 6) ... 143
Figure 7-8: Number of GA Extractions by age (2004-2014) ... 146
Figure 7-9: Number of Prescriptions by age (2004-2014) ... 146
Figure 7-10: Number of Prescriptions by age - followed by GA (2004-2014) ... 146
Figure 7-11: Process mining frequency analysis of General Anaesthetic Extractions. Temporal sequence for teeth extracted under general anaesthetic between 2004 and 2014 and all preceding events. ... 147
Figure 7-12: Process Mining performance analysis of General Anaesthetic Extraction. Temporal sequence for teeth extracted under general anaesthetic between 2004 and 2014 and all preceding events. ... 148
Figure 7-13: Detail of paths taken between Amalgam Filling and GA Extraction ... 149
Figure 7-14: Frequency of Screening Outcomes Calculation ... 158
Figure 7-15: Default Frequency Model for 2 screenings. Temporal sequence for children receiving their first initial exam in academic year 2005/2006 and all subsequent treatment up to 2015. ... 160
Figure 7-16: Default Performance Model for 2 screenings. Temporal sequence for children receiving their first initial exam in academic year 2005/2006 and all subsequent treatment up to 2015. ... 160
Figure 7-17: Frequency model enhanced with ‘rank’ for 2 Screenings (Kerry). Temporal sequence for children receiving their first initial exam in academic year 2005/2006 and all subsequent treatment up to 2015. ... 163
Figure 7-18: Performance model enhanced with ‘rank’ for 2 Screenings (Kerry). Temporal sequence for children receiving their first initial exam in academic year 2005/2006 and all subsequent treatment up to 2015. ... 163
Figure 7-19: Frequency model enhanced with ‘rank’ for 3 Screenings (West Cork). Temporal sequence for children receiving their first initial exam in academic year 2005/2006 and all subsequent treatment up to 2015. ... 164
Figure 7-20: Performance model enhanced with ‘rank’ for 3 Screenings (West Cork). Temporal sequence for children receiving their first initial exam in academic year 2005/2006 and all subsequent treatment up to 2015. ... 165
Figure 7-22: DMFT at 12/13 by age-at-first-screening for patients with a baseline
DMFT=0 ... 174
Figure 7-23: DMFT at 12/13 by age-at-first-screening for patients with a baseline DMFT>0 ... 175
Figure 7-24: Distribution of times between screenings, ... 180
Figure 7-25: Distribution of times between screenings, ... 180
Figure 7-26: DMFT at age 12/13 & time between ... 180
Figure 7-27: HRM comparison to BridgesPM1 ... 185
Figure 7-28: Data Model extension to cater for Care Pathways ... 189
Figure 7-29: Data Model extension to cater for Diagnosis-Treatment pairs ... 190
Figure 7-30: Data Model extension to cater for CPITN ... 191
Figure 7-31: Data Model extension with Procedure Mappings ... 192
Figure 7-32: Proposed Dental Data Reference Model ... 192
Figure 8-1: Proposed System Architecture adapted from Santos et al. (2013, p. 275) . 202 Figure 10-1: Event Log Characteristics (Frequency of school screening) ... 244
Figure 10-2: Frequency model enhanced with ‘rank & DMFT’ for 2 Screenings (Kerry). Temporal sequence for children receiving their first initial exam in academic year 2005/2006 and all subsequent treatment up to 2015. ... 246
Figure 10-3: Performance model enhanced with ‘rank & DMFT’ for 2 Screenings (Kerry). Temporal sequence for children receiving their first initial exam in academic year 2005/2006 and all subsequent treatment up to 2015. ... 247
Figure 10-4: Frequency model enhanced with ‘rank & DMFT’ for 3 Screenings (West Cork). Temporal sequence for children receiving their first initial exam in academic year 2005/2006 and all subsequent treatment up to 2015. ... 248
Figure 10-5: Performance model enhanced with ‘rank & DMFT’ for 3 Screenings (West Cork). Temporal sequence for children receiving their first initial exam in academic year 2005/2006 and all subsequent treatment up to 2015. ... 249
Figure 10-6: Policy & Screening Profile for Area (Kerry) ... 251
Figure 10-7: Policy & Screening Profile for Area (North Cork) ... 252
Figure 10-8: Policy & Screening Profile for Area (North Lee) ... 253
Figure 10-9: Policy & Screening Profile for Area (South Lee) ... 254
Figure 10-10: Policy & Screening Profile for Area (West Cork) ... 255
Figure 10-11: Event Log Characteristics (Age at 1st school screening)... 258
Figure 10-12: Results for 2 & 3 Screenings, Initial DMFT=0 ... 260
Figure 10-13: Results for 2 & 3 Screenings, Initial DMFT > 0 ... 261
Figure 10-14: Default output from Disco for 6-year olds. Temporal sequence for patients receiving first screening between January 1st, 2004 and December 31st, 2008265 Figure 10-15: Performance output from Disco for 6-year olds. Temporal sequence for patients receiving first screening between January 1st, 2004 and December 31st, 2008266 Figure 10-16: Disco output showing 100% detail, excerpt below right. ... 267
Figure 10-17: Process model detail for age at first screening = 6. Temporal sequence for patients receiving first screening between January 1st, 2004 and December 31st, 2008. ... 268
Figure 10-18: Process model detail for age at first screening = 7. Temporal sequence for patients receiving first screening between January 1st, 2004 and December 31st, 2008. ... 269
Figure 10-19: Process model detail for age at first screening = 8. Temporal sequence for patients receiving first screening between January 1st, 2004 and December 31st, 2008270 Figure 10-20: Process model detail for age at first screening = 9. Temporal sequence for patients receiving first screening between January 1st, 2004 and December 31st, 2008. ... 271
Figure 10-21: First Screening Age 6 – Frequency. Temporal sequence for patients
receiving first screening between January 1st, 2004 and December 31st, 2008 ... 272
Figure 10-22: First Screening Age 6 – Performance. Temporal sequence for patients receiving first screening between January 1st, 2004 and December 31st, 2008. ... 273
Figure 10-23: First Screening Age 7 – Frequency. Temporal sequence for patients receiving first screening between January 1st, 2004 and December 31st, 2008. ... 274
Figure 10-24: First Screening at age 7 – Performance. Temporal sequence for patients receiving first screening between January 1st, 2004 and December 31st, 2008. ... 275
Figure 10-25: First Screening at age 8 - Frequency. Temporal sequence for patients receiving first screening between January 1st, 2004 and December 31st, 2008 ... 276
Figure 10-26: First Screening at age 8 – Performance. Temporal sequence for patients receiving first screening between January 1st, 2004 and December 31st, 2008. ... 277
Figure 10-27: First Screening at age 9 – Frequency. Temporal sequence for patients receiving first screening ... 278
Figure 10-28: First Screening at Age 9 – Performance. Temporal sequence for patients receiving first screening ... 279
Figure 10-29: CP-DQF Entity Relationship Diagram... 290
Figure 10-30: CP-DQF (Step 1) ... 291
Figure 10-31: CP-DQF (Step 2) ... 292
Figure 10-32: CP-DQF (Step 3) ... 293
Figure 10-33: Example of Research Data with Metadata added ... 300
Figure 10-34: Data Flow between multiple environments... 310
List of Tables
Table 2-1: Summary of dental process mining literature analysis ... 45Table 2-2: Summary of Literature’s PM 'types' and 'perspectives' ... 57
Table 2-3: Process Mining Types and Perspectives... 58
Table 4-1: BridgesPM1 Data Classes ... 71
Table 4-2: Recorded Medical Conditions and DMFT Distribution ... 81
Table 5-1: Event Logging Guidelines, adapted from van der Aalst (2016, p. 152)) ... 98
Table 6-1: Process Mining Methods Summary... 119
Table 6-2: Extended Methodology Steps ... 128
Table 6-3: Policy and Strategy Questions Methodology ... 130
Table 7-1: Classes targeted by area, 2005 (from (UCC/HRB, 2005/6) ... 153
Table 7-2: Level of policy attainment* (%) based on the number of patients seen in first targeted year having DMFT=0 ... 155
Table 7-3: Level of policy attainment* (%) based on the number of patients seen in first targeted year having all DMFT values ... 155
Table 7-4: Initial DMFT and Final DMFT for Frequency of Screenings ... 158
Table 7-5: DMFT Distribution at 2nd or 3rd Screening. ... 167
Table 7-6: Summary of the Age at first screening Process Model Characteristics (2004-2008), 3 Screenings, Baseline DMFT=0. ... 178
Table 7-7: Average number of months between 1st & 2nd Screening, and between 2nd & 3rd Screening related to DMFT outcome at 3rd screening, broken down by age at 1st screening ... 179
Table 7-8: HRM Classes mapped to BridgesPM1 Classes ... 186
Table 7-9: HRM Process Steps Classes mapped to BridgesPM1 Classes ... 186
Table 7-10: HRM Medication Classes mapped to BridgesPM1 Classes ... 187
Table 10-1: Base frequency of screening data with patients having initial DMFT=0 .. 256
Table 10-2: Base frequency of screening having initial DMFT >0 values ... 257
Table 10-3: Starting DMFT=0, Number of school screenings =2 ... 261
Table 10-5: Starting DMFT> 0, Number of school screenings =2 ... 262
Table 10-6: Starting DMFT>0, Number of school screenings =3 ... 262
Table 10-7: Base data with patients having initial DMFT=0 ... 263
Table 10-8: Base data with patients having initial DMFT> 0 ... 264
Table 10-9: 27 Data Quality Issues (adapted from (Mans, et al., 2015) ... 295
Table 10-10: Process Characteristics leading to DQ issues adapted from Bose, et al. (2013) ... 296
Table 10-11: Sample of Data Quality Registry entries ... 301
Table 10-12: Data Features from ADF ... 311
Table 10-13: Data Extracted and Anonymisation Steps ... 312
Glossary
ADF Anonymisation Decision Framework ANN Artificial Neural Network
AUC Area Under the Curve
BPR Business Process Reengineering BPI Business Process Improvement BPMN Business Process Modelling Notation BPM Business Process Management
BSODR British Society for Oral and Dental Research CART Classification and Regression Tree
CD Compact Disk
CG(s) Clinical Guideline(s)
CAD/CAM Computer Aided Design/Computer Aided Manufacturing CP-DQF Care Pathway Data Quality Framework
CPI Continuous Process Improvement
CPITN Community Periodontal Index of Treatment Needs CRM Customer Relationship Management
CSV Comma Separated Value Disco Data Mining Software Product DEHR Dental Electronic Health Record
DM Data Mining
DMFT Decayed Missing Filled Teeth (permanent), D is caries to dentinal threshold - D3
dmft Decayed Missing Filled Teeth (deciduous), d is caries to dentinal threshold - d3
DQ Data Quality
ECC Early Childhood Caries EHR Electronic Health Record
EL Event Log
ER Entity Relationship
ERP Enterprise Resource Planning ETL Extract Transform Load
EU European Union
FDI World Dental Federation FS Fissure Sealant
GA General Anaesthetic
GDPR General Data Protection Regulation GUI Graphical User Interface
GUID Globally Unique Identifier HRM Healthcare Reference Model HSE Health Service Executive
ICDAS International Caries Detection and Assessment System
IRC Integrated Research Centre IT Information Technology KPI Key Performance Indicator LIDA Leeds Institute for Data Analytics NHS National Health Service
OHI Oral Health Instruction
OHRSC Oral Health Research Services Centre PCRC Primary Care Research Committee PDM Process Diagnostics Method PHN Public Health Nurse
PODS Process-Oriented Data Science
PM Process Mining
ProM Data Mining Software Product QoL Quality of Life
RCT Randomised Control Trial
ROC Receiver Operating Characteristic curves RQ(s) Research Question(s)
SNODENT Standard Nomenclature for Dentistry SNOMED Standard Nomenclature for Medicine SQL Structured Query Language
TFA Topical Fluoride Application TQM Total Quality Management UCC University College Cork UoL University of Leeds VSM Value Stream Mapping WHO World Health Organisation
Introduction
Process-oriented data science is an emerging discipline dedicated to extracting high-level process knowledge from low-level event data commonly available in organisations’ information systems. It combines traditional process analysis and data-centric analysis and its key tool, process mining (PM), delivers unique insights into the way healthcare is delivered by facilitating the discovery of treatment pathways and the creation of their associated process models. These insights assist in discovering the true care pathways experienced by patients, and subsequently monitoring and enhancing these - a task central to the continuous improvement of care delivery. PM also facilitates both checking the conformance of these models with established models and also the models’ enhancement using additional information from event data such as performance and resource details. This research demonstrates how process-oriented data science techniques can extract information about clinical activity from Dental Electronic Health Records (EHRs) and generate visualisations and process models, providing policy makers with unique, actionable insights into the dental treatment process.
Although these technologies have been applied to healthcare generally, dentistry has been largely ignored. Specifically, the application of these technologies to large datasets such as those available from dental public health EHRs or insurance databases has not been explored. This thesis showcases how PM can be used to illustrate the value of the data in these repositories and how it can be presented in a useful and actionable manner to address public health questions. As an example, identifying the cause of a population’s oral health problems and planning effective interventions is a key function of a dental public health service, however, evaluating the pathways of delivery of such interventions in primary dental care, where the majority of dentistry is delivered, has proven difficult and time consuming. This is where PM shows its worth. As part of a structured methodology documented in this research, PM not only facilitates discovery of the treatment processes experienced by patients but also contextualises this within a strict data provenance protocol and a comprehensive data description and profile.
Importantly, PM is just one step in this research. It does not stand alone. As it is an emerging technology using EHR data, it is anchored in existing, established technologies and PM research methods. The work in this thesis documents the key steps in a robust end-to-end methodology for the application of PM to a dataset extracted from an EHR. For convenience, this methodology is known as PM4D (Process Mining for Dentistry) and is supported by a rigorous data quality assessment. PM4D has distinct steps, each consisting of actions, inputs and outputs, and documentation and artefacts: planning, data
modelling, ethics and permissions, research environment definition and preparation, data extraction, data pre-processing, data quality assessment, data description and profiling, incorporation of EHR considerations, data transforms, PM and analysis, evaluation, and process improvement and support. The methodology is used to address the following questions:
Research Question 1:Can PM discover care pathways, from a dental EHR?
Research Question 2: Can PM help assess compliance of real-world processes with recommended care pathways and clinical guidelines?
Research Question 3:Can PM discover dental care pathways associated with a specific outcome – e.g. extraction under general anaesthetic?
Research Question 4: Is PM and PM4D capable of assessing the impact of policy changes on service delivery and oral health outcomes, from the dental EHR.
To answer these questions, modern data and process mining technologies are being applied to a dataset extracted from an Irish public health dental EHR known as Bridges. This data extract, known as BridgesPM1, contains dental clinical and administrative data on over 200,000 children who accessed Ireland’s dental public health system. It is hoped that this work will inform Irish dental public health policy and be generalisable to the U.K.’s National Health System and other international public health datasets to inform care pathways and policy decisions. The dataset is described in detail in Chapter 4.
The research shows that PM can provide valuable insights and information to stakeholders on the delivery of dental services. Assessing the effects of strategy and policy changes on oral health status and outcomes can be assisted using PM and data mining techniques. These techniques could inform the drive towards optimal service delivery strategies such as remuneration methods, dental contracts, avoidance of unnecessary treatments, and compliance with guidelines and evidence-based principles. The findings will feed back to the Irish public health service and will be generalizable to international public health providers.
Resulting from the application of the methodology and the validating experiments, this research provides a number of valuable developments and potentially publishable advances in the domain:
• Documented an enhanced methodology for PM of dental EHR forming the basis for a method capable of managing the specific requirements of dental research. This would benefit from validation with further datasets.
• Visualisation and profiling of a public health dental EHR. • Proposed data reference model for dental PM.
• Addressing data quality of a public health dental EHR. • Developed and implemented a Data Quality Framework.
• Architecture and environment specification used for PM of dental EHR data. • Demonstration of the flexibility of using EHR data in research. The applied techniques and methods demonstrate flexibility and agility and form the basis for a data product capable of providing ongoing, robust, and actionable insights to domain stake holders.
• Application of the PM4D to data from an Irish public health EHR, validating PM4D and showing how it can be generalised to U.K.’s NHS and other international datasets.
This research does not carry out a detailed comparison of PM products, nor a detailed comparison of PM algorithms. It also does not do a detailed assessment of process model quality using formal metrics.
1.1
Background
One of the first uses of computers in medicine in 1959 can be attributed to a dentist, Robert S. Ledley (November, 2011). From his career as an army dentist through his work at the dental materials section of the National Bureau of Standards he advocated for the application of operations research techniques and computing to medicine. He argued that the vast amounts of medical diagnostic and treatment data could only be exploited using operations research information management techniques and he endeavoured to have these ideas accepted and implemented in the U.S. medical community (Ledley & Lusted, 1959). Early work involved a notched-card system to assist in the diagnosis of disease and this was adapted by Homer R Warner as a Bayesian scheme, again using the notched card system, to assist in the diagnosis of congenital heart disease in the LDS hospital in Salt Lake City (November, 2011). Despite the successful trials of these techniques, they were met with scepticism in the larger medical community. Nonetheless, they laid the groundwork for the extensive uses of information technology in medicine and hospital operation. Their ideas around using existing data to analyse symptoms and develop diagnoses are a precursor to modern day evidence-based medicine. Their beliefs around
the use of information generated as a by-product of operational activities underlies the principles of data mining (November, 2011) and the emergent technology of interest here, process mining.
In this thesis, 60 years later, similar ideas to theirs, but using modern data and process mining technologies, are being applied to a large dataset extracted from an Irish dental public health EHR.
1.2
Research Technology Terms
Data Science
Data science is a multidisciplinary field using scientific processes, algorithms, methods, and systems to extract knowledge, patterns and actionable insights from data. It incorporates skills from many fields including statistics, information science, computer science and mathematics. In 2007, Jim Gray termed it the ‘fourth paradigm’ of science after empirical, theoretical, and computational (Hey, et al., 2009) and anticipated computational analysis of large data being a primary scientific method. He identified three basic activities of data science: capture, curation, and analysis, and suggested that everything about science would change due to the impact of information technology.
In 2013, the IEEE Task Force on Data Science and Advanced Analyticswas founded and in 2013, the "European Conference on Data Analysis (ECDA)" was first organised. The first international conference, the IEEE International Conference on Data Science and Advanced Analytics was launched in 2014.
A definition by Dhar (2013) describes data science as the study of the generalizable extraction of knowledge from data with the requirement that this knowledge is actionable for decision making and prediction, not just explaining the past. The scale of the available data often renders traditional database models and computational methods inadequate. There is a need to provide actionable, robust patterns with predictive power, and patterns that are likely to occur in the future.
In their book “Doing Data Science”, O'Neil & Schutt (2014) propose a data science process model as in Figure 1-1 below where data represents the traces of real-world processes gathered by data collection or sampling methods. They make the important point that building models and working with data is not value neutral. Researchers choose which problems to address, they make assumptions, chose metrics and design the algorithms. In their view, the data-scientist turns the world into data, and this is a subjective, not objective, process. They emphasise the value of exploratory data analysis
for building intuition for the research data, where the creation of histograms, scatterplots, written descriptions, graphs, and summary statistics constitute a vital step before using the data to prove or disprove anything to others.
Figure 1-1: The Data Science Process (O'Neil & Schutt, 2014, p. 41)
O'Neil & Schutt (2014) state that describing and understanding these data-generating processes is often part of the solution to the problems being addressed and point out that in the case of data products, a feedback loop is being created where our behaviour changes the product and the product changes our behaviour and as such brings with it ethical responsibilities. They identify the data-scientist as being involved in all the stages of the data science process as in Figure 1-2 below. i.e. “…a data-savvy, quantitatively minded, coding-literate problem-solver… trained in anything from social science to biology, who works with large amounts of data, and must grapple with computational problems posed by the structure, size, messiness and the complexity and nature of the data, while simultaneously solving a real-world problem.”
Figure 1-2: The Data Scientist's Role (O'Neil & Schutt, 2014, p. 44)
Dhar (2013) outlines a range of skills required of a data-scientist: statistics, machine-learning, computer science, and coding. This range of skills is required due primarily to the volume and variety of the data being analysed today. Wil van der Aalst (2016) proposed an outline of the skills employed by data scientists shown in Figure 1-3 as well as its link to process science through PM.
Figure 1-3: Data and Process Science Skills (van der Aalst, 2016, p. 18)
Wil van der Aalst (2016) defined data science as ‘…an interdisciplinary field aiming to turn data into real value. Data may be structured or unstructured, big or small, static or streaming. Value may be provided in the form of predictions, automated decisions, models learned from data, or any type of data visualization delivering insights. Data science includes data extraction, data preparation, data exploration, data transformation, storage and retrieval, computing infrastructures, various types of mining and learning, presentation of explanations and predictions, and the exploitation of results taking into account ethical, social, legal, and business aspects.’
This thesis incorporates the steps outlined in the data science process in Figure 1-1: The real-world data originates from a dental EHR. A comprehensive pre-processing phase to prepare the data for exploratory analysis and profiling was carried out, and machine learning in the form of PM was executed. Many of the skills identified in Figure 1-3 are employed in the course of the research: knowledge of databases and algorithms to extract, transform and load data in preparation for analysis, data mining, PM, and visualisation for exploration and analysis, some statistics for evaluation of results, domain knowledge for formulation of the research questions (RQs), and for discussion of the outcomes and results. The resulting applied techniques and methods demonstrate flexibility capable of providing ongoing, robust and actionable insights to domain stake holders, satisfying a key data science attribute of having a clear focus on its organisations’ goals.
Data Mining
Data mining is the process of seeking and extracting patterns from previously incomprehensible large datasets and this author views data mining as a key subset of the
data science process, primarily involving the steps: data pre-processing, data cleaning, exploratory data analysis and machine learning. It is also commonly referred to as a step in the Knowledge Discovery from Databases (KDD) process using data analysis and discovery algorithms to yield patterns (or models) based on the data (Santos, et al., 2013). Data mining can be broadly categorised into ‘descriptive’ and ‘predictive’, the former includes association, classification and clustering activities and the latter, correlation and regression.
Figure 1-4: Data Mining in the Knowledge Discovery from Databases chain (Dragon1.com, 2018)
This author views PM as a data mining technique and generally follows the steps identified in Figure 1-4.
Machine Learning
Machine learning is a set of artificial intelligence techniques and algorithms designed to extract patterns from large datasets, without being explicitly programmed. Typically, machine learning algorithms find similarities between group of items (classification and clustering) or find relationships between variables (correlations, associations). Some of the common machine learning types are shown in Figure 1-5 below.
Figure 1-5: Machine Learning Types (Mathworks, 2018)
This author views PM as a form of unsupervised machine learning, creating clusters of similar items on data that has not been previously labelled or categorised.
Data Visualisation
Data visualisation facilitates the communication of complex information using graphical representations. Its aims to display the data in a compact, accurate, unbiased form. It converts large datasets into visually comprehensible formats such as histograms, plots, and information graphics. Stephen Few (2004) enumerated eight types of quantitative relationships, including frequency distributions, nominal comparison, correlations, and ranking and identified the optimal format for their graphical representation. Since then, many new visualisations have emerged including bubble graphs, heat maps etc. to visualise more complex data, many of which are used in this research (see Section 4.1.6).
Process-Oriented Data Science
Process-oriented data science (PODS) is an emerging research area bridging traditional process analysis and data-centric analysis. PODS studies the sequences of events in processes and is not solely focussed on outcome measures or the results of data mining experiments. Timestamped, case-oriented, event data is the main source of information for PODS. The principal data mining technique in use in PODS is PM.
Process Mining
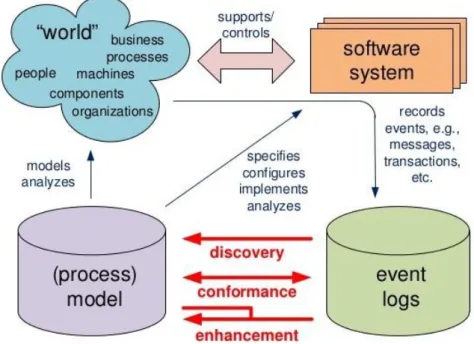
Process Mining (PM) is the collection of techniques and algorithms applied to event data with the objective of discovering, checking and enhancing process. It is an emerging data mining technique aiming to extract high level knowledge from low level data. PM has been positioned in the field of business process management, business intelligence, and lean technologies by van der Aalst (2016, p. 44) and by Schrijvers et al (2012). It is seen as bridging the gap between traditional model-based process analysis and data-centric analysis such as data mining (Mans, et al., 2015, p. 5). It does this, first, by discovering process models from event data, i.e. time ordered data extracted from an organisation’s information systems. These models are abstract representations of the essence of a process reflecting the common pathways followed and are used for many purposes within organisations including configuration, specification, documentation and verification of systems. They are also used to give insight and to provide a structured basis for discussion of the processes (van der Aalst, 2016, p. 29). The second main type of PM, conformance checking, establishes to what degree event logs agree with existing process models. The third type enhances models with additional information and is known as process enhancement. This environment is commonly represented as in Figure 1-6 below.
Figure 1-6: Process Mining Types and Environment (Mans, et al., 2015, p. 22)
Event data contains time-ordered lists of discrete activities or events i.e. well-defined steps in processes and an event log (EL) is a subset of this event data created for the purposes of executing a single experiment. The most basic EL contains a case-identifier, an event name and a timestamp. The quality of a process model will primarily be determined first, by whether the discovered process model generates all the behaviour in the log and second, by how close is behaviour of the discovered process to the behaviour of the original process. The comprehensibility of the discovered model and to what extent it is generally applicable are other important characteristics.
1.3
Dental Domain Terms
Dentistry
According to the American Dental Association (2018), dentistry is defined as the evaluation, diagnosis, prevention and/or treatment (nonsurgical, surgical or related procedures) of diseases, disorders and/or conditions of the oral cavity, maxillofacial area and/or the adjacent and associated structures and their impact on the human body; provided by a dentist, within the scope of his/her education, training and experience, in accordance with the ethics of the profession and applicable law.
In layman’s terms it is the profession of caring for the human mouth, teeth and other related health matters. This manifests as creation of oral health, prevention and treatment of dental disease and restoration of damage to the teeth and the mouth. Disease of the teeth usually starts with carious lesions in the tooth surface, also known as caries which can then progress to cavities or holes in the tooth surface Disease at this level is commonly
treated through restorative measures such as fillings and in more extreme cases, crowns and bridges, implants, and extractions.
In what ways is dentistry different and similar to general healthcare?
Although relief from toothache has been mentioned in medical texts as far back as Hippocrates, dentistry and medicine have traditionally been separate occupations. During the 17th century dentistry was often carried out in the barber’s chair – by the barber (Hoffmann-Axthelm, 1981, p. 161) (Ring, 1985, p. 150), while medicine was already well established as a profession at that time. Dentistry was initially seen as a primarily mechanical job, fixing and extracting diseased teeth (Hoffmann-Axthelm, 1981, p. 159) and those carrying out the activities in Germany were often known as the Zahnbrecher
(‘tooth-breakers’). In 1840, at the University of Maryland in Baltimore, the introduction of dentistry as a medical speciality was rejected and as a result, the first dental college in the world was opened – the Baltimore College of Dental Surgery.
Clearly, things have changed since these early days and there is now wide acceptance that oral health influences general health (World Dental Federation, 2016) and a concerted effort to ‘put the mouth back in the body’ is leading to closer ties between the professions. However, dental schools are still typically separate from medical schools, as are dental and medical hospitals. Dental insurance and medical insurance are normally separate products, as oral problems are often seen as inevitable, even if often preventable.
For the purposes of this research it is assumed that dentistry is a branch of medicine and is a form of healthcare. As with general healthcare, dentistry is delivered at three different levels. Primary care deals with common problems such as examinations, cleanings, and restorative work and is often the first point of contact for a patient. Secondary care is typically more specialised such as periodontal procedures, endodontics etc. and normally requires referral from primary care in Ireland and in the U.K. Tertiary care involves rare and complex conditions and can arise for example from trauma incidents or special-needs patients.
The classification of healthcare processes shown in Figure 1-7 is directly transferrable to dental care – the main categories of ‘Non-elective care’ and ‘Elective care’ and the subcategories of ‘Emergency’ (e.g. trauma), ‘Urgent’ (e.g. pain or abscess), ‘Standard’ (e.g. screening), ‘Routine’ (e.g. simple filling) and ‘Non-Routine’ (e.g. root canal treatment), are all directly applicable to dental treatment.
Figure 1-7: Main kinds of organisational healthcare processes (Mans, et al., 2015, p. 13) This research assumes that dental treatment processes and healthcare processes are similar enough allowing us to use existing healthcare PM research and publications as the basis for this research.
Healthcare processes are also subject to a separate categorisation: medical treatment processes and organisation processes (Kaymak, et al., 2012; Rojas, et al., 2015), the former being clinical processes managing the patients and the later focussed on knowledge necessary to coordinate collaborating healthcare professionals and units without support for medical decision making.
Public Health Dentistry
While acknowledging that public health dentistry is organised differently in different countries, the American Dental Association (2018) defines it as “…the science and art of
preventing and controlling dental diseases and promoting dental health through organized community efforts. It is that form of dental practice which serves the community as a patient rather than the individual. It is concerned with the dental health education of the public, with applied dental research, and with the administration of group dental care programs as well as the prevention and control of dental diseases on a community basis”. Dental public health has also been defined “as the science and practice of preventing oral diseases, promoting oral health and improving quality of life through the organised efforts of society” (Daly, et al., 2013). It is concerned with promoting oral health of the population as a whole by, diagnoses of the population’s oral health problems, to identify the cause of these problems and planning effective interventions to target identified problems leading to action at the community level. The World Health Organisation (WHO) recognises the importance of public health intervention against early childhood caries (ECC) (Phantumvanit, et al., 2018).
Public health dentistry contrasts with private dental practice where private practices are often owned by a dentist, a group of dentists, or a corporate body for the purposes of
delivering dental services to individuals. In Ireland, a child’s first contact with dental services will often be through the public health school screening program. In the U.K., private practices are the first point of contact for patients who require dental treatment or oral health maintenance.
Oral health
The World Dental Federation (2016) defines oral health as being “… multi-faceted and includes the ability to speak, smile, smell, taste, touch, chew, swallow and convey a range of emotions through facial expressions with confidence and without pain, discomfort and disease of the craniofacial complex”. The World Dental Federation (FDI) definition
proposes a common understanding of oral health in order to: clearly position oral health within general health, demonstrate that oral health affects general health, raise awareness of the different dimensions of oral health and how they shift and change over time and empower people by acknowledging how values, perceptions and expectations impact oral health outcomes.
How are oral health outcomes measured?
There are many established measures of oral health and the suitability and availability of some of these for our research were considered e.g. DMFT, Quality of Life (QoL), International Caries Detection and Assessment System (ICDAS https://www.iccms-web.com/). Potential quality outcomes were also proposed in the Steele Report (NHS England, 2009, p. 66) e.g. the increase or decrease in the rate of restoration and the rate of antibiotic prescription. Significant Caries Index (Sic Index) (Brathall, 2000) is another option to measure disease where the attention is focussed on those individuals with the highest caries scores in the population. It is a recognition of the high number of individuals with no detected disease and the resulting skewedness of DMFT to 0. For clarity, a DMFT score of 0 means that none of a person’s 32 permanent teeth are decayed, missing, or filled i.e. it is the ‘perfect’ score in terms of caries. However, it does not take account of tooth loss due to other reasons such as trauma or periodontal disease.
For this research, the only criterion in deciding which oral health outcome to use was a pragmatic assessment of what information is present in the EHR to help assess oral health. The results of that assessment showed that the EHR had no information on QoL and the recorded caries information was insufficiently detailed for an ICDAS assessment. While the necessary data was present in the EHR to calculate DMFT, again, insufficient data was present to calculate its more detailed variants. Accordingly, DMFT was selected as
the outcome measure for this research. Other more detailed indices such as ICDAS should be considered in future EHR designs as they give further insight into the degree of disease present.
DMFT, D3cMFT, D3vcMFT
‘DMFT’ is a measure of tooth decay in permanent teeth and has three components. D refers to the number of decayed teeth where caries is to dentinal threshold as is more accurately represented as D3. DMFT is used throughout this thesis as shorthand for
D3MFT. M refers to the number of teeth missing due to decay. F refers to the number of
teeth filled due to decay. The use of capital letters indicates that the index applies to permanent teeth only. ‘dmft’ is the same measure but applied to primary teeth only. A DMFT score of 0 means none of the 32 permanent teeth are diseased, missing or filled due to decay. If a patient had 1 tooth extracted for decay, 1 filling due to decay, and 1 cavity, their DMFT score would be 3.
While DMFT has been in use for over 60 years (Broadbent & Thomson, 2005) as an index of oral health, it has well documented shortcomings such as its failure to recognise the presence of non-cavitated lesions and the fact that caries is a continuum rather than a present-absent dichotomy (Lewsey & Thomson, 2004). There are also many factors influencing the development of caries in individuals as shown in Figure 1-8 below (Selwitz, et al., 2007; O’Mullane, et al., 2016; Petersen, 2008). Many of these are personal factors such as smoking, oral hygiene and socio-economic status while others are related to the presence of fluoridation of water supplies etc. The World Health Organisation (WHO) examination criteria dictate that only dental caries at the cavitation level are recorded. This is known as D3cMFT with the ’3’ indicating that the caries is recorded at
the dentinal level and the ‘C’ indicates that the lesion is cavitated (Whelton, et al., 2006). Acknowledging that dental caries is a disease of stages and acknowledging that increased access to dental services could give misleading D3cMFT readings, a further refined
measure, D3vcMFT, incorporates visible but not cavitated lesions. However, DMFT
remains widely used and accepted because of its usefulness and the need to make historical comparisons (Lewsey & Thomson, 2004). From the perspective of EHR data requirements, less information is needed to estimate DMFT than more sophisticated indices such as ICDAS. The mechanism used to calculate DMFT/dmft from the data extract is detailed in Appendix 10.9.
Figure 1-8: Factors involved in caries development (Selwitz, et al., 2007)
Care Pathways and Clinical Guidelines
Schrijvers et al. (2012) defined care pathways as ‘…a methodology for the mutual decision making and organisation of care for a well-defined group of patients during a well-defined period’. They detail essential steps in the care of patients with specific problems. According to Schrijvers et al., care pathways have their roots in established management theories such as the Critical Path Method, Lean Engineering, and Six Sigma with the goal of improving quality while reducing duration times and error-risk, reducing treatment variations, and reducing costs. While care pathways were originally introduced in the U.S. to standardise processes and reduce costs, other countries are using them mainly to achieve improvements in quality of care, and in the U.K. their use aims to achieve continuity of care across care settings and disciplines (Harris & Bridgman, 2010). Care pathways are often confused with care protocols and Harris & Bridgman state the term ‘care pathway’ denotes a distinctive type of clinical guideline, specifying each step in the care process, rather than stating broad principles that practitioners should follow. Care pathways are also seen as offering a structured means of implementing
evidence-based clinical guidelines though the development of local protocols (Campbell, et al., 1998). Examples of care pathways in dentistry in the U.K. are to be found in the Steele Report (NHS England, 2009) and in the NICE guidelines (National Institute for Health and Care Excellence, 2018).
Evidence-based clinical guidelines (CGs) are systematically developed statements containing recommendations for the care of individuals by healthcare professionals that are based on the highest quality scientific evidence available (Irish Oral Health Services Guideline Initiative, 2012). CGs are specific recommendations on how to diagnose and treat a medical condition to ensure that patients receive appropriate treatment and care. They summarise the current medical knowledge and give specific recommendations based on this knowledge. For example, clinical guidelines published in Ireland describe the ideal process for applying fissure sealants and are to be found in the Irish Oral Health Services Guideline Initiative (2010) and for providing an oral health assessment for school-aged children in a second publication (2012).
For the purposes of this research, care pathways are viewed as guiding the overall treatment process of the patients whereas clinical guidelines are viewed as focussed on specific dental treatments. In this research, we will investigate process mining’s potential to generate process models that can be compared to the referenced care pathways and clinical guidelines.
Oral Health Strategy and Policies
Oral health policies take many forms. These include population-wide oral health promotion measures, policies addressing social determinants, route epidemiological data collection and the integration of oral diseases in policies addressing non-communicable diseases and general health (World Dental Federation (FDI), 2017). However, measuring the effectiveness of policy decisions and strategies is difficult. Daly et al. (2013) state that the evaluation of population-based prevention is particularly difficult to undertake, especially measuring success by examining changing patterns of disease. They propose that other types of evaluation such as the success of the process and investigating how many people participated in the screening program may be useful. It is hoped that the research in this thesis contributes to establishing methods of evaluating such processes and programs.
School Dental Screenings
Dental screening generally refers to the brief oral examination of children, usually in the school setting, in order to identify those with obvious treatment needs (Irish Oral Health Services Guideline Initiative, 2012). In Ireland school dental screenings are provided by the public health service as detailed in Chapter 4. In the UK’s National Health Service (NHS), dental screening’s role developed from securing treatment in times of widespread decay, to identifying children not in receipt of regular dental care, early detection of disease, and stimulation of registration with a dentist (Milsom, et al., 2008).
Why do Screenings? Are they Useful?
Internationally, the WHO argues that school-based oral health promotion is effective and efficient (World Health Organisation, 2003, p. 17). Screenings enable early detection and timely interventions against oral diseases and conditions leading to substantial cost savings. They must not necessarily be carried out by dentist or dental auxiliaries (World Health Organisation, 2003, p. 45). This latter point does not reach the recommended best practice of carrying out examinations in dental clinics as proposed in the Irish Oral Health Services Guideline Initiative (2012, p. 18). Hebbal & Nagarajappa (2004) found that screening increases follow-up visits. There is significant debate on this issue and another study by Milsom et al. (2006) found this not to be the case.
The function of examinations can include primary preventive measures e.g. oral health advice, application of fluoride gels or varnishes as well as secondary preventive measures e.g. limiting the progression of oral diseases (Riley, et al., 2013). A preventive program based on caries risk and recall intervals was shown to reduce initial caries lesions in children (Abanto, et al., 2014).
Clinic based screening is seen as the gold standard with school-based screening more likely to only identify children with more advanced caries (Irish Oral Health Services Guideline Initiative, 2012).
The usefulness of school dental screenings in improving dental attendance rates or reducing disease levels has been questioned by Milsom et al. (2006) where the authors tested three models of screening and a control, on a population of 13,000 children. They found no significant difference in caries reduction in either the deciduous or permanent teeth, nor did they find any significant difference in the secondary outcome measures, prevalence of sepsis, gross plaque, calculus or trauma. While they did acknowledge the short timeframe of the study, they also found no significant difference in dental attendance between the groups in the four-month period following the screening date.
Further work suggested that, notwithstanding considerable U.K. government support since 1918, no scientific evidence exists that school dental screening leads to improvements in health for the individual children or for the child population as a whole (Milsom, et al., 2008) and in fact, such screening exacerbated social division. While scrapping of school dental screening is not being advocated-for in those publications, the authors encourage development of clear objectives for such screenings and for scientific evaluation of the data available from those countries with such programs.
In contrast, a retrospective cohort study investigating the effects of dental recall visit intervals on the oral health of Irish school children by Brody (2016) concluded that children having one oral health assessment in 2nd class (Age ~ 7-9) had significantly higher levels of tooth decay at 6th class assessment (Age ~ 11-13) than children who received an additional oral health assessment in 4th class (Age ~ 9-11). The children receiving only two assessments were also found more likely to have attended for an emergency visit for pain in a permanent tooth in the period between assessments.
There are varying opinions on the effectiveness of school dental screenings and this research addresses aspects of this in the following sections and again in Section 7.4.
When should screenings be done?
As permanent molars account for at least 80% of the caries in children’s permanent teeth in Ireland, the age at emergence of the first and second permanent molars is a key milestone for oral health assessment. The second key milestone is the emergence of the permanent maxillary canines (Irish Oral Health Services Guideline Initiative, 2012, p. 18). The guideline goes on to suggest that the periods between the ages 5-7 and 11-14 are the most crucial for regular assessment to prevent and treat caries and monitor oral health development.
How often should dental recalls be done?
The ideal interval for recalling dental patients is also an active discussion. The Cochrane Database Systematic Review on Recall intervals for oral health in primary care patients. Riley et al. (2013) looked at the evidence around varying recall intervals’ effects on oral health and resources. This review updated earlier work by Beirne et al. (2005; 2007) and confirmed the original work’s position, namely that there is a very low-quality body of evidence which is insufficient to draw any conclusions on the effects of altering the recall interval between dental check-ups. Further, they recommended that high quality Randomised Control Trials (RCTs) be carried out to address this question. Abanto et al.
(2014) found that each follow-up visit attended reduced new initial lesions in children although they acknowledge that these patients were also receiving oral health and dietary advice during their visits which may have impacted their findings.
Although the U.K. NHS does not explicitly recommend a recall interval, its remuneration structure supports six-monthly checks. In their systematic review, Davenport et al. (2003) found no existing high-quality evidence to support or refute six-monthly recall intervals in adults or children. They identify risks of lengthening recall intervals as moving away from the preventive paradigm and consequently more serious sequelae of caries, e.g. infection or extraction, as well as reduced contact with patients and accordingly, a loss of opportunity to encourage better oral hygiene and treatments. They identified possible advantages of lengthening the recall interval as, reducing inappropriate treatment and reduction in costs. The review noted the heterogeneous nature of the previous work and the difficulty comparing the studies.
A risk-based maximum recall interval of 12 months for patients is recommended in the NICE Clinical Guideline (National Institute for Health and Care Excellence, 2004). This may be reviewed subject to the outcome of the ongoing INTERVAL (Investigation of NICE Technologies for Enabling Risk-Variable-Adjusted-Length Dental Recalls Trial)
Dental Recalls Trial expected in 2019 ( BioMed Central Ltd, 2018). This risk-based approach, with a suggested maximum interval of 12 months for children in Ireland is supported by clinical guidelines (Irish Oral Health Services Guideline Initiative, 2012). Discovering care pathways around these principles and investigating the potential application of PM and data analysis of dental EHR data to answer related questions forms the basis of much of this research.
Initial Exams, School Screenings, Recalls, Recall Intervals & Check-ups.
This research treats ‘school screening’ as analogous to a ‘recall visit’ which was defined as ‘the planned, unprecipitated return of a patient who, when last seen was in good oral health’ (Royal College 1997, as cited in Riley et al. (2013), when a ‘recall examination’, ‘routine dental check-up’, or ‘oral health review’ may be carried out (Riley, et al., 2013). The recall interval is the time between recall examinations and is usually specified in months or years. The policy governing the frequency at which school screenings are carried out is then directly related to the recall interval as presumably, a policy dictating 3 screenings in the primary school setting will have a shorter recall interval between screenings than a policy dictating 2 screenings. In the research’s data, detailed in Chapter 5, the treatment item known as ‘Initial Exam’ in the research dataset is a ‘school