i
PhD
Thesis
2017:
Part One
What effect does ‘pre-failure recovery’ have on customer satisfaction?
Author: Ursula Patricia
Josephine Furnier, URN:
6245157, Integrated PhD
in Management
ii Executive Summary
When a company identifies an unavoidable service failure, they do not always inform customers or initiate activities to minimise the negative effects. Thus, customers are exposed to service failures and companies are faced with the issue of recovering. This thesis studies the effect of pre-failure service recovery on customer satisfaction. Also, the joint effect of pre-failure recovery and criticality on customer satisfaction is examined.
A critical review of the literature on service failure and recovery is presented drawing upon the underlying theories of disconfirmation of expectations theory, justice theory, and prospect theory. From this, a conceptual model and hypotheses have been developed and put forward. A non-probability quota sample is employed. Using a 2x2x2 scenario based experimental design, T-Tests and 2-way between-groups analysis of variance are used.
Results show pre-failure recovery can aid the service recovery process and heighten customer satisfaction in the face of inevitable unavoidable service failure. This research adds a new step in the service recovery process extending the literature on service failure, service recovery, and criticality.
The implications of this research are that through using pre-failure service recovery, the damage of an inevitable unavoidable service failure can be minimised resulting in higher satisfaction. Consumers appreciate honesty and upfront service providers regardless of whether they are in a time critical situation or not. A practical implication is that before considering compensation, service providers could use pre-failure recovery as this may be
iii enough for recovery (and if not then it will make recovery easier and the provider could offer less compensation). This could save providers money. Future studies could consider other forms of pre-failure recovery and their effect on satisfaction. The present study could be extended into other service sectors. Furthermore, researchers could examine pre-information and post-information to compare the two and their effects on satisfaction.
iv Declaration of Originality
This thesis and the work to which it refers are the results of my own efforts. Any ideas, data, images or text resulting from the work of others (whether published or unpublished) are fully identified as such within the work and attributed to their originator in the text, bibliography or in footnotes. This thesis has not been submitted in whole or in part for any other academic degree or professional qualification. I agree that the University has the right to submit my work to the plagiarism detection service TurnitinUK for originality checks. Whether or not drafts have been so-assessed, the University reserves the right to require an electronic version of the final document (as submitted) for assessment as above.
v Acknowledgements
Firstly, I would like to thank my supervisors Jane Hemsley-Brown, Christoph Teller, and Arne Floh for all their support and guidance. I have learned much from you and will take these lessons into my career. Thankyou also to Alf Crossman, teacher and friend.
A very special thankyou to my Mum, Patricia Anne Foster for all your love and support throughout my PhD. I would not be where I am now without you. Despite me driving you up the wall on more than several occasions you have stood by me all the way.
Finally, a very special thankyou goes to all my loving friends of whom are too many to name. I would however like to especially thank Lucas Townsend and Kevin Swinney who have been by my side through some very tough times and have seen me through to the end. It is the love and support of my friends that has meant the world to me and kept me strong along my journey. I don’t know what I would have done without all of you.
Also, a special thankyou to the cat with no name who sometimes kept me company while number crunching.
vi
“Smile” Charles Chaplin
“These parts of the work should be called: “a best means for
getting a headache
!” Vladimir Lenin
vii
Contents
1.
Chapter One
1.1 Introduction: Service failure, pre-information and customer satisfaction, pp. 1-2
1.2 Research Questions and Objectives, pp.2-3 1.3. The contribution of this research, pp. 3-5 1.3.1 Theoretically, pp. 3-5
1.3.2 Practically, p.5
1.4 Service context: restaurants, pp.6-8 1.5 Summary, p.8
1.6 Structure of thesis, pp.8-9
2.
Chapter Two. Literature review part one: Service Failure and
Service recovery
2.1 Introduction, p. 10
2.2 A definition of 'service' and a look at the services industry, pp.10-12 2.3 A definition of service failure, pp. 13-14
2.4 Forms of service failure, pp. 15-16
2.5 The importance of service failure the implications it has, pp. 16-17 2.6 The factors that affect service failure, pp. 17-32
2.6.1 Severity of the failure, pp.17-18 2.6.2 Criticality, pp.18-20
viii 2.6.3 Failure type, pp.20-24 2.6.4 Attribution of blame, pp.24-25 2.6.5 Locus of control, pp.25-27 2.6.6 Stability, pp.27-29 2.6.7 Controllability, pp. 29-31 2.6.8 Summary of attribution, pp. 31-32 2.7 Defining Service Recovery, p. 32
2.8 The importance of service recovery and what it can lead to, pp. 32-34 2.9 What affects service recovery and its success, pp. 34-60
2.9.1 Type of failure experienced, p. 35 2.9.2 Type of compensation, pp. 35-41 2.9.3 Speed of recovery, pp. 41-42 2.9.4 Front line empowerment, pp. 42-44 2.9.5 Employee effort, pp. 44-45
2.9.6 Who initiates the service recovery, pp. 45-46
2.9.7 Disclosure of the service failure to consumers, pp. 46-52 2.9.8 Explanations, pp. 52-59
2.9.9 Whether the service failure is overcome, pp. 59-60 2.10 Research gap, pp. 60-62
2.11 Summary, p. 62
3. Chapter Three. Literature Review Part Two: Theoretical
Underpinnings
ix 3.2 Expectations, p. 63
3.2.1 Expectations and their types, pp.63-69 3.3 Disconfirmation, pp. 69-73
3.3.1 Disconfirmation and satisfaction, pp. 69-73 3.4 The stability of customers’ expectations, pp. 73-74 3.5 Summary, p. 74
3.6 Antecedents of service and service recovery expectations, pp. 74-75 3.6.1 Antecedents of expectations of service quality, pp. 75-76
3.6.2 Previous experience with service provider and word of mouth, pp. 76-79 3.6.3 Tangibles, pp. 79-80
3.6.4 Explicit service promises, pp. 80-81 3.6.5 Service guarantee, pp. 81-82 3.6.6 Advertising, p. 83 3.6.7 Summary, pp. 83-84 3.7 Expectations of recovery, pp. 84-86 3.7.1 Severity of failure, pp. 86-87 3.7.2 Customer loyalty, pp. 87-90
3.7.3 Perceived service quality, pp. 90-91
3.7.4 The effect of antecedents on expectations, p. 91 3.8 Justice/Equity theory, pp. 91-94
3.8.1 Types of justice, their importance, and effect on customer satisfaction, pp.94-100
3.8.2 Additional factors which influence consumer perceptions of justice, p. 100
x 3.10 A summary, pp. 102-104
3.11 Customer satisfaction, pp. 104-107 3.11.1 Definition, pp. 104-105
3.11.2 Outcome of Customer Satisfaction, pp. 105-107 3.12 Summary, p. 107
4. Chapter Four: The conceptual model and the hypotheses
4.1 Introduction, pp.108-110
4.2 Hypotheses and conceptual model, pp. 110-130 4.2.1 Main effects: Pre-Information, pp. 110-115 4.2.1.1 Customer satisfaction, pp.110-111
4.2.1.2 Perceived service failure severity and customer expectations of service recovery, pp.111-112
4.2.1.3 Disconfirmation, pp.112-113 4.2.1.4 Perceived Justice, pp.113-115
4.2.2 Main effects: Compensation, pp.115-119 4.2.2.1 Customer Satisfaction, pp.115-116 4.2.2.2 Severity of failure, p.116
4.2.2.3 Expectations of Service Recovery, p.117 4.2.2.4 Disconfirmation of Expectations, pp. 117-118 4.2.2.5 Justice, pp. 118-119
4.2.3 Main effects: Criticality, pp. 119-122 4.2.3.1 Customer Satisfaction, p.119-120
xi 4.2.3.2 Severity of Service Failure and Expectations of service recovery, pp.120-121
4.2.3.3 Disconfirmation of Expectations, p. 121 4.2.3.4 Justice, p. 122
4.3 Interaction effects, pp. 123-128 4.3.1 Customer satisfaction, pp.123-124 4.3.2 Severity of Service Failure, pp.124-125
4.3.3 Expectations of Service Recovery, pp. 125-126 4.3.4 Disconfirmation of Expectations, pp.126-127 4.3.5 Justice, pp.127-128
4.4 Summary, p.129
5.
Chapter Five: Methodology
5.1 Introduction, p. 131 5.2 Epistemology, pp.131-136
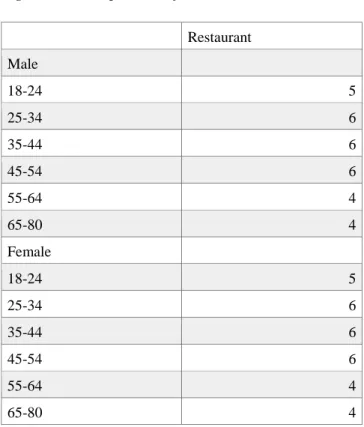
5.3 Empirical Research Design, pp.137-143 5.3.1 Sample Design , pp.137-139
5.3.2 Sampling method, pp.139-141 5.3.3 Sample size, pp.142-143
5.4 Dealing with non-response, p. 144 5.5 Data collection Method, pp. 144-168
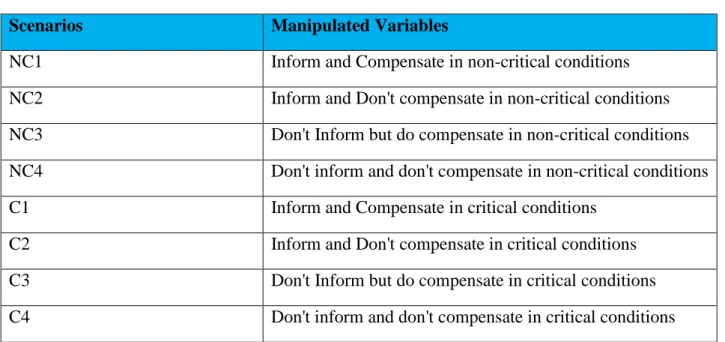
5.5.1 Manipulated variables and manipulation checks, pp. 149-150 5.5.2 Mediating Variables, p.150
xii 5.5.4 Variables that are controlled for, pp.152-154
5.5.5 Control variables, pp.154-156 5.5.6 Measurements, p.156
5.5.7 Overall satisfaction, p.157
5.5.7 Satisfaction with service recovery, p.157 5.5.8 Dimensions of justice, p.158
5.5.9 Disconfirmation, p.159
5.5.10 Expectations of service recovery, p.159 5.5.11 Perception of service failure severity, p.160 5.5.12 Control, pp.160-161
5.5.13 Manipulation, p.161
5.6 The questionnaire, pp.162-168 5.6.1 Questionnaire design, pp.162-163 5.6.2 Order of the questionnaire, pp.163-164 5.6.3 Questionnaire format, pp.164-166
5.6.4 Mode of questionnaire administration, pp.166-168 5.7 Data Analysis, pp.168-176
5.7.1 Testing assumptions using descriptive statistics, p.168 5.7.2 Checking for normal distribution of data, pp.168-169 5.7.3 Testing for homogeneity of variance, pp.169-170 5.7.4 Testing for outliers, p.170
5.7.5 Missing data, p. 171
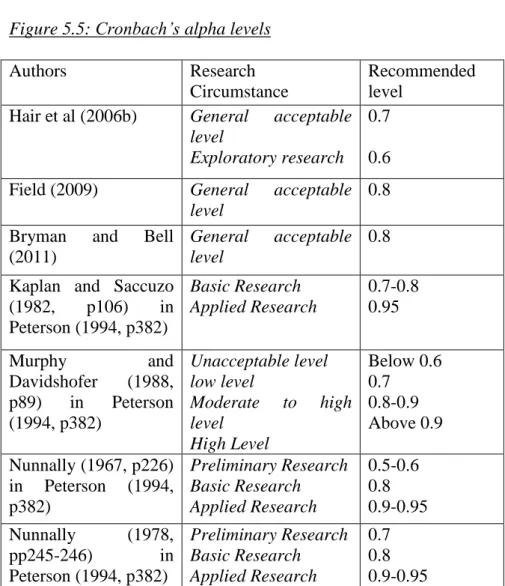
5.7.6 Assessment of reliability, pp.171-172 5.7.7 Assessment of Validity, p.173
xiii 5.7.9 ANOVA, p.175
5.7.10 2-Way Between-Groups ANOVA, p. 176 5.8 Summary, p.176
6.
Chapter Six: Pilot Study (Part Two of PhD Thesis)
6.1 Introduction, p.178 6.2 Pre-pilot test, pp.178-199
6.2.1 Interviews as a data collection method, pp.180-181 6.2.2 Sample size and method, pp.181-182
6.2.3 Mode of interview, pp. 182-183
6.2.4 Epistemology and Data analysis, pp. 183-185 6.2.5 Ethics, p. 185
6.2.6 Analysis, pp. 186-187
6.2.7 Results: Restaurant, pp187-199
6.2.8 Expected time for meal delivery, pp.187-188 6.2.8 Service failure, pp.188-190
6.2.10 Believability of scenarios, pp. 190-191 6.2.11 Service recovery expectations, pp. 191-192
6.2.12 Perceived causes of the service failure/ prevention of the service failure, pp. 192-194
6.2.13 Customer satisfaction, pp. 194-195 6.2.14 Intention to re-patronise, pp.195-196 6.2.15 Illness/contamination/hygiene, p.197
xiv 6.2.17 Summary of results, pp. 198-199
6.3 Main pilot study, p. 199
6.3.1 Data collection for pilot, p.199 6.3.2 Sample, pp.199-200
6.3.3 Ethics, pp.200-201
6.3.4 Epistemology, pp.201-202
6.3.5 Pilot analysis Restaurant, pp.202
6.3.6 Normality testing and reliability analysis, pp.202-204 6.3.7 Reliability analysis, pp.204-205
6.3.8 Validity, pp.205-208
6.3.9 Missing data and outliers, pp. 208-209 6.3.10 Kruskal Wallis tests, pp. 209-210 6.3.11 Hypotheses testing, pp.210-211
6.3.12 Summary of indicative findings: main effects of pre-information, pp.211-212
6.3.13 Outlook, pp. 212-213
6.4 Results for second pilot study, p.214 6.4.1 Second Pilot analysis, pp.214-217
6.4.2 Normality testing and reliability analysis, missing data, and outliers, pp. 214-215
6.4.3 Kruskal Wallis tests, p. 215 6.4.4 Validity, pp. 215-216
6.4.5 Control variables, pp.216-217 6.5 Summary, p. 218
xv
7. Chapter 7: Results
7.1 Introduction, pp. 219-221
7.2 Profiling of the respondents in the studies, pp. 222-223 7.3 Descriptive statistics, pp.223-224
7.4 Reliability analysis, pp. 224-225
7.5 Realism and Manipulation checks, pp.226-230 7.6 Principal Components Analysis (PCA), pp.231-238 7.7 Hypothesis Testing, pp. 238-239
7.7.1 Main effects: Pre-information, pp. 239-251 7.7.2 Main effects: Compensation, pp.251-264 7.7.3 Main effects: Criticality, pp.264-276
7.8 Interaction effects: Results of 2 Way ANOVAS, pp.277-292 7.9 Summary, pp.292-295
8. Chapter 8: Discussion
8.1 Discussion, p.296
8.1.1 Pre-failure Service Recovery; an overview, pp.296-297
8.1.2 Pre-failure recovery lowers perceived severity of the service failure, p. 297
8.1.3 Pre-failure recovery lowers consumers’ expectations of service recovery, p.298
xvi 8.1.5 Pre-failure recovery enhances consumer perceptions of justice, pp.299-301
8.1.6 Pre-failure recovery increases customer satisfaction with service recovery and overall satisfaction, pp.301-302
8.2 Criticality, pp.302-304
8.3 Compensation increases customer satisfaction, pp.304-305 8.4 Interaction between pre-informing and criticality, pp.305-306 8.5 Contributions to theory and Implications, pp.307-309
8.5.1 A new step in the service recovery process, p. 307
8.5.2 Pre-failure recovery is a tool of service recovery and can take multiple forms, pp.307-308
8.5.3 Pre-failure recovery is as important in non-critical situations as it is in critical situations, pp.308-309
8.6 Implications for Practice, pp. 309-311
8.6.1 Pre-failure recovery is widely applicable and transferable, p.309 8.6.2 Pre-failure recovery can take different forms, p. 310
8.6.3 Before compensation, think pre-information, p. 311 8.7 Limitations, pp. 311-318
8.7.1 Methodological Limitations, pp.312-315 8.7.2 Research context Limitations, pp.315-316
8.7.3 Limitations with the variables used in this study, pp.316-318 8.8 Outlook for Future Research, pp.318-322
8.8.1 Extend the study into other service sectors, pp.318-320 8.8.2 Examine into more moderators, p.320
xvii 8.8.4 Examine into pre-information and post-information, pp.321-322
9. References, pp. 323-354
Diagrams and Tables
Figure 2.1: Levels of service failure severity in one service failure situation, p. 23
Figure 3.1: Model of disconfirmation (Woodruff et al, 1983, p300), p. 71 Figure 4.1: The Research Model, p. 130
Figure 5.1 Sample sizes for each scenario, p.143 Figure 5.2, The experimental scenario groups, p.145 Figure 5.3, Scenario group key, p.146
Figure 5.4: Significance levels for variance ratio (Adapted from Field 2009, p150), p.170
Figure 5.5: Cronbach’s alpha levels, p. 172 Figure 6.1: Table of results, p.203
Figure 6.2: Mean scores for pilot validity statistics, p.206 Table 6.3: Mann Whitney values, p. 211
Figure 7.1, The experimental scenario groups, p. 220 Figure 7.2, Scenario group key, p221
Figure 7.3. Cronbach’s Alphas, p. 225
Figure 7.4 Realism Checks (Non-critical scenarios), p. 227 Figure 7.5. Realism Checks (Critical Scenarios), p. 228
Figure 7.6 Manipulation checks (Non-critical scenarios), p. 229 Figure 7.7 Manipulation checks (Critical scenarios), p. 230
xviii Figure 7.8 Factor loadings, pp. 235-237
Figure 7.9, Mean Scores for Overall Satisfaction, p. 240
Figure 7.9.1, Mean Scores for Satisfaction with Service Recovery, p.241 Figure 7.9.2, Mean Scores for Severity of Service Failure 1, p.243 Figure 7.9.3, Mean Scores for Severity of Service Failure 2, p.243 Figure 7.9.4, Mean Scores for expectations of service recovery, p. 245 Figure 7.9.5, Mean Scores for Disconfirmation of Expectations, p. 246 Figure 7.9.6, Mean Scores for Distributive Justice, p.247
Figure 7.9.7, Mean Scores for Procedural Justice, p.249 Figure 7.9.8, Mean Scores for Interactional Justice, p. 250 Figure 7.10, Mean Scores for Overall Satisfaction, p.252
Figure 7.10.1, Mean Scores for Satisfaction with Service Recovery, p.253 Figure 7.10.2, Mean Scores for Severity of Service Failure 1, p. 255 Figure 7.10.3, Mean Scores for Severity of Service Failure 2, p.255 Figure 7.10.4, Mean Scores for expectations of service recovery, p.257 Figure 7.10.5, Mean Scores for Disconfirmation of Expectations, p.259 Figure 7.10.6, Mean Scores for Distributive Justice, p.260
Figure 7.10.7, Mean Scores for Procedural Justice, p.262 Figure 7.10.8, Mean Scores for Interactional Justice, p.263 Figure 7.11.1, Mean Scores for Overall Satisfaction, p.265
Figure 7.11.2, Mean Scores for Satisfaction with Service Recovery, p.266 Figure 7.11.3, Mean Scores for Severity of Service Failure 1, p.268 Figure 7.11.4, Mean Scores for Severity of Service Failure 2, p.268 Figure 7.11.5, Mean Scores for expectations of service recovery, p. 270 Figure 7.11.6, Mean Scores for Disconfirmation of Expectations, p. 271
xix Figure 7.11.7, Mean Scores for Distributive Justice, p.273
Figure 7.11.8, Mean Scores for Procedural Justice, p. 274 Figure 7.11.9, Mean Scores for Interactional Justice, p.276
Figure 7.12.1, Mean Scores for Overall Satisfaction and the interaction effect between Pre-Informing and Criticality, p. 277
Figure 7.12.2, Mean Scores for Satisfaction with service recovery and the interaction effect between Pre-Informing and Criticality, p.279
Figure 7.12.3, Mean Scores for Severity of Service Failure1 and the interaction effect between Pre-Informing and Criticality, p. 281 Figure 7.12.4, Mean Scores for Severity of Service Failure2 and the interaction effect between Pre-Informing and Criticality, p. 282
Figure 7.12.5, Mean Scores for expectations of service recovery and the interaction effect between Pre-Informing and Criticality, p. 284
Figure 7.12.6, Mean Scores for Disconfirmation of expectations and the interaction effect between Pre-Informing and Criticality, p. 286
Figure 7.12.6, Mean Scores for Distributive Justice and the interaction effect between Pre-Informing and Criticality, p. 288
Figure 7.12.7, Mean Scores for Procedural Justice and the interaction effect between Pre-Informing and Criticality, p. 289
Figure 7.12.8, Mean Scores for Interactional justice and the interaction effect between Pre-Informing and Criticality, p. 291
xx
10. Appendices, p. 378
Appendix One: Positivism and Interpretivism, pp. i-ii
Appendix Two: The Advantages and Disadvantages of Quantitative and Qualitative research, p. iii
Appendix Three: The Advantages and Disadvantages of Sampling methods, pp. iv-v
Appendix Four: The Advantages and Disadvantages of modes of survey administration, pp. vi-vii
Appendix Five: Constructs and their measurements, pp. viii-xiv Appendix Six: Interview transcripts, pp. xv-Ixiv
Appendix Seven: Ethical approval form for the pilot study, p. Ixv Appendix Eight: The full survey, pp. Ixvi-xciv
1 1.
Chapter One: Introduction
1.1 Introduction: Service failure, pre-information and customer satisfaction
Services by their nature are prone to error thus service failure is an integrated part of services delivery (Chen, 2016; Miller et al, 2000; Schwiekhart et al, 1993). It may be argued that if a service failure is recovered before the customer experiences it, then it is not a service failure, however, there are service failures that will still occur and are unavoidable despite a company’s best efforts, for example, part of a store closing due to refurbishment. The problem is that when a company identifies a service failure that cannot be avoided, they do not always inform customers about it or initiate activities to minimise the negative effects the service failure will have on customers. Thus, customers are exposed to service failures and companies are then faced with the issue of recovering from them. Additionally, customers may state that the issue would not have been so severe had they known prior to experiencing the failure. Thus, such ‘pre-failure recovery’ activities could help minimise the negative effects of the service failure and recover service performance before the customer experiences the service failure. Many studies have found that effective recovery of a service failure has a positive effect on customer satisfaction (Holloway and Beatty, 2003) and intention to re-patronise (Wirtz and Mattilla, 2004). This thesis seeks to examine the literature on service failure and recovery and see how ‘pre-failure recovery’ affects consumer
2 satisfaction. This thesis will also aim to examine the joint effect of criticality and pre-failure recovery on customer satisfaction. Current research has already found that criticality has important implication for the service failure and its recovery (Hoffman et al, 1995; Weun et al, 2004). Webster and Sundaram (1998, p153) define ‘service criticality’ as the ‘perceived importance’ of the service to the consumer. Webster and Sundaram’s (1998) study states that the higher the criticality assigned to the service failure, the more the service failure negatively impacts customer satisfaction.
1.2 Research Questions and Objectives
This author puts forward the following research questions:
1. What effect do ‘pre-failure recovery’ activities have on customer satisfaction?, and
2. What joint effect does ‘pre-failure recovery’ and criticality have on customer satisfaction?
To answer the research questions this thesis will have eight main objectives:
1. To examine the effect of a pre-failure recovery stage on customer satisfaction
2. To examine the effect of a pfailure recovery stage on intention to re-patronise
3 3. To examine how a pre-failure recovery step affects a consumer’s
perception of the severity of a service failure.
4. To examine how a pre-failure recovery step affects a consumer’s perception towards perceived justice
5. To examine how a pre-failure recovery step effects consumer expectations of service recovery
6. To examine how a pre-failure recovery step affects a consumer’s disconfirmation of their expectations
7. To examine the effect of criticality on the variables of interest in this study
8. To examine the interaction effect of pre-failure recovery and criticality on customer satisfaction
The literature review will critically discuss each of these variables of interest as outlined in the objectives of this thesis. Then following the development of a conceptual model for the research, hypotheses will be generated and tested within each objective.
1.3 The contribution of this research
1.3.1 Theoretically
This research seeks to make a valuable contribution to the literature on service failure and recovery in developing a new stage in the service recovery process
4 not recognised by any literature to date despite literature acknowledging that recovering failure before it happens as the ‘gold standard’ (Miller et al, 2000).
Although Miller et al (2000) and Schweikhart et al (1993) acknowledged that service recovery can take place before a service failure occurs, they do so only from the perspective of preventing the service failure from occurring. The proposed new ‘pre-failure recovery’ stage is thus distinctive; it does not aim to prevent the failure from occurring but serves to minimise the negative effects of the service failure that will be experienced by the consumer before the consumer is exposed to the failure and making it up to the consumer to overcome the situation. This proposed new stage will thus add to the service recovery process literature in building on the service recovery process as put forward by Miller et al (2000). A similar idea behind this has been explored in an online context by Pizzi and Scarpi (2013) in so far as informing the consumer about out-of-stocks before customers attempt to order an item, however, this idea has not been explored in an offline context despite its relevance and applicability to numerous situations, for example, letting consumers know in advance that a shop they patronise will be closed early on a certain date due to refurbishment is but one situation this proposed new stage could apply to. This research will use a similar theoretical construct as Smith et al (1999) in drawing on theory from disconfirmation of expectations theory, and justice theory, with the addition of prospect theory. Logically, following the concept that Maxham and Netemeyer (2003) advocated in their study, the proposed additional stage in the service recovery process should benefit the overall effectiveness of service recoveries and have a positive influence on
5 consumer satisfaction. The model will thus be tested in terms of its effect on customer satisfaction and intention to re-patronise thus contributing also to these fields of study.
1.3.2 Practically
This thesis’s practical contribution is that companies may start to implement pre-failure service recovery measures in response to this research when inevitable and unavoidable service failure has been identified. Such activities could include pre-notifying customers about the service failure before they experience it (Pizzi and Scarpi, 2013), providing additional services within the period that the service failure will occur to minimise the negative effects (if new self-service checkouts have been installed have additional staff in place to assist people using them), provide incentives such as coupons to encourage customers to patronise within the period of the service failure, provide explanations for the service failure, and provide apologies which increases ‘customer perceptions of satisfaction and fairness’ and can defuse some of the anger and negative feelings caused by the service failure (Boshoff and Leong, 1998, p27). This would help the company to overcome the service failure in putting into practice a better recovery strategy to minimise (and even eradicate) the negative effects of the service failure, thus increasing customer satisfaction with service performance and retaining customers. In retaining customers, the company will benefit in terms of profitability (Holloway and Beatty, 2003) and competitiveness.
6 1.4 Service context: restaurants
This doctoral thesis aims to meet the research objectives and answer the research question by focusing on restaurants in the hospitality sector. In this part of the chapter, the service context will be discussed.
Restaurants form part of the hospitality industry. However, the definition of restaurants is broad, thus as in the Keynote (2011) report, this study will also restrict the definition of restaurants to be ‘catering businesses that providing eat-in or sit-down meals and drinks, in a leisure context’ thus excludes take-away eateries (for example McDonalds and Subway) and motorway services (for example little chef) (Keynote, 2011b). The restaurant sector is made up of three main categories of eating establishment, namely, fast food restaurants, pub restaurants and casual dining restaurants (Keynote, 2011a). To provide more focus to this study, this doctoral thesis will focus on casual dining restaurants (not limited to themed restaurants e.g. Italian restaurants) thus when restaurants are referred to in this study, it will mean restaurant as in casual dining restaurant. The eating-out market was found to be worth a total of ‘£18.27 billion (excluding alcoholic beverages)’ in 2009 in the UK (Keynote, 2011a). Casual dining restaurants are the ‘fastest growing segment in the eating out market’ in the UK (The Caterer, 2014, p4). Despite market growth however from 2008 to 2009 the market has struggled in that restaurants have had to increase their prices due to rising costs which has negatively impacted meals sold (Keynote, 2011a). Independent restaurants are struggling the most against competitive chain restaurants (The Caterer, 2014,
7 p4). Due to higher prices being charged, it is therefore even more important for such restaurants to provide quality service to its diners as diners are now ‘more demanding than ever’ (Mintel, 2014a). Therefore, this study will examine the effect of pre-recovery measures within the restaurant context as good service is an aspect that will help restaurants to remain competitive in the marketplace.
One incident that could negatively impact restaurant service is slow service (Hoffman et al, 1995; Kelley et al, 1993). One reason for slow service could be restaurants being understaffed (Kelley et al, 1993) however, what if this is due to a member of the kitchen staff falling ill during the day and it is too late or not financially possible for the restaurant to get a replacement chef; service failure can now be foreseen by the restaurateur. To keep service at an acceptable level, service recovery will be needed; this thesis will examine how pre-failure service recovery could help in such a situation. It should be noted that the slow service in the scenario provided to the participants in this study includes the participants having to wait longer for their meal to be served thus it differs from queuing in that the participants are not waiting their ‘turn’ but waiting due to it taking longer to prepare, cook, and serve the dishes. Therefore, this study does not contribute or build on literature in the field of queuing or waiting times. This study instead focuses on slow service as a service failure, consumers waiting is but a symptom of the service failure the participants experience. The symptom however of waiting is an important aspect of the slow service failure situation. Berry et al (2002) state that the perceived fairness of a wait will have an impact on customer satisfaction and
8 that the perceived fairness will be influenced by the perceived controllability of the situation by the service provider. Berry et al (2002, p3) rightly acknowledges that literature in the area has already explored and examined offering information about waiting to consumers in order to see the effect this has on ‘attribution, fairness, and satisfaction’. Thus, how a restaurateur handles longer waiting times for meals is important. However, the effect of a pre-failure recovery step on customer satisfaction has yet to be examined.
1.5 Summary
This chapter has outlined the research problem and how this thesis aims to address it by outlining the research questions this thesis seeks to answer. To answer these questions eight research objectives have been identified. The contribution this study would make both theoretically and practically were then discussed. Finally, this chapter introduced the sector and context in which this study will be conducted and has discussed how this study is relevant to this service sector and why it is important to this service sector.
1.6 Structure of thesis
In the next chapter (chapter two), a critical review into the literature will be provided into the field of service failure and service recovery. Chapter three forms the second part of the literature review. In chapter four the research model and hypotheses will be presented. In chapter five the methodology used in this research is explained. In chapter six the pilot studies conducted in this
9 research are all explained and their results reported. In chapter seven the main results of this research are presented. Finally, in chapter eight the results of this research are discussed as well as their theoretical and practical implications and this culminates on a discussion upon the outlook for future research in this field.
10
2. Chapter two. Literature review part one: service failure and
service recovery
2.1 Introduction
This chapter is a literature review of service failure and recovery. Within this chapter, the author will briefly look at what a service is, its attributes, and the service industry. Thus, this part of the chapter, in reviewing the literature to date, will include definitions of service failure and recovery, identify what forms they take, and discuss why they are important and the implications they have for businesses. Moreover, the factors that affect service failure and the factors that affect the effectiveness of service recovery will both be identified and examined. Finally gaps in the literature on service failure and recovery will be discussed.
2.2 A definition of 'service' and a look at the services industry
The services industry is becoming increasingly competitive (Andreassen and Lindestad, 1998). For many companies (including non-service companies), service as an element is being used to differentiate their offering and remain competitive (Devlin et al, 2002). Within services literature there is a lack of definition as to what a service is, however, services are usually distinguished from goods by five key characteristics. The key characteristics which have served to distinguish services from goods are ‘intangibility’, ‘variability’, are produced/consumed simultaneously, and often involves the customer
11 participating in its production (Brown et al, 1996, p34; Zeithaml et al, 1985) and ‘perishability’ (Vargo and Lusch, 2004, p326). The fundamental characteristic that differentiates services from goods is intangibility (Hoffman and Bateson, 2011; Zeithaml et al, 1985). Despite this there have been some attempts at defining what a service is; Vargo and Lusch’s definition (2004, p326) states that a service is ‘the application of specialized competences (skills and knowledge), through deeds, processes, and performances for the benefit of another entity or the entity itself (self-service)’ which emphasises that services are activities, processes or performances as recognised by earlier attempts at defining services. The difference however between goods and services is still somewhat unclear;Hoffman and Bateson (2011) rightly recognise that as well as pure goods and services being in existence, often tangible goods are used to facilitate the delivery of service or vice versa; this supports the notion of a goods-services continuum. Hoffman and Bateson (2011, p4) also recognise that even in pure services there will often be some tangible elements involved to support the service, for example a ‘written policy from an insurance company’ thus literally from this standpoint there is no such thing as ‘pure’ goods or services. The degree to which thus a market entity is services or goods dominant in its offering will affect its position on the goods-services continuum (Hoffman and Bateson, 2011). The four positions on this continuum are identified by Martin and Horne (1992) as ‘pure goods, core goods with accompanying services, core services with accompanying goods, and pure services’. Fundin et al (2012) acknowledge that other models of market entity placement on the goods-services continuum exist due to the limitations of this model, however, it is not the purpose of this study to go into
12 this debate; this section merely serves as an introduction to services. The key part to understand is that a continuum exists where firms are seen as either service dominant or goods dominant in their offerings. Due to the intangible nature of services, they are often harder to evaluate, thus for consumers to evaluate the quality of the service they experience they will take into consideration ‘tangibles’ involved, ‘reliability’, ‘responsiveness’, ‘assurance’, and ‘empathy’ (Parasuraman et al, 1991, p116); these five dimensions make up the SERVQUAL measurement of service quality (Parasuraman et al, 1991).
Andreassen and Lindestad (1998, p9) citing Zeithaml (1988) state that perceived service quality is ‘the consumer’s judgment about a product’s overall excellence or superiority’ and that this depends on the extent to which a customer’s needs are met by the service and any deficiencies within the ‘product or service’ (Andresassen and Lindestad, 1998, p10). Finally, Andreassen and Lindestad (1998, p10; Brown et al, 1996; Parasuraman et al, 1985) state ‘service quality is believed to depend on the gap between expected and perceived performance’; it is when service quality ‘falls below a customer’s expectations’ that service failure then occurs (Hess et al, 2003, p129). Thus, ultimately it is the evaluation of a service against the customer’s expectations that will determine whether a service has been successful in its delivery (expectations will be discussed in-depth in chapter three). This paper will now discuss what a service failure is.
13 2.3 A definition of service failure
The ideal service is delivered with ‘zero defect(s)’, however in reality this is often not the case and some defects will be present in the delivery of the service (Weun et al, 2004, p133). When services thus have defects, service failure results (Weun et al, 2004). Hess et al (2003, p129; Holloway and Beatty, 2003; Sivakumar et al, 2013) however state that service failure is ‘service performance that falls below a customer’s expectations’; this would mean that even if a service was delivered with ‘zero defects’ it would have failed in its delivery if the customer did not feel their expectations were met. The issue with this definition is that it is arguably too broad; however, it is to a great extent suitable. If expectations have not been met, then the customer is disappointed with the service which can thus be classed as a failure of the service. Moreover, a customer’s expectations allow for shortfalls in service in ranging from a customers’ desired expectations, to a zone of tolerance (for shortfalls), to a minimum adequate expectation for service (Zeithaml et al, 1993). Thus, arguably, even a service with defects may not be classed as a failure but as successful should it at least meet the customers’ adequate expectations. The gap however between adequate and desired expectations (the zone of tolerance) is suggestive that although a customer’s expectations may be met at the minimum level, the fact that desired expectations are not met is somewhat of a failure on the part of a service provider whether there are defects or not. A zone of tolerance is however needed as it allows for temporal variables such as customer mood and weather (outside of the retailer’s control)
14 which may temporarily affect customer expectations and their perceptions of service performance (Zeithaml et al, 1993) of which are not the fault of the service provider. Weun et al (2004) are more explicit about the level at which service failure occurs stating that service failure occurs when service performance falls below the level of a customer’s zone of tolerance; this however fails to recognise Zeithaml et al’s (1993) final level of adequate expectations that comes after the zone of tolerance (expectations will be covered in more detail in the next chapter). Thus, the definition that this author will use will be the one advocated by Hess et al (2003). This definition albeit broad is strong for this reason; it does not explicitly state that service failure occurs when expectations are not met and fall under a certain level. Hess et al’s (2003) definition is stronger in that it allows for flexibility in recognising that a service can fail within limits acceptable to a customer, and fall below minimal expectations which are then deemed as unacceptable. It is the level of severity of service failure which will determine how far below desired expectations service performance falls. Either way a recovery effort will be needed. However, for service failures with defects that are unavoidable (such as store refurbishment), service failure cannot be avoided but its negative consequences can be minimised and steps taken to overcome it so that customers’ expectations can met at a higher level than if no steps were taken to buffer the effects and compensate for the failure at all. Service recovery will be discussed later in this chapter. This chapter will now look at the forms that service failures come in.
15 2.4 Forms of service failure
Bitner et al (1990) diagnosed unfavourable service incidents across different service sectors in their study and since then other researchers including Kelley et al (1993) and Hoffman et al (1995) have developed more in-depth examples of service failures that occur. Some examples of service failures are ‘policy failures’, ‘slow/unavailable service’, ‘packaging errors’ (which includes labelling errors, missing parts), ‘out of stock’ (OOS) (or were in stock but not on the shelf), ‘product defects’, ‘bad information’, ‘system pricing failures’, ‘hold disasters’, and errors in ‘alterations and repairs’ (Kelley et al, 1993, pp434-436). This list however is not exhaustive; due to the definition of service failure being so broad, and numerous service industries, a number of situations could be classified as service failures. Holloway and Beatty (2003, p95) in their study of service failure in an online environment expanded types of service failure to include ‘delivery problems, website design problems, payment problems, security problems, problems with product quality and customer service problems’. Hoffman et al’s (1995, p53) study into service failure in restaurants listed service failures to include product defects, slow/unavailable service, facility problems, unclear policy, out of stock, not cooked to order, seating problems, employee behaviour, wrong order, lost order, mischarged’. From these studies, it can be seen that some forms of service failure overlap in different service sectors, however, what is notable also is that there exist some service failures that are specific and unique to certain service contexts. Thus, although Bitner et al’s (1990) framework is
16 useful in providing examples that are applicable across some service sectors, it does not capture more service sector specific examples that are present in studies including Hoffman et al’s (1995). Whatever form a service failure may take, McColl-Kennedy and Sparks (2003, p262) state that a service failure can be caused by an issue with the ‘service itself’, ‘problems associated with the service provider’, ‘problems outside the service provider’s control’, and ‘problems related to the customer’. This paper however is only concerned with service failures in the context of issues with the service itself. Since this study is focusing on service failure in restaurants the type of the service failure that will be used in this study is slow service as was discussed in chapter one.
2.5 The importance of service failure the implications it has
Due to the nature of services (‘high levels of human involvement’, ‘varying customer expectations’), service failure is inevitable in the delivery of services and thus needs to be managed to overcome them (Miller et al, 2000, p388; Hess et al, 2003; Cranage and Sujan, 2004; Wang et al, 2011; Andreassen, 2000; Sengupta et al, 2015; Chen, 2016) and prevent them occurring in the future. The fact that services are produced and consumed simultaneously also makes them prone to error (Hess et al, 2003). Service failure leads to customer dissatisfaction (Hess et al, 2003) and this can result in negative word-of-mouth, customer switching behaviour, and losing customers to competitors (Holloway and Beatty, 2003; Wang et al, 2011). Thus, due to the inevitability of service failure and its negative implications for firms, it is highly important that firms manage service failure and recovery. For small businesses trying to
17 remain competitive against large firms such efforts are especially important; independent restaurants in the UK are struggling to compete against chain restaurants (The Caterer, 2014, p4) thus effective management of service failure and recovery will help firms to remain competitive amongst their competitors.
2.6 The factors that affect service failure
In this part of the chapter, the factors that affect service failure will be identified and examined drawing upon literature in the field to date.
2.6.1 Severity of the failure
The resultant effects of service failure depend on the severity of the service failure (Weun et al, 2004). Weun et al (2004, p135) state severity of a service failure is ‘a customer’s perceived intensity of a service problem’. Severity of a service failure is defined by Hess et al (2003, p132) as the extent of loss experienced by the customer as a result of the service failure. Intensity of a problem will affect the loss experienced thus the two different definitions fit together; ‘the more intense or severe the service failure, the greater the customer’s perceived loss’ (Wang et al, 2011, p351). The severity of a service failure ranges from low magnitude to high magnitude (Smith et al, 1999). Such loss can be tangible and/or intangible in nature (Hess et al, 2003; Smith et al, 1999). Hoffman et al (1995) also stated that more serious failures are
18 more memorable and the more severe the failure, the harder it is to recover from effectively.
Literature that concerns severity of service failure often integrates this with the factors that affect the level of perceived severity of the failure. These factors include the type of failure (Smith et al, 1999), the perceived foreseeability of the failure (Cranage and Sujan, 2004), attribution of blame for the failure (taking responsibility or attributing blame to the firm) (Cranage and Sujan, 2004), controllability of the service failure (whether it was preventable) (Hess et al, 2003; Smith et al, 1999; Boshoff and Leong, 1998), and stability of the failure, that is, the extent to which the service failure is ‘expected to persist’ (Hess et al, 2003, p130). Also, the number of failures will impact the perceived severity of the failures (Maxham and Netemayer, 2002). Additionally, Cranage (2004) stated that criticality affects the customer’s perception of the failure severity. This paper will now examine into criticality and how it affects severity of a service failure.
2.6.2 Criticality
Webster and Sundaram (1998, p153) state that ‘service criticality’ is the ‘perceived importance’ of the service to the consumer. Ostrom and Iacobucci (1995) state that criticality of the service will be affected by the purchase occasion, for example, buying for a special occasion. Webster and Sundaram’s (1998) study states that the higher the criticality assigned to the service failure, the more the service failure negatively impacts customer satisfaction. Consequently, more recovery activity is then needed to overcome the failure
19 and restore customer satisfaction (Webster and Sundaram,1998). Cranage (2004, p213) supports this stating that criticality affects the service failure in that the more critical the service is viewed as by the consumer, the more severe the perception of the service failure and the greater the perception of loss. A limitation of the Ostrom and Iacobucci (1995) study and Webster and Sundaram’s (1998) study are that they use convenience samples of students thus their sample is unlikely to be representative of the population they study (Saunders et al, 2009). Also, these studies use an experimental methodology which also compromises their external validity (Saunders et al, 2009). Therefore, the results in these two studies are not generalisable (Saunders et al, 2009). Also, Cranage’s (2004) paper is a literature review which lacks depth in its content. Although Cranage's (2004) article provides a useful insight into service recovery, it lacks critique of the theories and papers it draws upon. One example of this is Cranage (2004) mentioning the 'service recovery paradox', providing supporting evidence for it, but not being critical of it and looking at the arguments against this theory. Another example is Cranage (2004) drawing from papers which have arrived at their results through using critical incident technique without mentioning the possible limitations of this method which could have affected their results. Thus, more critique is required in this paper. Also, whilst good coverage of the topic of service recovery is achieved in this article, more sources could be used to strengthen the article and the arguments it puts forward. For example, one statement made in this paper has no source to support it: 'When customers experience a service failure, their confidence in the company becomes
20 uncertain' (Cranage, 2004, p210). This makes some of the statements in this article questionable.
Despite the weaknesses in these studies, it is logical that the more critical a service is perceived by a consumer, the higher the perceived loss will be, therefore when the consumer experiences the service failure they will perceive the failure as more severe. The consumers’ situation, for example time pressure, may also increase the criticality of the service delivery to the consumer; the service failure being ‘slow service’ is going to be worse for a consumer who is in a hurry to be somewhere else thus making the delivery of that service more critical to the consumer.
2.6.3 Failure type
Literature on failure type has looked at creating a typology of failures (Bitner et al, 1990; Hoffman et al, 1995), linking type of failure to perception of severity of failure (Bitner et al, 1990; Hoffman et al, 1995), and looking at how different failure types affect what recovery activities are needed to redress service failure (Smith et al, 1999).
Numerous service industries mean that numerous failure types are in existence. Bitner et al’s (1990) study made three broad typologies of service failure events and related employee behavioural response that could be applied across different service sectors which in this study were airlines, restaurants, and hotels. These three types were ‘employee response to service delivery
21 system failures’, ‘employee response to customer needs and requests’, and ‘unprompted and unsolicited employee actions’ (Bitner et al, 1990, p75). This study provides a useful broad framework that is applicable to multiple sectors, but what is not covered in the study are industry specific failure types. Literature on failure type mainly identifies types of failure existent within certain service industries such as online retail (Holloway and Beatty, 2003) and restaurants (Hoffman et al, 1995). Hoffman et al’s (1995) study put forward a typology of service failures in the context of restaurants and then looked at how these types of failure corresponded with typology of recovery strategies in the restaurant context. Hoffman et al’s study (1995) stated that certain types of failure were rated more severely and particularly hard to recover from, namely, employee behaviour and facility problems. This indicates that customers view certain types of failure more severely than others. Although such studies provide insight into failure types in certain service contexts, their results are limited in that such studies including Bitner et al’s (1990), Holloway and Beatty’s (2003) and Hoffman et al’s (1995) use convenience samples and critical incident theory (CIT). In using field studies using actual consumers and CIT an in-depth consumer understanding is gained (Gremler, 2004; Bitner et al, 1990). Also, a justification for these studies using CIT is that it suitable for the purposes of inductive research (Gremler, 2004). However, the issue with the convenience sampling technique employed is that the results of the studies are not generalisable to the wider population of consumers since the samples are unlikely to be representative of the consumer population (Saunders et al, 2009). Furthermore, the results of these studies are to be treated with some degree of caution in that by using CIT as a method,
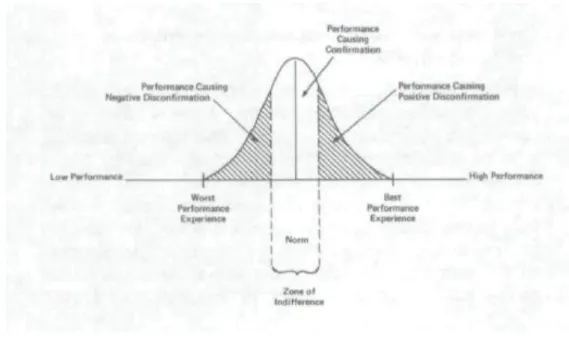
22 less severe failure incidents are less likely to be reported thus affecting the data collected and the results since failures reported are likely to be the more extreme end of the spectrum (as these incidents are more memorable to consumers) (Miller et al, 2000). This method is also subject to recall error (Gremler, 2004; Miller et al, 2000). These studies do however provide a useful insight; in conducting inductive research the types of service failure found are useful in understanding what failure types are in existence. However, in the statistical measurement of these service failure types and perceptions of severity attributed to them, research is limited and more rigorous research is needed in this area to increase external validity and credibility of findings. From the insight provided however, an assumption may be made that certain types of failure are viewed with different levels of severity by consumers. Smith et al’s study (1999) supports this assumption in that it found satisfaction after a service failure differed according to the type of failure and the severity of failure. However, within one type of failure, this author proposes that severity of a particular failure can still differ within its type, for example, a product defect in a restaurant, a consumer may order a steak well-done and severity of failure will be perceived differently if the steak turns up medium or completely raw; this is in line with the spectrum of severity from low to high magnitude of severity (Smith et al, 1999). The figure (2.1) below illustrates this.
Research therefore on one specific type of failure may still report different perceptions of failure severity depending on individual cases, and an averaged result would not be representative.
23 Figure 2.1: Levels of service failure severity in one service failure situation
Smith et al’s (1999) study takes a useful approach in forming a typology of service failures however, unlike the studies above its aim is not to develop a typology of failures. Smith et al (1999, p358) organise failures into two types: ‘process’ (the way in which the service is delivered) and ‘outcome’ (what the customer receives from the service). This may be more useful to researchers in that it allows for different forms of service failure (whatever service sector they are relevant to) to fit in the framework. Smith et al (1999) found that using these types of failure categories, that type of failure affected customer satisfaction post failure, and what recovery effort is appropriate (which will
24 affect level of customers’ perception of justice). Thus, type of failure will also affect what form of recovery is appropriate to redress the service failure (Roschk and Gelbrich, 2014; Smith et al, 1999; Boshoff and Leong, 1998). Smith et al’s (1999) study provides a deeper insight into the effects of failure type and although consumers are used in one part of the study, the issue is that the surveys conducted are experimental in nature providing scenarios in which participants are asked to respond to thus data is not collected on the basis of incidents the customer has been exposed to, but is collected in the context of an artificial scenario. This may limit results in that participants may not be as emotionally invested in the situations than if they were to experience them for real, thus results may not be completely reflective of customer responses. The results of the first sample used are not generalisable due to convenience sampling using student subjects which will not be representative of the consumer population (Saunders et al, 2009) whilst the second sample, albeit using consumers, is generalisable only to the extent of business travellers.
The literature on service failure type thus shows that type of failure may influence the perceived severity of the failure, customer satisfaction, and what recovery activities are appropriate (which will affect consumer’s perception of justice).
2.6.4 Attribution of blame
Attribution theory states that ‘the perceived cause will influence the dissatisfied consumer’s response to a service failure’ (Boshoff and Leong,
25 1998, p27; Folkes, 1984). Attribution has been demonstrated to affect ‘consumers’ complaint intentions, repurchase intentions, word-of-mouth (WOM) behaviour, redress preferences, and anger toward the firm’ (Yen et al, 2004, p8). Attribution is influenced by the stability of the service failure, controllability of the service failure, and locus of control (Boshoff and Leong, 1998; Bitner, 1990; Folkes, 1974). Bitner (1990, p77) found that controllability has a negative impact on satisfaction and perceived service quality whilst stability has a negative impact on satisfaction. This paper will now examine each of the three elements of attribution.
2.6.5 Locus of control
Consumers experiencing service failure will look to assign responsibility for the service failure (Gelbrich, 2010; Hess et al, 2003). In their exploratory study into managing consumer emotions in service recovery, Mccoll-Kennedy and Sparks (2003, p262) stated that service failure can stem from ‘a range of sources’ which include four major triggers: issues with the actual service, ‘problems associated with the service provider’, ‘problems outside the service provider’s control’, and ‘problems related to the customer’. Locus for the attribution of blame thus in two of the four situations thus fall with the service provider. For the purposes of this study, the focus of the review and research will be on service failures due to the service provider, not service failures as a result of consumer actions.
26 For foreseeable service failures, attribution of blame in terms of where the locus lies has been researched in terms of disclosure of information to consumers. Cranage and Mattilla (2006) found that when consumers were informed about issues and given a choice as a result, consumers assigned more blame to themselves which resulted in higher satisfaction with the service and loyalty to the service provider. However, the studies into such ‘choice’ by Cranage and Sujan (2004) and Cranage and Matilla (2006) are limited in that they are focused around the specific situation of customers deciding where to sit in a restaurant based on information they are provided with by the service provider. In terms of foreseeable failure, providing customers with information in the situation of the studies above is relevant, however in many situations it is not about ‘choice’ but about minimising the negative emotions consumers hold as a result of the service failure through providing prospective explanations for the service failure to help consumers accept and adapt to the situation (Gelbrich, 2010), it is not about informing them so that they take responsibility for their experience. Providing prospective explanations for service failure may help the consumer to attribute responsibility for the service failure (should the firm accept responsibility or state why it was not the firm’s responsibility), however largely this course of action ties into the being treated correctly by the service provider which is linked to service recovery and interactional justice (Mccoll-Kennedy and Sparks, 2003) (service recovery is discussed later in this chapter whilst interactional justice will be discussed in chapter three). Moreover, Cranage and Sujan (2004) and Cranage and Mattilla (2006) use convenience sampling of students, and are experiments utilising hypothetical situations thus their results lack applicability, external validity,
27 and generalisability (Saunders et al, 2009). Research on attribution of blame for service failure extends to accountability on how the service provider handles the failure (Mccoll-Kenneddy and Sparks, 2003), however, service recovery will be discussed later in this chapter. Stability and controllability will influence who is perceived to be the foci of blame and these elements will now be examined respectively.
2.6.6 Stability
Stability refers to whether the cause of service failure is short-term or a long-term issue (Folkes, 1984; Hess et al, 2003). When a service failure cause is perceived as stable, consumers will be more expectant of service failures in the future (Folkes, 1984). Customers are more forgiving of unstable service failures as they are less expectant of future service failures (Magnini et al, 2007).
Maxham and Netemayer (2002) found that multiple service failures had a strong impact on customer satisfaction causing dissatisfaction. Maxham and Netemayer (2002, p67) also found that the second failure will be perceived as more severe by customers since customers account for ‘failure history’. Maxham and Netemayer (2002) found that when experiencing a second failure, customers are more likely to perceive the cause of the service failure as stable and attribute the blame for the service failure to the service provider. Maxham and Netemeyer (2002) found no difference in ratings between service providers making two distinct or two similar failures, however,
28 recovery ratings were lower for customers experiencing two similar failures. It may thus be stated that the more stable a failure is perceived, the harder effective service recovery becomes for the service provider. Stability of service failure thus has a negative impact on satisfaction (Bitner, 1990, p77).
Magnini et al (2007) and Bitner’s (1990) studies are limited in terms of their external validity in that they both use an experimental methodology (Saunders et al, 2009). Also, Magnini et al (2007) in using a convenience sample of students and Bitner (1990) using a convenience sample of consumers means that the results of their studies are not generalisable since it is unlikely that the samples are representative of the population. However, Magnini et al’s (2007) results are supported by Maxham and Netemayer (2002). Although Maxham and Netmeyer (2002) also used a convenience sample, it used a sample of actual consumers and used a survey based methodology drawing upon the consumers' real-life situations thus although this earlier study is not generalisable, in using actual consumers and real situations the results of Maxham and Netemayer’s (2002) and Magnini et al’s (2007) studies show stronger external credibility. Maxham and Netemayer’s (2002) study however opens itself to recall bias in asking consumers to recall events (Groves et al, 2009; Maxham and Netemeyer, 2002). The advantages of Magnini et al (2007) and Bitner (1990) using experimental methodologies is that they show stronger internal credibility and are not suspect to recall error (Saunders et al, 2009; Bitner, 1990). The popular methodologies in this area are experiments using convenience samples, thus more field studies are needed. Additionally,
29 Hess et al (2003) found that women were more likely to perceive service failures as less stable.
2.6.7 Controllability
Controllability refers to whether the service failure could have been prevented (Hess et al, 2003). Whether the consumer believes that the service failure was preventable or not depends on their perception as to whether the cause of the failure was ‘volitional’ that is, out of choice (for example, not to train staff), or ‘non-volitional’, out of control restraints (for example a ‘fire in the store’) (Folkes, 1984, p399; Hess et al, 2003). This also ties in with the concept of whether the service failure was foreseeable; customers will be more forgiving when service failures are perceived as non-foreseeable by the service provider (Magnini et al, 2007). Heider (1958) in Cranage and Sujan (2004, p5) states ‘Greater responsibility is assigned those who could have foreseen the outcome’ thus should service failures be foreseeable and controllable by service providers there is higher attribution of blame to them (as the locus of the attribution) than if the service failure were not foreseeable. Moreover, if a foreseeable service failure arises and something could have been done to aid or prevent the situation and was not (before the customer experiences it), a sense of injustice will induce negative emotions including ‘frustration’ and ‘anger’ in the consumer since they may view that the service provider could have done something to help them (Mccoll-Kennedy and Sparks, 2003, p262; Choi and Matilla, 2008); such an activity could be to inform consumers of the service failure before they experience it (Gelbrich, 2010). This could apply to
30 both volitional (store refurbishment due) and non-volitional situations (deliveries taking longer due to adverse weather conditions). Folke’s (1984, p406) research supports this as in this author’s study; it was found that controllability of a service failure was positively correlated to ‘anger and revenge’. Therefore, when service failures are perceived as controllable and foreseeable, more responsibility rests on the service provider than if the service failure was non-volitional and unforeseeable. In controllable and foreseeable service failures thus, actions should be taken to mitigate the negative effects of the service failure or negative emotions could result. For example, a customer could identify a foreseeable service failure when a retail store is undergoing a refurbishment which is visible to them which could suggest to the customer that it is likely that the normal standard of service would not be delivered. Therefore, service providers in this situation should do something to aid the customer before they experience the service failure. Failure to do so could cause negative emotions in the consumer as they would have seen that the service provider could have done something to minimise the negative effects of the service failure. On the other hand, if a staff member goes ill in a restaurant and a member of the kitchen staff needs to be sent home thus meals would take longer to be cooked and served, it is likely that a customer would not be able to foresee the service failure occurring. The service provider would also not be able to foresee this occurring but should this situation arise they should act as soon as possible to mitigate the effects of the service failure before the customer experiences it. In this situation, pre-informing customers before they experience the service failure would possibly be of help as they would then understand that the service failure was not