Boston University
OpenBU http://open.bu.edu
Theses & Dissertations Boston University Theses & Dissertations
2017
Maximizing the amount of DNA
recovered: a study of Mawi DNA
technologies' iSWAB-ID collection
device for forensic science
application
https://hdl.handle.net/2144/26627 Boston University
BOSTON UNIVERSITY SCHOOL OF MEDICINE
Thesis
MAXIMIZING THE AMOUNT OF DNA RECOVERED:
A STUDY OF MAWI DNA TECHNOLOGIES’ ISWAB-ID COLLECTION DEVICE FOR FORENSIC SCIENCE APPLICATION
by
MICHELLE KRISTEN GORDON
B.A., Boston College, 2015
Submitted in partial fulfillment of the requirements for the degree of
Master of Science 2017
© 2017 by
MICHELLE KRISTEN GORDON
Approved by
First Reader
Robin W. Cotton, Ph.D.
Associate Professor, Program in Biomedical Forensic Sciences Director, Program in Biomedical Forensic Sciences
Department of Anatomy & Neurobiology
Second Reader
Bassam El-Fahmawi, Ph.D.
iv
ACKNOWLEDGMENTS
First, I would like to thank my thesis advisor and mentor, Dr. Robin Cotton for her guidance and constant support throughout this process. From the beginning, her enthusiasm and interest in the development of this thesis fueled my drive to design experiment after experiment. Through sharing her professional and personal experiences, she not only taught me how to think like a scientist, but inspires me to uncover my full potential as one.
Secondly, I want to send my sincerest gratitude to Dr. Bassam El-Fahmawi, President of Mawi DNA Technologies, who was an absolute pleasure to work with. His generous support financially and professionally throughout the whole process was, and always will be, extremely appreciated. I could not have asked for a better company to collaborate with for my thesis.
Lastly, I want to thank my wonderful family and friends for always encouraging me and believing in me throughout the ups and downs of this process. Mom, Dad and Kenzie—I will never be able to put into words how grateful I am to have family like you who offer unconditional love and support. Thank you for showing me that nothing comes easy and that hard work pays off.
v
MAXIMIZING THE AMOUNT OF DNA RECOVERED:
A STUDY OF MAWI DNA TECHNOLOGIES’ ISWAB-ID COLLECTION DEVICE FOR FORENSIC SCIENCE APPLICATION
MICHELLE KRISTEN GORDON
ABSTRACT
In forensic casework, recovery of more deoxyribonucleic acid (DNA) generally leads to a better chance of obtaining a robust and reliable DNA profile. However, DNA evidence often contains a very low amount of cells, therefore, the importance of proper collection and storage to protect the DNA and ensure that maximum collection of cells is achieved cannot be over emphasized. New techniques and inventions have made the collection of DNA evidence more efficient and consistent through the development of different types of swabs, lysing buffers and various other improvements. Even with the development of these improvements, the ability to maximize the collection of cellular material from a substrate is still impeded by various issues in the extraction process along with the structural properties of swabs used for collection.
Research by Adamowicz et al. found that when extracting buccal and blood cell samples collected on cotton swabs, using the recommended protocol for swabs with the QIAampâ DNA Investigator extraction kit, over 50% of the recoverable DNA is retained on the swab or lost through the extraction process [1]. Although cotton swabs are very good at absorbing biological material, they exhibit low efficiency of DNA sample
vi
release. Additional DNA may be lost during the extraction process. An optimal method of collection and extraction for forensic samples will maximize the collection and release of cellular material and minimize the loss of cellular DNA in the extraction process.
The design of the Mawi DNA Technologies’ iSWABTM collection device allows for the release of cells captured from any type of swab into a proprietary lysis and stabilizing iSWABTM buffer. The combination of the mechanistic release of cells and the proprietary lysis buffer claims to maximize the collection of cells from single or several swabs in a pre-measured amount of buffer while eliminating the potential for bacterial growth and contamination. The iSWABTM Device is designed with three prongs and contains cell lysis buffer with DNA stabilization chemistry. As the swab is taken out of the collection device, the prongs provide resistance and essentially squeeze the excess solution and cells off of the swab. Following collection of the cellular material, cell lysis is achieved by incubation in the lysis buffer for 3 hours at room temperature. No additional reagents are necessary.
This study investigated whether the Mawi DNA Technologies’ iSWABTM collection device and buffer could be considered as an alternative method to maximize the recovery of cells/DNA from swabs. Experiments were conducted to test the efficiency and forensic application of the device. The following parameters of the iSWABTM buffer and collection device were tested: 1) ability to collect dried stains; 2) ability to recover cellular material from different types and conditions of swabs; 3) ability to lyse different cell types; 4) ability to stabilize DNA over an extended period of time;
vii
and, 5) ability to perform in downstream Polymerase Chain Reaction (PCR) testing and produce quality STR profiles.
Cumulatively, the data indicates that the iSWABTM-ID collection device is simple, fast and convenient while providing high DNA recovery. Some modifications or additional procedure developments can be done to facilitate the application for use with samples containing very small amounts of biological materials.
viii
TABLE OF CONTENTS
Title Page i
Copyright Page ii
Reader’s Approval Page iii
ACKNOWLEDGMENTS iv
ABSTRACT v
TABLE OF CONTENTS viii
LIST OF TABLES xi
LIST OF FIGURES xii
LIST OF ABBREVIATIONS xiv
1. Introduction 1
1.1 Purpose of Study 7
2. Materials and Methods 10
2.1. Dilution of iSWABTM Buffer Solution 10
2.2. Dilution of QuantiFiler® Duo DNA Standard 10
2.3 Preparation of Saliva Samples 11
2.4 Buccal Cell Counting 11
2.5 Extraction 12
2.5.1 ZyGEM Extraction and Reagents 12 2.5.2 Mawi DNA Technologies’ iSWABTM Buffer Extraction 13
2.5.3 Qiagen Extraction 14
ix
2.6.1 Comparison of Swabs Prepared Days Before Testing vs. Just Prior
to Testing 15
2.6.1.1 Pre-Experiment: Cut Method vs. Scalpel Method 15 2.6.1.2 Wet Swab and Dry Swab Extraction 16 2.6.1.3 Retention of Cells on Swab After Removal from iSWABTM Device 16 2.6.2 Prong and Non-Prong Experiment 17 2.6.2.1 Prong and Non-Prong Sample Preparation 17 2.6.2.2 Retention of Cells on Swabs After Swab Removal and Spin Basket 18 2.6.3 Collection of Dried Stains Experiment 19 2.6.3.1 Semen, Blood and Saliva Sample Preparation 19
2.6.4 Time Course Study 20
2.7 DNA Quantification 21
2.8 Amplification 21
2.9 Capillary Electrophoresis and STR Profile Analysis 22
3. Results and Discussion 24
3.1. Quantifiler® Duo Quantification Data 24 3.1.1. Determination of Concentration of iSWABTM Buffer to Prevent Inhibition
24 3.1.2. Quantification of Varying Volume of iSWABTM Buffer for Cell Lysis 29
3.1.3. Comparison of Swabs Prepared Days Before Testing vs. Just Prior
to Testing 30
x
3.1.3.2. Quantification of Wet vs. Dry Swab Study 32 3.1.3.3. Quantification of Amount Retained on Swab After Using
Collection Device 34
3.1.4. Prong vs. Non-Prong 36
3.1.5. Collection of Dried Stains 41 3.1.6. Comparison of Qiagen Extracted Samples Study 44 3.1.7. Three-Month Time Course Evaluation 46
3.2. STR Profiles 48
4. Considerations and Conclusion 60
LIST OF JOURNAL ABBREVIATIONS 65
BIBLIOGRAPHY 66
xi
LIST OF TABLES
Table 1. Quantifiler® Duo Results for Samples with Varying Concentration of iSWABTM
Buffer Targeting 1 ng/ µL of DNA ... 25
Table 2. Quantifiler® Duo Results for Samples with Varying Concentration of iSWABTM
Buffer Targeting 0.5 ng/ µL of DNA ... 26
Table 3. Quantifiler® Duo Results for Samples with 0.2X Concentration of iSWABTM
Buffer Targeting Various Amounts of DNA ... 27
Table 4. Quantifiler® Duo Results for Varying Concentration of iSWABTM Buffer
Targeting Various Amounts of DNA to Determine Inhibition Cut-Off Value ... 28
Table 5. Quantifiler® Duo Results for Varying Volume of iSWABTM buffer for Cell
Lysis ... 29
Table 6. Quantifiler® Duo Results for Pre-Experiment Using a ZyGEM Extraction ... 32
Table 7. Quantifiler® Duo Results for Wet and Dry Swabs Using a iSWABTM Buffer
Extraction ... 33
Table 8. Comparison of the Amount of DNA Retained on the Swabs After iSWABTM
Buffer Extraction ... 36
Table 9. Percent of the Total Amount of DNA Retained on Swabs ... 36
Table 10. Comparison of the Amount of Total ng of DNA Recovered for the Prong and
Non-Prong Samples ... 38
Table 11. Comparison of the Total Amount of DNA (ng) Recovered from Samples
xii
LIST OF FIGURES
Figure 1. Sketch of iSWABTM-ID Collection Device Courtesy of Dr. Bassam
El-Fahmawi ... 6
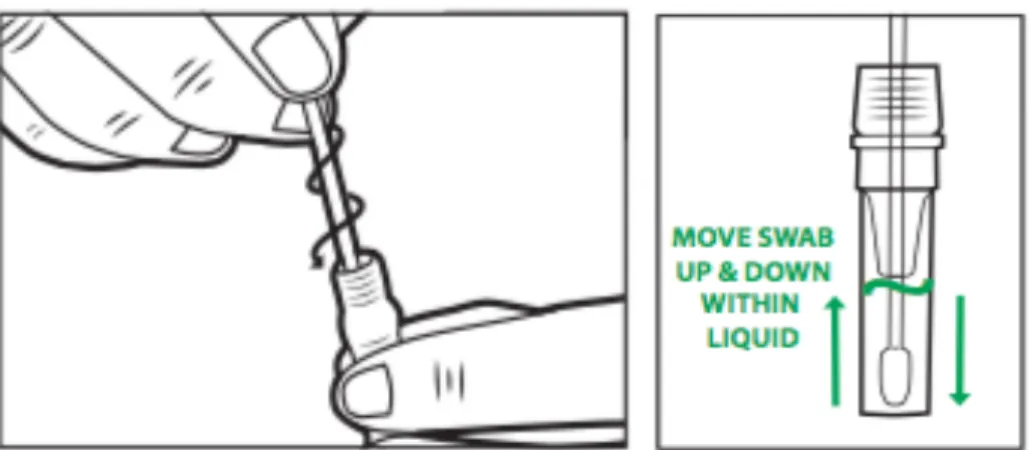
Figure 2. iSWABTM-ID Collection Technique ... 14
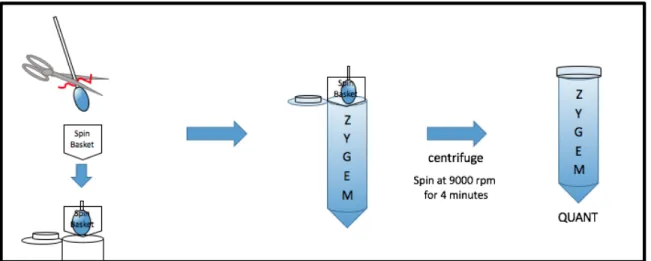
Figure 3. Visual Representation of Sample Preparation for ZyGEM Reaction ... 17
Figure 4. Visual Representation of Experimental Design for the Collection of Dried
Stains Experiment ... 19
Figure 5. Comparison of Wet and Dry Swabs DNA Recovery ... 34
Figure 6. Percent of DNA that is Recovered and Retained for the Prong and Non-Prong
Samples ... 40
Figure 7. The Average Percent Recovery of Total ng of DNA from the Collection of
Dried Stains Experiment. ... 44
Figure 8. Bar graph Showing Average Total Amount of DNA (ng) Observed Across the
Three-Month Time Course Study ... 47
Figure 9. Peak Height Ratios across 16 loci of the Identifiler®Plus Kit.
... 51
Figure 11. Comparison of the Peak Height Ratios for Cotton Swabs and Nylon Flocked
Swabs ... 52
Figure 12. PHR Comparison Between the Samples Amplified using the GlobalFiler® and
the Identifiler® Plus Amplification Kits ... 53
Figure 13. Comparison of the PHR of Samples Using Different Extraction Methods and
xiii
Figure 14. Comparison of average PH across the Time Course Study using GlobalFiler®
vs Identifiler® Amplification Kits ... 56
Figure 15. Comparison of the PHRs across the Time Course Study Using GlobalFiler®
and Identifiler® Plus ... 57
Figure 16. Blue and Green Dye Channels of a Sample Extracted in iSWABTM Buffer and
Amplified Using the GlobalFiler® Kit (0.5 ng of DNA) ... 58
Figure 17. Blue and Green Dye Channels of a Sample Extracted in iSWABTM Buffer and
xiv LIST OF ABBREVIATIONS ˚C Degrees Celsius AT Analytical threshold CE Capillary Electrophoresis CT Threshold Cycle dH2O Deionized water DNA Deoxyribonucleic acid IPC Internal Positive Control
mL Milliliter
mm Millimeter
ng Nanogram
PCR Polymerase chain reaction
PH Peak Height
PHR Peak Height Ratio
PPE Personal protective equipment ProK Proteinase K
RFU Relative Fluorescence Unit rpm Rotations per minute SDS Sodium dodecylsulfate STR Short Tandem Repeat
TE Tris-EDTA
1
1. Introduction
1.1 Collection
Maximizing the collection and improving the quality of deoxyribonucleic acid (DNA) collected is essential in forensic casework because DNA results can be used to associate or to exclude an individual from involvement in a crime. DNA contains our unique genetic material and is found in every nucleated cell, including cells that are present in biological fluids left at crime scenes, such as saliva, blood and semen. Successful DNA profiling of forensic samples is mainly dependent on the quality and the amount of DNA that is recovered from the sample in question [2]. Generally, recovery of more DNA leads to a better chance of obtaining a robust and reliable DNA profile. Often times, DNA evidence will contain very low amounts of cells, therefore, the importance of proper collection and storage to protect the DNA and ensure that maximum collection of cells is achieved cannot be over emphasized. DNA is easily subjected to contamination, bacterial growth, and degradation that can affect the downstream processing of the sample. Common environmental factors that lead to the degradation of DNA include time, temperature, humidity (leading to the growth of microorganisms), light and exposure to various chemical substances [3]. If DNA is not handled properly or collected properly, the specimen can be unfit for analysis. New techniques and inventions have made the collection of DNA evidence more efficient and reliable through development of different types of swabs, lysing buffer and various other improvements. However, even if the cell collection is maximized, cells can be lost by the extraction process through various transfer steps [1].
2
A common way to collect biological evidence is swabbing. Successful recovery of DNA requires that swabs be able to absorb and release the collected biological material. The release of the cells from the swab is essential to achieve maximum collection. Most collection swabs are inefficient in releasing cells; meaning relatively substantial portions of the cells can remain entrapped in the swab [4]. Research from van Oorschot et al. [5], suggests that 20-76% of the DNA that is collected by a cotton swab is lost during the extraction phase, which may be attributed to the swab and the condition of the sample [6]. Similarly, Adamowicz et al. found that when extracting buccal and blood cell samples collected on cotton swabs, using the QIAampâ DNA Investigator extraction kit with its recommended protocol for swabs, over 50% of the recoverable DNA is retained on the swab or lost through the extraction process [1]. While there are many validated methods used to increase low input evidentiary samples, such as, concentrating samples, amplification protocol adjustments, post-polymerase chain reaction (PCR) purification and capillary injection adjustments, the most reliable method to improve the quality of a DNA profile is to maximize collection of cells and DNA initially [1]. Various alterations to extraction protocols, methods of wetting swabs for collection, lysis buffer composition, and swab material and design have been made to try to recover more cellular material off of swabs.
For the QIAampâ DNA Investigator extraction kit, altering the protocol’s initial incubation time and temperature, along with adding vortexing and re-suspension of the swab increased the recovery of DNA off of the swab [1]. The study found that increased yields were observed with 3- and 18-hour incubation periods and that re-suspending the
3
swab yielded an average two-fold increase in recovered DNA from buccal cells and an average three-fold increase with blood cells [1]. Other methods of protocol alterations include modifying the chemical composition of buffers, such as increasing the concentration of Proteinase K (ProK) or adding DNase in differential extractions to avoid multiple rinsing steps [7]. Alternatively, other techniques have been used that do not use chemicals, such as physical manipulation techniques like laser microdissection in which cells are laser cut from a microscope slide.
Another study, discovered that wetting the tip of the swab with laboratory or commercially developed detergent solutions, like sodium dodecyl sulfate (SDS) and Triton X-100, yielded higher quantities of recovered DNA compared to the traditional method of wetting the swab with water [8]. The detergent was found to loosen and solubilize the cells to increase the cell/DNA yield due to its amphiphilic nature. Amphiphilic substances allow solubility in both water and nonpolar solvents; thus, the organic molecules that make up cells (fats, lipids and proteins) become suspended in solution. Water does not have this property and therefore it was concluded that detergents should be utilized for cellular pickup over the commonly used water [8].
Alterations in lysis buffer composition have proved to be beneficial in the recovery of sperm cells off of cotton swabs in sexual assault evidence processing. Sperm cell recovery has been enhanced to as high as 90% when using a novel one-step buffer that contains SDS and ProK, representing a 200-300% increase over conventional differential extraction buffer [7]. Additionally, alterations to the material the swab is made from and manipulations in the physical design have increased DNA yield. A novel
4
material, Diomics X-SwabTM has highly absorptive properties and can dissolve during certain extraction conditions to recover greater amounts of DNA than commonly used swabs [6]. The X-Swab material was also found to enhance the yield of PCR products. There are various different swab materials, such as foam, nylon flocked, polyester and rayon-tipped swabs, that are marketed to collect more DNA and recover more useable DNA depending on the cell type and cell quality.
This study determined whether or not the Mawi DNA Technologies’ iSWABTM collection device could be considered an alternative method to maximize the recovery of cells/DNA off of swabs. The design of the iSWABTM collection device allows for the release of cells captured from any type of swab into a proprietary lysis and stabilizing iSWABTM buffer. The combination of the mechanistic release of cells and the proprietary lysis buffer is supposed to maximum collection of cells from single or multiple swabs in a pre-measured amount of buffer while eliminating the potential for high bacterial growth and contamination. The iSWABTM Device consists of three prongs and buffer stabilization technology contained in a leak proof tube with a screw and o-ring fitted cap. As a swab is removed from the collection device, the prongs provide resistance and essentially squeeze the excess solution and cells from the swab. Following collection of the cellular material, cell lysis is achieved by the suspension of the cellular material in the proprietary lysis buffer for 3 hours at room temperature. There are no heating steps or additional reagents necessary, which makes it a very simple and easy process. If the device can be used as an alternative collection and extraction method, the
5
ease of use and limited hands-on processing would allow the Criminalist to perform other tasks and increase lab efficiency [11-12].
In order for the DNA to be accessible for forensic analysis, the DNA must be released from the cells in a process called extraction. The extraction process removes inhibitors that reduce or prevent PCR amplification and lyses cells to release the DNA molecules for further analysis. There is no “universal” DNA extraction procedure, however, an optimal procedure should be non-toxic, fast, efficient, economical and should recover high purified DNA with minimal loss [9]. Commonly used extraction methods used in forensic DNA laboratories include: organic extractions, solid-phase extractions and Chelex® extractions. Organic extractions, also known as phenol-chloroform extractions, involve the serial addition of several chemicals, such as SDS and ProK to break open the cell membrane and then a phenol/chloroform mixture is used to separate contaminants into the organic phase and DNA in the aqueous phase. Organic extractions are becoming less popular due to the toxicity of the chemicals and because they are more time consuming than other methods [10]. Solid-phase extractions, such as the QIAampâ DNA Investigator extraction kit, follow a bind-wash-elute procedure where the DNA binds to a substrate, typically silica particles, while other proteins/ cellular components are washed away in a series of wash steps. Solid-phase extractions typically yield a high amount of DNA, however some DNA loss can occur throughout transfer steps, wash steps and not all DNA may elute from the silica. Chelex® extraction utilizes a chelating-resin suspension that can be added directly to the sample. Chelex® extraction involves fewer steps than the organic extraction, leading to less opportunities for
6
contamination, but the DNA is not removed from the other cellular components causing not as pure products. Unlike the previously mentioned extraction methods, Mawi DNA Technologies’ iSWABTM-ID collection device contains a proprietary iSWABTM buffer that directly extracts the cells without any addition of reagents or incubation periods. Compared to the commonly used extraction methods in forensics, iSWABTM buffer extractions may be faster and easier to use without compromising DNA recovery or integrity.
Other single tube, direct lysis buffers are on the market, such as ZyGEM’s forensicGEM® Saliva Kit. The forensicGEM® Saliva Kit utilizes an enzyme and 10X
Figure 1. Sketch of iSWABTM-ID Collection Device Courtesy of Dr.
7
Blue buffer. The reagents do not come pre-mixed, like in the iSWABTM collection device. The reagents must be added to the forensic sample and then heated to activate the enzyme to lyse the cells. Similar to the iSWABTM extraction, there is less opportunity for potential contamination and loss of DNA. However, ZyGEM is a “DNA release” chemistry and does not offer assistance with cell release or long-term storage of DNA. Also, because of the heat step, forensicGEM® released DNA is largely single-stranded (approximately 90% according to the manufacturer) [13]. The forensicZyGEM® Saliva Kit was used as a control in most of the studies in order to determine the lysis quality of the iSWABTM buffer.
1.1 Purpose of Study
The purpose of this study was to define conditions and limitations of the use of Mawi DNA Technologies’ iSWABTM-ID collection device for forensic samples and subsequent DNA testing.
The iSWABTM-ID collection protocol states that the buffer must be diluted before PCR amplification in order to prevent inhibition. Inhibitors can interfere with the PCR by interaction directly with DNA or by blocking the activity of the polymerase or other PCR mixture components, thereby preventing target amplification [14]. Experimentally, the extent of dilution of iSWABTM buffer required for uninhibited PCR amplification was determined. The objective of the first experiment conducted was to determine the cut-off value of inhibition. This was done by using various targeted concentrations of DNA and various concentrations of iSWABTM buffer.
8
Since the buffer must be diluted to be compatible with PCR, the next experiment was performed to asses if varying the volume of iSWABTM buffer affected the quality of cell lysis. The iSWABTM-ID collection tubes come with approximately 320 µL of buffer in the tubes, which could make low-input samples very dilute for downstream forensic processing. The concentration of DNA in each extract was determined and Short Tandem Repeat (STR) analysis was performed to assess the quality of DNA profiles from DNA produced using the iSWABTM-ID collection device.
Experiments were designed to answer questions about the efficiency and effectiveness of the iSWABTM-ID collection device for getting cells off of swabs. As previously mentioned, testing has shown that significant quantities of DNA are retained on the swab. The prong mechanism in the device was tested by comparing amounts of DNA recovered from the device to iSWABTM buffer extractions without using the device. Various types of cells (buccal, sperm and white blood cells) and various conditions of the swabs (swabs prepared just before testing and swabs that were dried for days before testing) were tested using the device. Mawi DNA Technologies recommended Puritan®’s HydraFlock Sterile Standard Flock Swab with Polystyrene Handle (Puritan®, Guilford, Maine), so most experiments utilized the nylon flocked swabs, however, the iSWABTM -ID collection device states to be compatible with any type of swab. Therefore, Sterile Cotton Tipped Applicators (Puritan®, Guilford, Maine) were tested in addition to the nylon flocked swabs in a Dried Stain Collection Experiment because the cotton swab has long been the basic and essential tool for collection of DNA evidence for forensic casework analysis [15].
9
A 3-month time course study was conducted in order to test the stability of the DNA from buccal cells in the iSWABTM buffer for long-term storage at room temperature. Sample storage, holding temperatures, and collection methods can differentially affect DNA recovery and consequently, the outcomes from downstream processing of evidence, leading to false conclusions [16]. Samplings were taken every month for 3 months. The DNA concentration in all extracts was quantified and STR profiling was conducted to compare any differences in the quality of the profiles throughout the 3-month period.
10
2. Materials and Methods
All experiments were carried out in compliance with the ethical standards set forth by the Institutional Review Board of Boston University School of Medicine. Proper personal protective equipment (PPE) along with cleaning measures were taken in order to prevent contamination of workspace and samples.
2.1. Dilution of iSWABTM Buffer Solution
iSWABTM buffer contained in the iSWABTM-ID Collection Kit (Mawi DNA Technologies, CA) was diluted with Tris-EDTA (TE) buffer (10 mM Tris, pH 8.0, and 0.1 mM EDTA)to the following concentrations: 0X, 0.05X, 0.10X, 0.15X, 0.20X, 0.25X and 0.30X to determine the limit of inhibition. A 1X concentration of iSWABTM buffer was also tested to observe full inhibition. Samples were prepared in a final volume of 100 microliters (µL).
2.2. Dilution of QuantiFiler® Duo DNA Standard
The QuantiFiler® Duo DNA Standard (ThermoFisher Scientific, Waltham, MA) [200 nanograms (ng)/µL] was diluted with various amounts of TE buffer to target DNA concentrations of 0.5 ng/µL, 1 ng/µL and 2 ng/µL. These diluted QuantiFiler® Duo DNA Standards were used to test the inhibition of the iSWABTM buffer.
11
2.3 Preparation of Saliva Samples
Neat saliva was obtained from an anonymous female donor in a 2.0 milliliter (mL) microcentrifuge tube (Eppendorf, Hamburg, Germany). From the neat saliva collected, a portion was mixed with an equal portion of TE buffer into a new 2.0 mL microcentrifuge tube to clean up the neat saliva. After gently vortexing for 10 seconds, the mixture was centrifuged at 9000 rotations per minute (rpm) for 4 minutes in an Eppendorf centrifuge 5424 (Hamburg, Germany) to allow the buccal cells in the saliva to pellet in the bottom of the tube and the mucus and other saliva components to remain in the solution. Once the supernatant was removed, the pellet was resuspended in TE buffer. The mixture was vortexed for 5 seconds and then centrifuged at 9000 rpm for 4 minutes. This process of washing and pelleting was repeated three times. Finally, the pellet was resuspended to produce a solution of buccal cells in TE buffer.
2.4 Buccal Cell Counting
A Metallized Bright-Line Hemocytometer (Hausser Scientific, Horsham, PA) was used to approximately determine the concentration of cells in the prepared buccal cell solution. First, the cell solution was vortexed for 5 seconds or until the solution appeared homogeneous. Due to the high concentration of DNA targeted, the solution was diluted 1:10. Then 7 µL of the diluted solution was loaded into the Hemocytometer slide with a cover slip. The slide was then viewed at 40X magnification on a Nikon Eclipse
TE2000-S microscope using Phase Contrast Microscopy. The number of buccal cells were counted in five different 1 millimeter (mm)2 sections of the Neubauer ruling on the
12
Hemocytometer. Cells on the perimeter of the lines were included in the count. An average of the five sections was taken to determine the average cell count in 1mm2, which was then used to determine the average number of cells per µL, according to the Hausser Scientific manual. The ruled surface is 0.10mm below the cover glass, so that the volume over each mm2 is 0.10 mm3.
One (1) microliter (µL) = One (1) cubic millimeter (mm3)
Average number of cells/µL = Average cell count per square millimeter / volume * dilution factor (if used)
Based on the result from the calculation of the average number of cells/µL, the average concentration of ng of DNA was calculated per µL by the following calculation:
Average concentration of ng of DNA/µL = average cells/µL * 0.0066 ng/cell
2.5 Extraction
2.5.1 ZyGEM Extraction and Reagents
A forensicGEMTM Saliva kit containing forensicGEMTM (enzyme EA1) and 10X Buffer Blue was obtained from ZyGEM (Hamilton, New Zealand). All extractions were done in 0.2 mL reaction tubes (Applied Biosystems, Foster City, CA, USA). Depending on the concentration of the saliva cell suspension being used, either a 100 µL or 200 µL ZyGEM reaction was utilized. For the 100 µL reactions, 1 µL of forensicGEMTM, 10 µL of the 10X Buffer Blue, 15 µL of saliva cell suspension and 74 µL of TE buffer was used. For the 200 µL reactions, 2 µL of forensicGEMTM, 20 µL of the 10X Buffer Blue, 15 µL of
13
saliva cell suspension and 163 µL of TE buffer was used. The thermocycler procedure was followed from the forensicGEMTM Saliva kit manual. One cycle of a proteinase activation at 75 degrees Celsius (˚C) incubation for 15 minutes and then the proteinase inactivation at 95 ˚C for 5 minutes was performed on a thermocycler (GeneAmp PCR System 9700, Applied Biosystems, Foster City, CA).
2.5.2 Mawi DNA Technologies’ iSWABTM buffer Extraction
Mawi’s iSWABTM Collection Instructions (Mawi DNA Technologies) were followed to extract samples that were on swabs. The iSWABTM vial was held steady in one hand while the only hand slowly twisted the swab into the iSWABTM vial with a corkscrew motion. The swab was pushed through the resistance to the bottom of the tube. Then, the swab was moved up and down rapidly inside the tube 15 times without moving the swab out of the liquid. After, the swab was removed from the vial by slowly twisting it out of the tube in a corkscrew motion, letting the prongs in the device squeeze the excess liquid off of the swab. Once the swab was completely removed, the vial cap was tightly placed on and the vial was vortexed for 5 seconds. To extract liquid samples, 50 µL of the liquid body fluids were pipetted directly into the vial and then vortexed for 5 seconds. The samples were incubated in iSWABTM buffer for at least 3 hours to extract.
14
2.5.3 Qiagen Extraction
For the comparison study, samples were extracted using the QIAampâ Investigator extraction protocol (Qiagen, Valencia, CA). The procedure was performed according to the manufacturer’s recommendations outlined in the Isolation of Total DNA from Small Volumes of Saliva protocol [41]. Qiagen extractions were conducted in triplicate. For each extraction, 50 µL of saliva cell suspension was used. According to the Qiagen protocol, 50 µL of Buffer ATL, along with 10 µL of ProK and 100 µL of Buffer AL were added to the tube and pulse vortexed for 15 seconds and then incubated at 56 ˚C for 10 minutes. Following incubation, tubes were briefly centrifuged and then 50 µL of pure ethanol was added and tubes were incubated at room temperature for 3 minutes. After another brief centrifugation, the lysates from each tube were transferred into QIAampâ MinElute columns that were placed into 2 mL collection tubes and centrifuged at 8000 rpm for 1 minutes. Each sample was washed with 500 µL of Buffer AW1, 700 µL of Buffer AW2 and 700 µL of pure ethanol. Following these wash steps, a
15
new collection tube was inserted under the columns and each tube was centrifuged at full speed (14000 rpm) for 3 minutes to dry the membrane completely. After centrifugation, the columns were placed into 1.5 mL microcentrifuge tubes (Eppendorf, Hamburg, Germany) and were allowed to sit at room temperature with the lids open for 10 minutes. Subsequently, 100 µL Buffer ATE was added to the center of the membrane and the tubes were incubated at room temperature for 1 minute. Each tube was then centrifuged at full speed for 1 minute and the end volume for each sample was assumed to be 100 µL. A 100 µL iSWABTM buffer extraction was performed in triplicate on 50 µL of the same saliva cell suspension.
2.6 Sample Preparation and Manipulation
2.6.1 Comparison of Swabs Prepared Days Before Testing vs. Just Prior to Testing 2.6.1.1 Pre-Experiment: Cut Method vs. Scalpel Method
Two sterile dry nylon flocked swabs with no biological fluid were placed into iSWABTM buffer to mimic the iSWABTM-ID collection protocol. One of the swabs was cut where the swab portion meets the stick and the other swab was shaved using a scalpel. The cut portion of the swab or the shavings of the swab were placed into a spin basket, which was then placed into a 1.5 mL microcentrifuge tube, and centrifuged at 9000 rpm for 4 minutes. The amount of iSWABTM buffer liquid in the microcentrifuge tube was measured and recorded for the cut swab and shaved portions of the swab. This process was repeated 3 times. A saliva cell suspension was created and 15 µL of the saliva cell suspension was added to the iSWABTM buffer. A positive control was created
16
with 15 µL of the saliva cell suspension and no iSWABTM buffer. A 200 µL ZyGEM extraction was performed. Cut samples were diluted to a 0.1X iSWABTM buffer concentration using TE buffer.
2.6.1.2 Wet Swab and Dry Swab Extraction
A saliva cell suspension was created using 2,000 µL of neat saliva and a resuspending volume of 800 µL of TE buffer. The saliva cell suspension was vortexed thoroughly and 50 µL of the solution was pipetted onto three swabs that were dry prior to sample application. The three swabs were left to dry for 3 days and were designated as the dry swabs for testing. Three wet swabs were created by pipetting 50 µL of the same saliva cell suspension on three swabs that were dry before sample application. The wet swabs were created moments before the experiment was conducted. A positive control was created by directly pipetting 50 µL of the saliva cell suspension into the iSWABTM buffer. A negative control contained no saliva cells, just iSWABTM buffer. The iSWABTM-ID collection protocol (Mawi DNA Technologies) was followed to get saliva cells off of wet and dry swabs [12].
2.6.1.3 Retention of Cells on Swab After Removal from iSWABTM Device
Upon removal of the wet and dry swabs from the iSWABTM device, the swabs were cut and were placed into spin baskets that sat on top of 1.5 mL microcentrifuge tubes and centrifuged at 9000 rpm for 4 minutes. After centrifugation, the amount of
17
iSWABTM buffer was measured and recorded. The swab was placed in a 200 µL ZyGEM reaction to lyse any additional cells that remained on the swab.
Figure 3. Visual Representation of Sample Preparation for ZyGEM Reaction
2.6.2 Prong and Non-Prong Experiment
2.6.2.1 Prong and Non-Prong Sample Preparation
To create prong-less devices for comparison purposes, approximately 320 µL of iSWABTM buffer were transferred into each 1.5 mL microcentrifuge tubes. A saliva cell suspension was created and pipetted onto 4 swabs. Two swabs were extracted in the 1.5 mL microcentrifuge tubes with iSWABTM buffer (non-prong samples) and the other two swabs were extracted in the iSWABTM collection devices (prong samples). A positive control was created by pipetting 50 µL of the saliva cell suspension directly into the iSWAB device. A negative control contained 320 µL of iSWABTM buffer without any saliva cells. Non-prong and prong samples were extracted according to the iSWABTM-ID collection protocol. For the non-prong samples, the corkscrew motion was mimicked by
18
moving the swab along the sides of the microcentrifuge tube. All samples extracted for 3 hours in iSWABTM buffer.
2.6.2.2 Retention of Cells on Swabs After Swab Removal and Spin Basket
The prong samples, non-prong samples and positive control nylon flocked swabs were cut where the swab meets the stick. The swabs were all placed into spin baskets, which were in 1.5 mL microcentrifuge tubes and then centrifuged at 9000 rpm for 4 minutes. The amount of iSWABTM buffer was measured and recorded for all samples and then left to extract for 3 hours. These liquid samples were designated as the elute samples. After being spun, the swabs were placed into new 1.5 mL centrifuge tubes and 300 µL of iSWABTM buffer was added to each tube in order to completely cover the swabs to determine how much is left on the swab after centrifugation in the spin basket. The swabs were left to extract in the iSWABTM buffer for 3 hours. After 3 hours, the swabs were removed and centrifuged to obtain all additional DNA extracted from the swab. These samples were designated as the swab samples.
Additionally, three nylon flocked swabs were created with 50 µL of the same saliva cell suspension used in Prong vs. Non-Prong Experiment and were placed into the iSWABTM devices. The swabs were left in the devices for 3 hours for the entire duration of extraction. After extraction, the iSWABTM-ID collection protocol was implemented to spin out the swab then the swab was cut where the swabs meets the stick and the swab was spun out into a new 1.5 mL microcentrifuge tube. The amount of liquid was
19
measured and recorded and then pipetted back into the iSWABTM device. The swabs were then extracted a second time in 300 µL of iSWABTM buffer for 3 hours.
2.6.3 Collection of Dried Stains Experiment
2.6.3.1 Semen, Blood and Saliva Sample Preparation
Neat semen and blood samples were obtained by anonymous donors in 2 mL centrifuge tubes. Neat saliva was washed and cleaned according to the Saliva Cell Preparation protocol previously mentioned. Four petri dishes (Thermo Fisher Scientific, Waltham, MA) were obtained and each petri dish was divided into thirds using a protractor and black permanent marker, so that 50 µL of each body fluid (blood, semen and saliva) were pipetted into its own section of the petri dishes.
Figure 4. Visual Representation of Experimental Design for the Collection of Dried
20
Positive and negative controls were created by pipetting 50 µL of each body fluid onto nylon flocked swabs and cotton swabs. All stains on petri dishes and control swabs were dried for 48 hours. Three nylon flocked swabs were moistened with 100 µL of iSWABTM Buffer and used to collect the three different dried body fluids from a petri dish. Similarly, three cotton swabs were moistened with 100 µL of iSWABTM Buffer and used to collect the dried stains out of another petri dish. This process was repeated with deionized water (dH2O) to moisten the swabs before collection of the dried stains. Collection of the dried stains was standardized by moving the swabs over the dried stains in a circular motion 10 times while applying a similar amount of pressure. All swabs from the petri dishes and controls were extracted in iSWABTM-ID devices. The swabs were left in the buffer for 48 hours and then removed per the removal instructions from the iSWABTM-ID collection protocol. All swabs were placed in spin baskets, which were in 1.5 mL centrifuge tubes, and centrifuge at 9000 rpm for 4 minutes. The excess liquid that was eluted was pipetted back into the iSWABTM devices.
2.6.4 Time Course Study
Three iSWABTM device tubes were obtained and 50 µL of a saliva cell suspension was pipetted directly into each tube. As a degradation control, 50 µL of the cell suspension was also pipetted directly into a 1.5 mL microcentrifuge tube filled with 320 µL of TE buffer. Samplings of the 4 samples were taken at a 1-month, 2-month and 3-month extraction period. During each sampling period, a 20 µL ZyGEM extraction was performed on the saliva cell suspension and the TE buffer samples. The saliva cell
21
suspension was stored at -20 ˚C throughout the study, while the iSWABTM devices and TE buffer with cells were stored at room temperature.
2.7 DNA Quantification
All samples were diluted to a 0.10X concentration of iSWABTM buffer before quantification, with the exception of the samples created in the iSWABTM Buffer Concentration study.
DNA quantification was performed on all samples using the Quantifiler® Duo Quantification Kit (Applied Biosystems, Foster City, CA) using 7500 Real-Time PCR system (Life Technologies, Carlsbad, CA) as per the manufacturer’s protocol. When preparing the reactions, each sample volume totaled 25 µL, including 23 µL of the Master Mix and 2 µL of the extracted DNA sample.
The quantity of DNA within each sample was analyzed using a publicly available Microsoft Excel template. In order to account for potential differences between the various quantification values, the y-intercept and slope from runs of standard curves was used to calculate the concentration of DNA in all the samples before analysis of data, as per methods described by Grgicak et al [17].
2.8 Amplification
Amplification of all samples was performed using the AmpF STR® Identifiler® Plus (Applied Biosystems, Foster City, CA) and the GlobalFilerâ (Applied Biosystems, Foster City, CA) PCR Amplification Kits per the manufacturer’s protocol using 28 cycles
22
for Identifiler® amplifications and 29 cycles for GlobalFilerâ amplifications. The desired target mass was 1 ng of DNA for most Identifiler® amplifications, with the exception of targeting a mass of 0.75 ng of DNA for Identifiler® amplifications that were compared to GlobalFilerâ amplifications. A target mass of 0.5 ng of DNA was used for all GlobalFilerâ amplifications. When needed sample dilutions were made with TE Buffer. DNA samples were amplified on a GeneAmp PCR System 9700 (Applied Biosystems, Foster City, CA). Positive and negative controls were run for each kit with every amplification. Amplified products were stored at -20 ˚C until they could be separated by capillary electrophoresis (CE).
2.9 Capillary Electrophoresis and STR Profile Analysis
CE was performed using a 3130 Genetic Analyzer (Applied Biosystems, Foster City, CA). Samples amplified with Identifiler® Plus were prepared for CE by using a master mix of 9.5 µL of Hi-Di formamide and 0.5 µL of GeneScanTM-600 Lizâ Size
Standard version 2.0 (Life Technologies, Carlsbad, CA) per reaction and 1 µL of amplified product. The GlobalFilerâ samples were prepared using a master mix of 9.6 µL of Hi-Di formamide and 0.4 µL of GeneScanTM-600 Lizâ Size Standard (Life Technologies, Carlsbad, CA) per reaction. GeneMapperâ ID-X Software (Applied Biosystems, Foster City, CA) was used for analysis using an analytical threshold (AT) of 30 relative fluorescence units (RFU) for Identifiler® Plus samples and an AT of 100 RFU for GlobalFilerâ samples. Peak height is based on the RFU that is determined by the
23
fluorescence given off by an allele fragment during the data collection process. The average peak height (PH) for each profile was calculated by dividing the total PH by the total number of alleles in the profile. Peak height ratios (PHR) between sister alleles were determined by dividing the RFU from the allele with the lower PH by the RFU for the allele with the higher PH. The PHR mean was calculated across all the profiles.
2.10 Statistical Methods
Statistical analysis was performed using Microsoftâ Excel for Mac 2016 (Microsoft, Redmond, WA) and JMPâ Pro v. 13 (SAS Institute, Cary, NC).
24
3. Results and Discussion
3.1. Quantifiler® Duo Quantification Data
As previously mentioned, every sample was quantified via real-time PCR (RT-PCR) using the Quantifiler® Duo Quantification Kit and the 7500 Detection System. The Quantifiler® Duo Kit is a multiplexed TaqManTM RT-PCR assay for DNA quantitation which amplifies a total human and a human male target simultaneously [18]. To monitor for inhibition, which occurs when compounds interfere with the reaction and cause varying levels of reduced PCR efficiency, an Internal Positive Control (IPC) is co-amplified with targets in the Quantifiler® Duo Kit. Monitoring the amplification of the IPC, the assay can provide information about the presence of PCR inhibitors and help determine the quantity of extract to use for amplification for different STR multiplex systems [19]. The Quantifiler® Duo Kit contains a known amount of exogenous DNA as the IPC that can be fortified to the sample and amplified. Monitoring the IPC amplification enables the detection of PCR failure due to inhibition when the IPC’s threshold cycle (CT) value is higher than that of an uninhibited PCR reaction.
3.1.1. Determination of Concentration of iSWABTM buffer to Prevent Inhibition
In order to establish the concentration of iSWABTM buffer to use for downstream PCR analysis, a gradient of iSWABTM buffer concentrations were tested. First, a wide range of iSWABTM buffer concentrations were used with a targeted DNA concentration of 1 ng/µL made with a dilution of the Quantifiler® Duo Positive control. The concentrations of iSWABTM buffer were: 0X, 0.05X, 0.1X, 0.2X, 0.5X and 1X. The
25
samples were quantified in duplicate and an average of the values was calculated to obtain the average experimental DNA concentration in ng/uL and average IPC CT.
Inhibition was observed at iSWABTM buffer concentration of 0.5X and 1.0X indicating that samples extracted with iSWABTM buffer cannot go directly to amplification without dilution (Table 1). No inhibition was observed in the other concentration of buffer as evident by their average IPC values falling into the acceptable normal range. The average experimental DNA concentration ranged from 1.054 ± 0.062 to 1.386 ± 0.118 ng/µL, which was very close to the 1 ng/µL that was targeted.
Table 1. Quantifiler® Duo Results for Samples with Varying Concentration of iSWABTM
Buffer Targeting 1 ng/ µL of DNA
This experiment was repeated with a target DNA concentration of 0.5 ng/µL, except the inhibited concentrations of the iSWABTM buffer were excluded. The average IPC CT values were all within the acceptable range, ranging from 28.830 ± 0.053 – 29.350 ± 0.055, giving no indications that inhibition occurred (Table 2). The target DNA
iSWABTM Buffer Concentration Expected DNA
Concentration (ng/µL)
Average Experimental DNA Concentration (ng/µL)
Average IPC CT Value
0X 1.000 1.054 ± 0.062 29.321 ± 0.088 0.05X 1.000 1.371 ± 0.013 28.956 ± 0.080 0.1X 1.000 1.386 ± 0.118 28.817 ± 0.043 0.2X 1.000 1.070 ± 0.194 28.760 ± 0.125 0.5X 1.000 Inhibited Inhibited 1X 1.000 Inhibited Inhibited
26
concentration of 0.5 ng/µL was closely met with the different iSWABTM buffer concentrations, with exception of the 0.2X concentration. The DNA concentration for the 0.2X iSWABTM concentration was 0.255 ± 0.107 roughly a half of what was expected. Since the IPC average CT value for the 0.2X samples was 28.992 ± 0.149, which was within range, and the standard deviation between the samples is large, this loss of DNA could be due to poor pipetting and not due to partial inhibition of the sample.
Table 2.Quantifiler® Duo Results for Samples with Varying Concentration of iSWABTM
Buffer Targeting 0.5 ng/ µL of DNA, N=2 for each condition
In order to make sure partial inhibition was not occurring at 0.2X concentration of iSWABTM buffer, a concentration gradient of DNA was run in duplicate at the 0.2X concentration of iSWABTM buffer. The results in Table 3 confirm that there is no inhibition observed at the 0.2X concentration of iSWABTM buffer when targeting DNA concentrations of 0.1-2 ng/µL.
iSWABTM Buffer Concentration Expected DNA
Concentration (ng/µL)
Average Experimental DNA Concentration (ng/µL)
Average IPC CT Value
0X 0.500 0.620 ± 0.038 29.350 ± 0.055
0.05X 0.500 0.806 ± 0.028 29.034 ± 0.075
0.1X 0.500 0.728 ± 0.047 28.830 ± 0.053
27
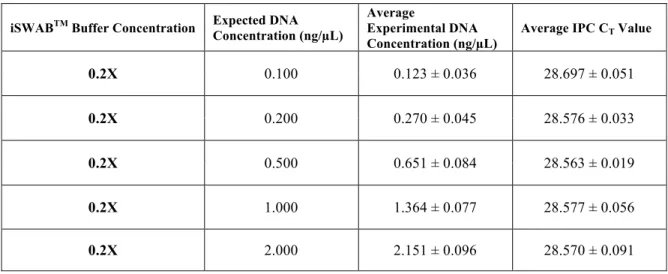
Table 3. Quantifiler® Duo Results for Samples with 0.2X Concentration of iSWABTM
Buffer Targeting Various Amounts of DNA, N=2 for each condition
Finally, to determine the cut-off value for inhibition, concentration values were chosen that were a little above the 0.2X. iSWABTM buffer concentrations of 0.1X, 0.15X, 0.2X, 0.25X and 0.3X were tested using a gradient of target amounts of DNA that included 0.1, 0.5, 1.0 and 2.0 ng/µL of DNA. As observed in Table 4, the IPC values indicate that partial inhibition is observed at 0.25X and complete inhibition is observed at 0.30X concentration of iSWABTM buffer. The IPC values for the 0.35X fall above the accepted range and the targeted amounts of DNA were not observed. Full inhibition was observed at 0.3X because the IPC was inhibited and no DNA was observed. Thus, the data shows that iSWABTM buffer should be diluted at least to a 0.2X concentration before going to PCR because above this concentration PCR inhibition will occur. For the proceeding experiments all samples were diluted to an iSWABTM buffer concentration of 0.1X.
iSWABTM Buffer Concentration Expected DNA
Concentration (ng/µL)
Average
Experimental DNA Concentration (ng/µL)
Average IPC CT Value
0.2X 0.100 0.123 ± 0.036 28.697 ± 0.051
0.2X 0.200 0.270 ± 0.045 28.576 ± 0.033
0.2X 0.500 0.651 ± 0.084 28.563 ± 0.019
0.2X 1.000 1.364 ± 0.077 28.577 ± 0.056
28
Table 4.Quantifiler® Duo Results for Varying Concentration of iSWABTM Buffer
Targeting Various Amounts of DNA to Determine Inhibition Cut-Off Value, N= 2 for each condition
iSWABTM buffer Concentration Expected DNA Concentration (ng/ µL)
Average Actual DNA
Average IPC Ct Value Concentration (ng/µL) 0.1X 0.1 0.141 ± 0.017 28.68 ± 0.08 0.1X 0.5 0.661 ± 0.077 28.76 ± 0.02 0.1X 1 1.469 ± 0.064 28.71 ± 0.02 0.1X 2 2.717 ± 0.139 28.72 ± 0.04 0.15X 0.1 0.168 ± 0.039 28.66 ± 0.05 0.15X 0.5 0.647 ± 0.026 28.63 ± 0.06 0.15X 1 1.378 ± 0.073 28.73 ± 0.04 0.15X 2 2.887 ± 0.173 28.70 ± 0.08 0.2X 0.1 0.132 ± 0.021 28.59 ± 0.05 0.2X 0.5 0.509 ± 0.061 28.72 ± 0.05 0.2X 1 1.312 ± 0.045 28.55 ± 0.05 0.2X 2 2.095 ± 0.274 28.63 ± 0.15 0.25X 0.1 0.002 ± 0.001 31.06 ± 0.42 0.25X 0.5 0.228 ± 0.186 29.09 ± 0.50 0.25X 1 0.15 ± 0.039 29.70 ± 0.15 0.25X 2 0.204 ± 0.142 30.07 ± 0.43 0.3X 0.1 Inhibited Inhibited 0.3X 0.5 Inhibited Inhibited 0.3X 1 Inhibited Inhibited 0.3X 2 Inhibited Inhibited
29
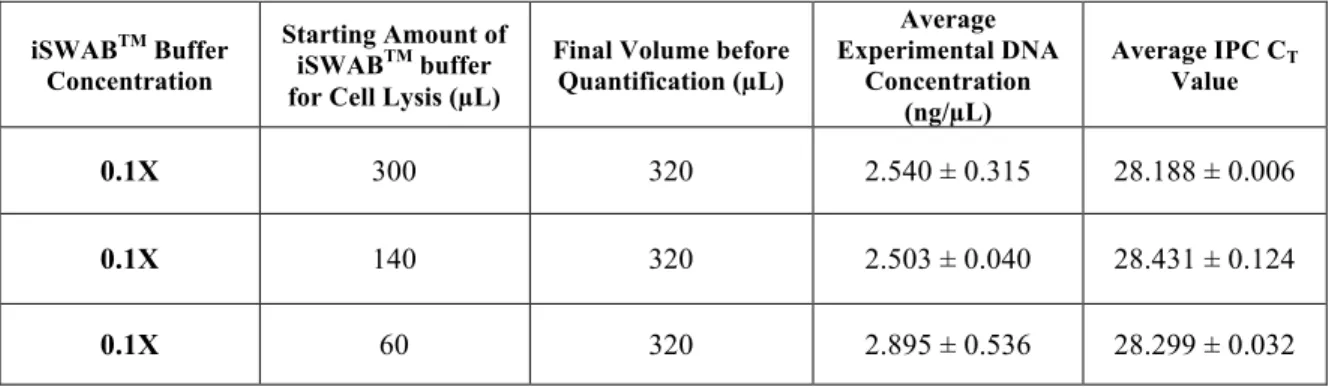
3.1.2. Quantification of Varying Volume of iSWABTM buffer for Cell Lysis
Since iSWABTM buffer must be diluted to at least a 0.2X concentration, the high volume of buffer that is contained in the device, approximately 320 µL, was a concern for low in-put samples. Therefore, an experiment was designed to test if the volume of iSWABTM buffer affects the cell lysis. In this experiment, 300 µL, 140 µL and 60 µL of iSWABTM buffer were pipetted into 1.5 mL microcentrifuge tubes and 20 µL of a saliva cell suspension were added to each microcentrifuge tube. After the 3-hour extraction period, all samples were brought up to a volume of 320 µL for comparison purposes. The samples were immediately diluted to a 0.1X concentration of iSWABTM buffer and then quantified. The results in Table 5 suggest that there is no difference in the extent of cell lysis on DNA availability for PCR when using a 1/5 of normal iSWABTM buffer volume of a cell concentration of approximately 2-3 ng/uL.
Table 5. Quantifiler® Duo Results for Varying Volume of iSWABTM buffer for Cell Lysis
iSWABTM Buffer Concentration
Starting Amount of iSWABTM buffer
for Cell Lysis (µL)
Final Volume before Quantification (µL) Average Experimental DNA Concentration (ng/µL) Average IPC CT Value 0.1X 300 320 2.540 ± 0.315 28.188 ± 0.006 0.1X 140 320 2.503 ± 0.040 28.431 ± 0.124 0.1X 60 320 2.895 ± 0.536 28.299 ± 0.032
30
3.1.3. Comparison of Swabs Prepared Days Before Testing vs. Just Prior to Testing
The objective of this experiment was to compare amounts of DNA obtained from wet swabs (prepared just prior to testing) and dry swabs (prepared and dried days before testing) to determine the amount of DNA retained on swabs after extraction in iSWABTM buffer. According to a study released by the National Criminal Justice Reference Service, swabbing is the preferred sample collection method over taping for recovering DNA [20]. In order to preserve the cells collected on the swab and prevent mold and other bacterial growth, the swabs need to be completely dried prior to transport and storage. Use of the iSWABTM-ID collection device eliminates the need to dry swabs, which would be beneficial during evidence collection at a scene and would also minimize contamination to prevent the previously mentioned issues. Tests were conducted to determine if there were any statistically significant differences in DNA yield when using wet swabs or dry swabs in the iSWABTM device.
3.1.3.1 Pre-Experiment Study
First, a pre-experimental study was performed to assess whether cutting the swab or scraping the swab with a scalpel was a better method to remove the swab from the stick to place it in a spin basket to be spun out. The compatibility of iSWABTM buffer with a ZyGEM reaction was also tested. The iSWABTM-ID collection protocol was mimicked using dry nylon flocked swabs with no cellular material.
Three swabs were processed using the cut method and three other swabs were processed using the scalpel method. In the cut method, the swab was cut directly where
31
the swab met the stick, whereas, in the scalpel method, the swab was scrapped off the stick with a scalpel. The cuts / scrapings of the swab were placed in spin baskets and the excess liquid was collected into a microcentrifuge tube. The amount of liquid was measured for each method. The cut method had an average of 89.67 ± 4.16 µL of excess liquid and the scalpel method had an average of 31 ± 20.07 µL. Due to the large deviation in the scalpel method, the cut method was used in subsequent experiments.
To determine if iSWABTM buffer had any inhibitory effects on a ZyGEM reaction, 15 µL of a saliva cell suspension were added to the cut method excess iSWABTM buffer liquid and TE buffer, 10X buffer and forensicGEM® were added to bring the final ZyGEM reaction volume to 200 µL. The initial quantitation data showed inhibition in all three cut samples. The concentration of iSWABTM buffer in each ZyGEM reaction was calculated. The iSWABTM buffer concentration for all three samples was higher than the 0.25X partial inhibition cut-off value as determined in the previous study. All samples were diluted to a 0.1X concentration of iSWABTM buffer and quantified again. The results indicate that iSWABTM buffer at 0.1X does not inhibit a ZyGEM reaction because all IPC values were within range and the expected concentration of 0.90 ng/ µL was approximately targeted for all three samples (Table 6). When compared to the ZyGEM control that contained no iSWABTM Buffer, the DNA concentrations were similar. Thus, the pre-experiment data confirmed that the cut method should be utilized and a ZyGEM extraction of the cells contained in the excess iSWABTM buffer can be successfully done without inhibition of the sample, so long as the proper concentration of iSWABTM buffer is met to prevent buffer inhibition. An
32
alternative to the ZyGEM extraction is leaving the excess buffer (that contains the retained swab) for the 3-hour extraction period and then diluting to a 0.1X concentration of buffer. This alternative method was used in the subsequent experiments. However, for STR profiling comparison purposes, a ZyGEM extraction of the retained cells was performed for this experiment.
Table 6. Quantifiler®Duo Results for Pre-Experiment Using a ZyGEM Extraction
Sample Description Average Experimental DNA Concentration (ng/µL) Average IPC Ct Value Concentration of iSWABTM Buffer Inhibition After Appropriate iSWABTM Buffer Concentration? Pre-Experiment, Cut Method ZyGEM Extraction, 15 µL of Cells 0.92 ± 0.11 28.78 ± 0.06 0.1X No 0.88 ± 0.00 28.96 ± 0.03 0.1X No 0.81 ± 0.05 28.88 ± 0.04 0.1X No ZyGEM Control, 15 µL of Cells, no
iSWABTM Buffer 0.99 ± 0.31 29.03 ± 0.06 N/A N/A
3.1.3.2. Quantification of Wet vs. Dry Swab Study
Quantification results on the wet swabs, prepared just prior to testing, and dry swabs, prepared 3 days before testing showed that there is no statistically significant difference in the amount of DNA obtained processing a wet vs. dry swab in the iSWABTM-ID collection device (Table 7). All samples were diluted with TE buffer to a 0.1X concentration of iSWABTM buffer before samples were quantified in duplicate. The total amount of DNA (ng) was calculated by multiplying the average experimental DNA concentration (ng/µL) by 320 µL, the total volume of iSWABTM buffer contained in the
33
device, and then finally multiplying by 10, to take account for the dilution of the buffer for quantification of the DNA.
Table 7. Quantifiler®Duo Results for Wet and Dry Swabs Using a iSWABTM Buffer
Extraction Sample Average Experimental DNA Concentration (ng/ µL) Total Amount of DNA (ng) Dry Swabs 1.569 ± 0.056 5,021 1.811 ± 0.150 5,795 1.240 ± 0.027 3,968 Wet Swabs 1.600 ± 0.080 5,120 1.650 ± 0.054 5,280 1.634 ± 0.149 5,229 Positive Control 1.773 ± 0.046 5,674 Negative Control 0.0 0
The overall average DNA concentration for the dry swabs was 1.540 ng/µL ± 0.290 and when compared to the overall average DNA concentration of the wet swabs, which was 1.630 ng/ µL ± 0.030, using a t-test in JMP a p-value of 0.4687 was calculated, indicating that there is no statistically significant difference in the two means.
In Figure 5, the overlapping circles indicate that there is no statistically significant
difference. If there was a statistically significant difference, then the circles would not overlap at all. Therefore, either wet or dry swabs can be used in the devices and one method is not better than the other from a statistical standpoint.
34
3.1.3.3. Quantification of Amount Retained on Swab After Using Collection Device
As previously mentioned, a ZyGEM extraction was performed on the cells in the eluted iSWABTM buffer that was recovered after the swabs were taken out of the iSWABTM collection device, cut and spun. All samples were diluted to a 0.1X concentration of iSWABTM buffer and quantified in duplicate. The total ng of DNA obtained in each sample was calculated. Two methods of analyzing the data were used to obtain a percentage of the total amount of DNA that was left on the swabs after using the iSWABTM device (Table 9).
The first method of analysis was to compare the amount of DNA retained on the swabs to the total amount of DNA in the positive control, which was directly pipetted in to the iSWABTM device so it produces the total DNA applied to the swab. The total ng of DNA in the excess volume was divided by the total ng of DNA in the positive control
1 1.2 1.4 1.6 1.8 2 A
verage Experimental DNA Concentration (ng/uL)
Dry Wet
Method
Each Pair Student's t
0.05
35
and then multiplied by 100 to get a percentage of approximate amount of DNA left on the swab after collection device is used. There was no statistically significant difference in the averages obtained between the approximate percent left on dry swabs vs. wet swabs. The average of the averages was calculated to be 31.8% and thus indicated that approximately 31.8% of the total DNA collected on the swab remained on the swabs. The second method of analysis, taking into account sample variation, determined that 26.3% of the total DNA remained on the swab. Instead of comparing it to the total ng of DNA in the positive control, the second method used the total ng of DNA that was on the swab for each sample individually. Therefore, for each sample, the total ng of DNA obtained in the iSWABTM buffer (Table 7) was added to the total ng of DNA in the excess liquid (Table 8) to obtain the theoretical total ng of DNA in the sample. Then, the ng of DNA in the excess liquid was divided by that total and multiplied by 100 to obtain the percent of total DNA left on the swab. Like in method 1, the averages were not statistically different between the wet and dry swabs, so an overall average was calculated to be 26.3% of the total DNA is left on the swab after using the iSWABTM collection device. These calculations assume that there are no DNA/cells remaining on the swab after it is spun.
36
Table 8. Comparison of the Amount of DNA Retained on the Swabs After iSWABTM
Buffer Extraction
Sample Description Average Actual DNA
Concentration (ng/µL)
Amount of DNA Left on Swab
(ng)
Excess iSWABTM buffer
From Dry Swab
1.65 ± 0.04 1,535 ng
2.11 ± 0.06 1,899 ng
1.93 ± 0.01 1,776 ng
Excess iSWABTM buffer
From Wet Swab
2.17 ± 0.18 1,931 ng
2.22 ± 0.00 1,887 ng
2.12 ± 0.11 1,780 ng
Table 9. Percent of the Total Amount of DNA Retained on Swabs
Method
Overall Average Amount of DNA Left
on Swabs (ng) Method 1: Approximate average % of DNA Left on Swab (compared to Positive Control) Method 2: Approximate average % of DNA Left on Swab (ng of DNA left
on swab/total ng of DNA on sample)
Dry 1,736.4 ± 185.4 30.6 26.1
Wet 1,866.1 ± 77.8 32.9 26.4
3.1.4. Prong vs. Non-Prong
The iSWABTM-ID collection device is considered a device due to the mechanics within the collection tube. Mawi DNA Technologies’ designed the mechanics of the tube to maximize the collection of DNA by placing a prong system within the tube. This patented sample recovery and collection device comprised of a tube, a cap, an insert and an opening. The insert includes an opening at the top that is adhered to the top of the tube, which is where the swab enters from. The insert then extends into three legs that
37
create prongs. The prongs extend inward towards each other, creating a smaller opening at the bottom of the insert. Thus, as the swab is inserted into the top opening, a little force is needed to get the swab through the smaller diameter at the bottom of the insert into the proprietary lysis buffer. Once the iSWABTM-ID collection protocol is followed, the swab is removed by pulling and twisting the swab in a corkscrew motion up through the smaller diameter of the insert, which squeezes the swab out, and then the swab is continued to be wrung out through the top of the tube [21].
An experiment was designed to assess the effectiveness of the prong mechanics of the device. Two saliva cell swabs in the iSWABTM-ID collection device were compared to two saliva cell swabs prepared in the same amount of iSWABTM buffer in microcentrifuge tubes. Mawi DNA Technologies did invent a tool to easily remove the prongs out of the device, but it was not used in this experiment. The collection protocol was mimicked while pulling the swabs out of the microcentrifuge tubes. Similar to the previous experiment, the amount of cells that were retained on the swabs was assessed by spinning the swabs in spin baskets into microcentrifuge tubes. This study went further and determined the amount of cellular material left on the swab after the spin basket step. All swabs, after being spun in the spin baskets, were placed in an iSWABTM buffer volume of 300 µL (volume necessary to fully submerge the swab). All samples (prong/non-prong samples, eluted samples and swabs) were extracted for 3 hours in the iSWABTM buffer. After the extraction, samples were diluted to a 0.1X concentration of iSWABTM buffer and quantified. The average total ng of DNA was calculated for all samples by multiplying the concentration of DNA in ng/µL by the volume of the sample