Neurocomputing 00 (2015) 1–23
Modeling Interaction in Multi-Resident Activities
Asma Benmansour
a, Abdelhamid Bouchachia
b, 1, Mohammed Feham
aaSTIC laboratory, University of Tlemcen,13000, Algeria
bDepartment of Computing, Faculty of Science and Technology, Poole, BH12 5BB, UK
Abstract
In this paper we investigate the problem of modeling multi-resident activities. Specifically, we explore different approaches based on Hidden Markov Models (HMMs) to deal with parallel activities and cooperative activities. We propose an HMM-based method, called CL-HMM, where activity labels as well as observation labels of different residents are combined to generate the corresponding sequence of activities as well as the corresponding sequence of observations on which a conventional HMM is applied. We also propose a Linked HMM (LHMM) in which activities of all residents are linked at each time step. We compare these two models to baseline models which are Coupled HMM (CHMM) and Parallel HMM (PHMM). The experimental results show that the proposed models outperform CHMM and PHMM when tested on parallel and cooperative activities.
Keywords: Activity recognition, Multiple residents, Cooperative and parallel activities, Graphical models.
1.Introduction
In 2020, the number of older adults aged 60 and over is supposed to reach 1 billion, and perhaps 2 billion by 2050. One in ten older people generally lives alone all over the world. Some of them suffer from physical (e.g., reduced mobility) or cognitive diseases (e.g., dementia, Alzheimer) which reduce their ability to live independently and sometimes keep them in risk situations (e.g., forgetting the stove on). Because there is a lack of infrastructures designed to manage the elderly population and a shortage of nursing staff assistance, recent research has focused on maintaining them at home by developing assisted living technologies which help them in the completion of their activities of daily living (ADLs). In this context, human activity recognition (HAR) aims to recognize the ADLs of residents at home. Their physical and cognitive capabilities could also be assessed in order to determine the type of services and assistance required for them over time.
*Corresponding author: +44 1202 962401
So far research related to HAR has devoted a particular attention to the issue of monitoring of a single resident in a smart home assuming that in general elderly individuals live alone. However, the monitoring process is continuous and sometimes scenarios in which multiple people are simultaneously present within the home may take place even though the house is usually inhabited by a single resident (e.g., receive visits from family members or professional health care givers).The smart home solution for maintaining older people at home should not only focus on recognizing ADLs of single inhabitants. Extending HAR systems to multiple residents is necessary and should contribute to the facilitation of the deployment of these systems in real-world environments.
Different types of sensors have been used for multi-resident activity recognition in smart homes, but most of the work has considered video cameras and computer vision techniques to develop HAR systems. The use of camera is, however, not suitable due to privacy concerns.
Recently, many studies have been interested in the use of pervasive sensors to recognize multi-resident ADLs. In this context, we clearly distinguish two main types of developments:(i) those based on wearable sensors such as accelerometer, gyroscope, etc. and (ii) those based on infrastructure sensors, such as motion, reed switches, etc. A lot of studies have been conducted using wearable sensors, where the identification of the person triggering the sensor individuals is straightforward. The disadvantage of wearable sensors is that they cause inconvenience and are impractical for situations in which individuals are opposed to wear the sensors, forget to wear them like elderly people with cognitive impairment. Moreover, pervasive infrastructure sensors offer the advantage of being non obtrusive to people as they are seamlessly placed in the environment. They could be either wall-mounted (e.g., Passive Infrared Sensors placed on the ceiling) or placed on objects (e.g., reed switches placed on doors). Using these non-intrusive sensors allows the residents to live as normally as possible and not feel restrained by the technology that surrounds them while they perform their ADLs at home.
Living spaces are usually inhabited by more than a single person. Therefore, multi-resident HAR brings additional challenges related to the types of ADLs encountered in a multi-resident living space. While single residents generally perform sequential, interweaved and concurrent activities, multiple residents not only carry on all these types of activities for each resident individually but also collaborative activities that involve interaction.
Interaction takes place in a setting where the residents work together in a cooperative manner to accomplish an activity, such that each resident performs certain actions of that activity. They can either perform the actions independently in parallel (e.g., one resident is chopping vegetables while the other is boiling broth to make soup) or together (e.g., two residents moving a table). In a multi-resident HAR system, the recognition of collaborative activities and parallel unrelated activities is equally important. Some studies addressed the problem of multi-resident HAR using non-intrusive sensors and few of them modeled collaborative activities. In (Chiang et al., 2010), Coupled Hidden Markov Model (CHMM) was applied. In (Chen and Tong, 2014) both HMM and Conditional Random Field (CRF) were applied and compared. In (Alemdar et al., 2013) HMM was used to model with multi-resident activities.
The present paper investigates this direction further. The goal is to accurately recognize both parallel and collaborative activities from non-intrusive sensors. We do not focus on only one of the two types of activities as done in the literature related to multi-resident activity recognition, but on both types. Specifically, this work makes the following contributions:
− We propose a variant of the combined label approach based on HMM applied in (Chen and Tong, 2014)(Alemdar et al., 2013), we call it CL-HMM. In addition to the use of combined labels for the pair of activities labels (i.e., Resident 1 activity label and Resident 2 activity label), our approach
also suggests the use of combined labels for the pair of observations (i.e., the observation of Resident 1 and the observation of Resident 2).
− We also propose a linked version of HMMs (LHMM) to model multi-resident activities and describe the corresponding version of the Viterbi algorithm. To the best of our knowledge this model has never been applied for pervasive multi-resident HAR.A baseline model that consists of parallel HMMs (PHMM) for the residents is developed, where each resident is modeled as one separate HMM. This model does not explicitly represent any inter-resident interaction.
− We compare the performance of all of the proposed models, CL-HMM, LHMM and PHMM against the state-of-the-art model CHMM used in (Chiang et al., 2010).
While the present paper focuses on HAR in a multi-resident environment, it is worthwhile to stress the fact that HAR in a single-resident environment is still an active research area as many issues remain unresolved, such as the recognition of complex activities (Liu et al., 2015, p. 2) and interweaved activities (Meditskos et al., 2015). Several recent papers highlight the challenges encountered in this field as shown in (Amiribesheli et al., 2015) and (Ni et al., 2015). In a recent work, Amiribesheli et al. (2015) discuss the challenges related to data processing (i.e., maintaining the security, privacy and reliability of an activity data)and to activity recognition modelling (i.e., recognizing interweaved and concurrent activities, imbalanced data, online activity learning, applicability and adaptability of the activity model, scalability of the activity model). Ni et al. (Ni et al., 2015) discuss eight challenges to solve before improving the quality of life in a smart home for an elderly. Clearly, HAR in a multi-resident environment only represents one of the challenges to face among many others relevant to HAR in a single resident environment.
The remainder of this paper is organized as follows. Section 2, introduces the state-of-art multi-resident activity recognition work. Section 3, describes the proposed graphical models CL-HMM and LHMM. Section 4 discusses the evaluation of such models, their comparison against PHMM and CHMM as well as against existing studies which relied on the same dataset (i.e., Multi-resident ADLs of CASAS). Section 5, concludes the paper.
2.Related Work
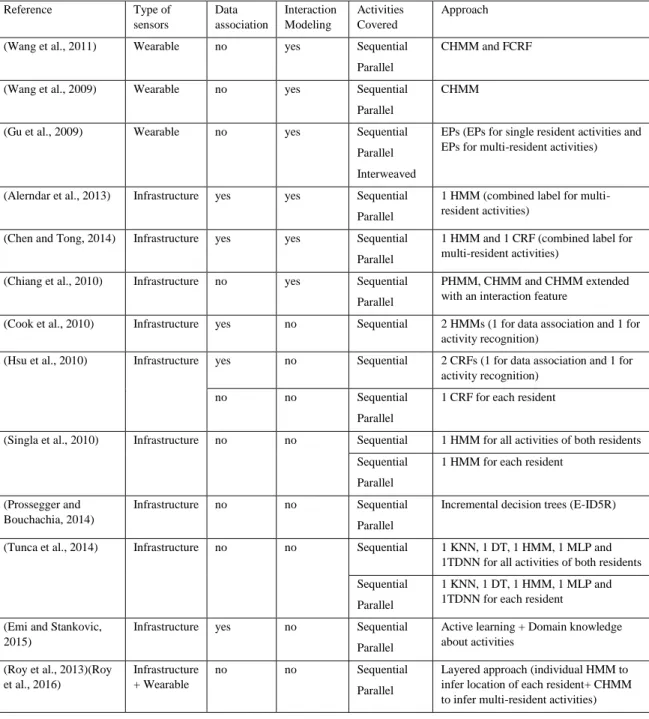
Recently, a number of studies on multi-resident activities in the pervasive environment have been conducted. A survey paper by (Benmansour et al., 2015) provides an overview of existing approaches and current practices for HAR in multi-resident environments. Table 1, shows the most visible studies characterized by various features. Relying on wearable sensors, Wang et al. (Wang et al., 2009) used CHMM to recognize multi-resident activities. The same authors applied later CHMM along with Factorized Conditional Random Field (FCRF) in (Wang et al., 2011). In particular, they proposed one HMM is constructed for each resident to form CHMM. Hidden states in each HMM represent the set of activities performed by the resident. Likewise, one CRF is constructed for each resident in the FCRF. However, co-temporal dependencies between activities of residents are represented differently in CHMM and FCRF. Considering, these co-temporal dependencies in CHMM, each activity in HMM does not depends on only the previous activity at time t-1 of the same HMM, but also on the previous activities at time t-1 from the other HMMs. In FCRF, activities of all CRFs corresponding to the residents are joined at each time step and the same observation sequence is fed to all CRFs. In this study, it was found that CHMM performs better than FCRF in the case of cooperative activities (e.g., the accuracy of CHMM on the cooperative activity “watching TV” is 100%, while that of FCRF is 70.5%).
Table 1: Summary of the related work studies Reference Type of sensors Data association Interaction Modeling Activities Covered Approach
(Wang et al., 2011) Wearable no yes Sequential
Parallel
CHMM and FCRF
(Wang et al., 2009) Wearable no yes Sequential
Parallel
CHMM
(Gu et al., 2009) Wearable no yes Sequential
Parallel Interweaved
EPs (EPs for single resident activities and EPs for multi-resident activities)
(Alerndar et al., 2013) Infrastructure yes yes Sequential Parallel
1 HMM (combined label for multi-resident activities)
(Chen and Tong, 2014) Infrastructure yes yes Sequential Parallel
1 HMM and 1 CRF (combined label for multi-resident activities)
(Chiang et al., 2010) Infrastructure no yes Sequential
Parallel
PHMM, CHMM and CHMM extended with an interaction feature
(Cook et al., 2010) Infrastructure yes no Sequential 2 HMMs (1 for data association and 1 for activity recognition)
(Hsu et al., 2010) Infrastructure yes no Sequential 2 CRFs (1 for data association and 1 for activity recognition)
no no Sequential
Parallel
1 CRF for each resident
(Singla et al., 2010) Infrastructure no no Sequential 1 HMM for all activities of both residents Sequential
Parallel
1 HMM for each resident
(Prossegger and Bouchachia, 2014)
Infrastructure no no Sequential
Parallel
Incremental decision trees (E-ID5R)
(Tunca et al., 2014) Infrastructure no no Sequential 1 KNN, 1 DT, 1 HMM, 1 MLP and
1TDNN for all activities of both residents Sequential
Parallel
1 KNN, 1 DT, 1 HMM, 1 MLP and 1TDNN for each resident (Emi and Stankovic,
2015)
Infrastructure yes no Sequential
Parallel
Active learning + Domain knowledge about activities
(Roy et al., 2013)(Roy et al., 2016)
Infrastructure + Wearable
no no Sequential
Parallel
Layered approach (individual HMM to infer location of each resident+ CHMM to infer multi-resident activities)
(Gu et al., 2009) used Emerging Patterns (EPs) to model the difference of activities. EPs can be considered as itemsets with support that changes significantly between datasets. They were mined for both parallel and cooperative activities. Using wearable sensor data, the authors noticed that EPs tend to recognize the activities as cooperative activities even when they are not.
Many studies on multi-resident HAR used infrastructure sensors. In this context, some studies focused on the data association problem which is about recognizing the residents (Hsu et al., 2010)(Cook et al., 2010). Although, we are not dealing with the problem of data association in this study, we argue that developing solutions for this problem is crucial for deploying HAR systems. For instance, (Hsu et al., 2010) showed that the quality of data association results impacts the quality of activity recognition if both are integrated in one system. In this study, two-layer cascade architecture was proposed, where each layer consists of a CRF model. The first layer is used for model data association, while the second layer is applied to recognize the activities. Likewise (Cook et al., 2010) constructed one HMM model to recognize the residents followed by another HMM to recognize the activities. The disadvantage of these cascaded architectures is that the performance of the activity recognition module is low when the sensor data is incorrectly associated with the resident. Moreover, in the inference step of the activity recognizer, one activity label is inferred at each time step, that is the activity of the resident inferred by the data association recognizer.
Other studies not dealing with data association also proposed to recognize activities without distinguishing the residents. For instance, (Singla et al., 2010) used a single chain HMM to model the activities of two residents. The hidden states represent the activities of both residents. For example, Resident 1 performs activity 1, 2 and 3; while Resident 2 performs activity 3, 4 and 5. In the inference step, one activity label is inferred; it represents either activity of Resident 1 or activity of Resident 2. (Tunca et al., 2014) compared five different classifiers namely, K-Nearest Neighbor (KNN), Decision Trees (DT), HMM, Multi-Layer Perceptron (MLP) and Time-Delay Neural Network (TDNN). They grouped similar activities into abstract activities and considered only dominant activities in the case of parallel activities. The TDNN and HMM performed slightly better than the other classifiers. Like in (Hsu et al., 2010)(Cook et al., 2010), these approaches do not recognize neither parallel activities nor cooperative ones. Disregarding the data association problem, some studies proposed a separate model for each resident as shown in the second approach of (Hsu et al., 2010), the second approach of (Singla et al., 2010) and the second approach of (Tunca et al., 2014). These studies, however, did not deal with cooperative activities and only with parallel ones.
On the contrast, some investigations (Alemdar et al., 2013)(Chen and Tong, 2014)(Chiang et al., 2010) did consider interaction between residents. In particular, (Alemdar et al., 2013)(Chen and Tong, 2014) used conventional HMM and CRF showing the advantage of fitting such classical graphical models for single resident activity recognition. They used respectively a single HMM chain and a single CRF chain to model multi-resident activities by defining “combined labels”. The same process was applied in both studies but on different datasets. Specifically, each observation in the dataset was associated to a label pair (activity label of Resident 1, activity label of Resident 2). The pair was then converted into a scalar to represent one combined label. The hidden states represent the combined labels and observations represent mixed multi-resident observations. In the inference step, the combined label state is inversely mapped onto the corresponding individual activity labels. (Chen and Tong, 2014) compared the HMM-based method against the one applied in (Hsu et al., 2010)(Singla et al., 2010) on the same dataset, showing that their method was on average better by almost 10% and that HMM performed slightly better than CRF.
To explore whether human interaction increases the accuracy of multi-resident recognition models, (Chiang et al., 2010) investigated an approach to analyze close-proximity interaction. The study uses a binary interaction feature that indicates if the two residents are in the same region of the environment or not. They compared the performance of three models: PHMM, CHMM and CHMM with the interaction feature. The results showed that the extended CHMM performs slightly better than CHMM. Moreover, the conventional
CHMM out-performs PHMM which indicates that ignoring dependencies between the activities, as done by PHMM, has a negative impact on the recognition rate. The study demonstrated also that the presence of residents in the same room does not imply that the residents are involved in cooperative activities.
Unlike traditional classification decision trees (DT) usually applied in single resident activity recognition, (Prossegger and Bouchachia, 2014) suggested the use of an incremental DT algorithm called E-ID5R which can represent single or multiple activities at time to recognize both parallel and cooperative activities. The experimental evaluation on real-world datasets showed that E-ID5R performs differently.
(Afrin Emi and Stankovic, 2015) presents an activity recognition platform based on active learning techniques called SARRIMA. The proposed work extends the AALO approach presented in (Hoque and Stankovic, 2012) by considering the co-existence of multiple residents at home. SARRIMA relies on domain knowledge about activities (e.g., locations, objects involved, most likely time of the day) and specific assumptions on these ones (e.g., preparing dinner is usually performed in the kitchen). SARRIMA solves both the data association problem by the use of the person identification module and the activity recognition problem (i.e., parallel and sequential ones) by the use of the ADL recognition module. These modules can operate independently and separately of each other when only one of the latter problems is posed. They can also exchange information in order to identify a person and to check the choice of a recognized ADL. This approach detected about 97% of activity instances.
Some interesting studies rely used wearable sensors (i.e., embedded sensors in Smartphones and infrastructure sensors (i.e., motion sensors) to recognize parallel activities in a mutli-resident environment (Roy et al., 2013)(Roy et al., 2016). Authors in these studies applied a layered approach. First, the Smartphone accelerometer data for different postures (e.g., walking, sitting, etc.) is extracted. Then, an HMM is constructed for each resident where the hidden states are the locations (e.g., kitchen, bathroom, etc.) of the resident. Finally, CHMM is applied to recognize complex activities of all residents. The observations in each of the CHMM’s HMM represent both the posture (i.e., inferred in the first layer) and the location (i.e., inferred in the second layer), while the hidden states represent the activities. The experimental results obtained on a five residents showed an accuracy of 70% compared to 40% using only the accelerometer data. However, in this study cooperative activities were not considered.
3.Proposed Models for Multi-Resident HAR
To model multi-resident activities, we propose in this paper the HMM-based combined label approach (CL-HMM) and the linked hidden Markov model (LHMM). In the following both models are described. Without loss of generality, we assume that we have two residents living in the same home. Let N and M be the number of activities performed by Resident 1 and Resident 2 respectively and let Q be the number of sensors present in the living space and trigged by the two residents. The description presented below can be easily generalized to any number of residents and is based on the following assumptions:
− The data association variables are given (i.e., we know who triggered which sensor).
− In each resident's HMM of the LHMM, the hidden states represents the activities performed by the resident while observable states correspond to the sensor events generated by the resident.
− We are dealing with discrete data for both the activities and the sensory data.
− We have the ground truth activity corresponding to each resident's observation in the dataset, we therefore apply a supervised learning which means that parameter estimation is achieved by frequency counting of occurrences of states, transitions and observations (Rabiner, 1989).
− The Viterbi algorithm is applied only in the test step to infer the sequence of hidden states (i.e., the activities) that best explains a new sequence of observations (i.e., sensor events).
We describe in the following parameter estimation as well as the Viterbi algorithm for each of the two models.
3.1.Hidden Markov Model based Combined Label(CL-HMM) 3.1.1.Definition
Each resident has own sequence of sensor events that the activities. Thus, each resident has an observation at each time step as part of an activity. In an environment including k residents, this would result into a vector of length k for the observations and a vector of length k for activity labels at each time step. CL-HMM primarily consists of converting and combining the activities (L1j, L2j, …, Lkj) and the corresponding data (o1j,
o2j, …, okj) of individual residents into a single observation (o) and a single combined activity label (L). Once
this pre-processing step is completed, the learning process can start.
3.1.2.Setup
Instead of considering that each resident's activities A1 and A2 have their corresponding observations O1 and O2, in a two-resident environment, we suppose that each pair of activities at each time step generates a pair of observations. That is, the pair of activities (at1, at2) generates the pair of observations (ot1, ot2) at time t.
The CL-HMM approach can be divided into five main steps:
a. Define the sets CLA and CLO of combined label of activity pairs and combined label of observation pairs respectively. If we consider all activities of the two residents that can appear in parallel, the number of resulting combined labels is N×M. However, some activities cannot occur in parallel in real world situations. For instance, Resident 1 cannot take a shower if the bathroom is occupied by the Resident 2; thus the number of combinations can be reduced. Using the experimental data, we extract non redundant pairs of activity labels and attribute to each pair a scalar resulting then into the set of combined labels for activities CLA. For instance, CLA consists of = {1, 2, 3, 4} as the set of combined labels for activities pairs (1, 2), (2, 1), (1, 3), (3, 4).The same process is applied to extract non redundant pairs of observation labels from the data. This will result in Q×Q possible values for the CLO set. However, due to the fact that some sensors do not occur in parallel in real-world situations (e.g., the phone sensor cannot be trigged by both residents at the same time), the cardinality of CLO will be smaller than Q×Q.
b. Using the CLA set, we then convert each pair of multi-resident activities labels (a1, a2)(1:T) (i.e., {(a1(1),
a2(1)), (a1(2), a2(2)),..., (a1(T), a2(T))}) into combined activities a(1:T)C. Likewise, using the CLO set we convert
each pair of multi-resident observations labels (o1, o2)(1:T) into combined observations o(1:T)C respectively.
c. Estimate the HMM parameters - An HMM is then applied on the data resulting from the previous step to build an activity model. In this HMM, hidden states represent the combined activity label a(1:T)C, while the
observed states represent the combined observations of both residents o(1:T)C. The HMM consists of the
initial state vector, the transition matrix and the observation matrix as follow:
)
(
)
(
i
P
a
1i
C C
, (1))
(
a
j
a
1i
P
Q
C t C t C ij
, (2))
(
)
(
i
P
o
a
i
B
tC
tC tC
, (3) where i=1... N×M, and BCt(i) is an (N×M) by (QxQ) matrixAs mentioned earlier, parameter estimation is simply achieved by frequency counting of occurrences of initial states, transitions and observations (Rabiner, 1989). For example, πC(1) represents the number of training sequences in which the combined label state (1) appears at the beginning divided by the total number of training sequences. Likewise, for the transitions, Q31Crepresents the number of transitions from
the combined activity label 3 to the combined activity label 1 divided by the number of outgoing transitions from the combined activity label 3. Similar frequency count for the observations can be done for example BC(2) is a vector indicating the observation probability of all the combined observations (1...Q2) from the combined activity label 2. To count the probability of a specific observation from the combined activity label 2 that is P(otC=1|atC=2), we compute the number of occurrence of combined activity labels 2
in which the combined observation label 1 appears divided by the occurrence frequency of the combined label 2.
d. Inference for the HMM - Given an observation sequence OC we need to find a state sequence AC which maximizes P(AC|OC). The Viterbi algorithm for HMM (Rabiner, 1989) outputs the best state sequence AC which represents the best state sequence of the combined activities. This results in a computational complexity of O(T2N2M2) where T is the total number of events of the dataset. Considering, R residents each having a number of corresponding activities Ni for i=1...R, the computational complexity would be
O(TR∏i=1R Ni2).
e. Extract each resident activity sequence A1 and A2 - The obtained combined activity label, AC, from the previous step is then converted back into the original individual activities of the two residents A1 and A2. 3.2.Linked Hidden Markov Model (LHMM)
3.2.1. Definition
LHMM was introduced for the first time in (Brand, 1997). The latter represents a combination of multiple HMMs, where each HMM consists of a set of hidden states and a set of observed states. It is called Linked HMM because there are direct edges from hidden states of an HMM to the hidden states of the other HMMs as shown in Fig.1.
When a LHMM is applied to HAR, an HMM is constructed for each resident in the environment. For instance, in a two-resident setting, {A1, O1} and {A2, O2} represent the sequence of activities and sensor events from Resident 1 and Resident 2 respectively. In each HMM chain, hidden states represent the activities of the corresponding resident, whereas the observations represent sensor events. That is, Ai={a(1:T)i} (i=1,2)
are the hidden states and Oi={o(1:T)i} are the corresponding observations for Resident i. The pair of HMMs is
combined to obtain LHMM (see Fig. 1). When two residents in a smart home perform cooperative activities, the activity of one resident at time t can affect not only the activity at time t+1 in the same model, atn to at+1n,
but also the activity of the other resident, atn to atm. Since both HMMs are not independent, the posterior of the
Fig.1: Topology of LHMM (blank squares indicate the hidden states, the shaded squares indicate the observed states)
(1) (2
)
) 2 ( ) 1 ( ) 2 ( ) 1 ( ) 2 ( ) 1 ( ) 2 ( ) 1 ( ) 2 ( ) 1 (,
,
,
,
,
,
O
O
P
A
A
P
A
A
O
O
P
O
O
A
A
P
(4)
(1) (2) (1) (2)
(1) (2)
) 2 ( ) 1 ( ) 2 ( ) 1 ( ) 2 ( ) 1 ( ) 2 ( ) 1 (,
,
,
,
,
,
,
A
A
P
A
A
O
O
P
O
O
P
A
A
P
A
A
O
O
P
(5)
According to the condition of independence given in the structure (Fig.1), we can factorize P(O1, O2| A1, A2) and P(A1, A2) as follow:
(2)
(1) (2) (1) (2)
1 ) 1 ( 1 ) 2 ( 1 ) 1 ( 1 ) 2 ( ) 1 ( ) 2 ( ) 1 (,
,
...
,
,
,
,
O
A
A
P
o
o
a
a
P
o
To
Ta
Ta
TO
P
(6)
where:
(2) (1) (2)
1 ) 2 ( ) 1 ( ) 1 ( ) 2 ( ) 1 ( ) 2 ( ) 1 ( ) 2 ( 1 ) 1 ( 1 ) 2 ( 1 ) 1 ( 1,
,
...
,
,
,
t t,
t T t t t t T T T To
a
a
P
o
a
a
P
o
a
a
o
P
a
a
o
o
P
(7)
and
a
1(1)a
2(1)o
2(1)a
1(2)a
2(2)o
1(2)o
2(2)a
1(1)o
1(1)a
2(1)o
2(1)a
1(2)a
2(2)o
1(2)o
2(2)o
1(1)
T t t t t ta
a
a
a
P
a
a
P
A
A
P
2 ) 2 ( 1 ) 1 ( 1 ) 2 ( ) 1 ( ) 2 ( 1 ) 1 ( 1 ) 2 ( ) 1 (,
,
,
,
(8)
P(at (1) , at (2)) is a hidden state pair at time t as a combination of the hidden states of the chains A1 and A2 . P(at (1) , at (2) | at-1 (1) , at-1 (2)
) is the transition probability of the hidden state pairs, P(ot (1) |at (1) , at(2)) is the observation probability of o(1:T) 1
from all possible hidden state pairs and P(ot (2)| at (1) , at (2)) is the observation probability of o(1:T) 2
from all possible hidden state pairs.
We proceed like in the case of CL-HMM, we combine and convert the pair of activities corresponding to Resident1 and Resident 2 into a single combined activity label (L) to obtain the sequence AC. To do that, we define the CLA set (see step one in section 3.1.2) and use it to convert each pair of multi-resident activities labels (a1, a2)(1:T) into combined activities a(1:T)
C .
3.2.2. Parameter estimation
Considering the pair of activities (at (1)
, at (2)
) as one activity at (C)
(see Eqs. (4)-(8)), the parameters of our LHMM are:
)
(
)
(
i
P
a
1Ci
C
, (9))
(
a
j
a
1i
P
Q
ijC
tC
tC
, (10))
(
)
(
1 1i
a
o
P
i
B
t
t tC
, (11))
(
)
(
2 2i
a
o
P
i
B
t
t tC
, (12)where i=1...N×M and both Bt1(i) and Bt2(i) are N×M by Q matrix. πC(i) is the initial state vector of the
combined activity label sequence AC, QijC is the transition matrix of AC. Bt1(i) and Bt2(i) are the probability of
observing O1= o(1:T)1, O2= o(1:T)2 from AC respectively. Like with CL-HMM, all parameters of LHMM are
easily computed using frequency counting of occurrences of initial state vector, transitions and observations (Rabiner, 1989). It does not differ from CL-HMM to LHMM when computing the initial state vector and the transition matrix of the single combined activity label sequence AC.
The main difference between our Linked HMM and our CL-HMM lies in the conditional independencies of the observations O1 and O2 over the single combined activity label AC. Because, in CL-HMM, O1 and O2 are converted too into a single combined observation label OC, they are considered to be relatively dependent over the single combined activity label sequence AC.O1, O2 in LHMM are conditionally independent over AC. 3.2.3. Inference
LHMMs inference is formulated as follows. Given an observation sequence O={O1, O2}, we need to find a state sequence AC which maximizes P(AC| O1, O2).We apply the Viterbi algorithm for HMM (Rabiner, 1989). The latter outputs the best state sequence AC which represents the best state sequence of the combined activities. According to Eq. (7), the sequences of observations O1, O2 are conditionally independent over the
single combined activity label AC, that is, P(O1, O2|AC)= P(O1|AC)× P(O2|AC)(i.e., BtC(i)= Bt1(i)× Bt2(i)). The
description of the Viterbi is shown in the following:
Let δt(i) be the maximal probability of state sequences of the length t that end in state i and produce
the t first observations for the given model.
P
a
a
a
o
o
o
o
o
o
a
i
i
t t tC C t C C t(
)
max
(
),
(
)...,
(
);
(
,
),
(
,
),...,
(
,
)
(
)
) 2 ( ) 1 ( ) 2 ( 2 ) 1 ( 2 ) 2 ( 1 ) 1 ( 1 1 2 1
(13)The matrix ψ is used to retrieve the optimal hidden states at the backtracking step.
Initialization
0
)
(
)
(
)
(
)
(
)
(
1 2 1 1 1 1
i
i
B
i
B
i
i
C
(14) Recursion
C
ij t i t t t C ij t i tQ
i
j
j
B
j
B
Q
i
j
)
(
max
arg
)
(
)
(
)
(
)
(
max
)
(
1 2 1 1
(15) Termination
arg
max
(
)
)
(
max
*
i
a
i
P
T i C T T i
(16) Path backtracking
C t t C ta
a
1 1 , t=T-1, T-2...1 (17)where P* is the maximum likelihood of δT(i) at time T and aTC is the most probable combined label for the
activities at time T. The obtained combined activity label, AC, from the previous step is then converted back into the original individual activities of the two residents A1 and A2.
This Viterbi algorithm results in a computational complexity of O(T N2M2) where T is the total number of events in the dataset. Considering, R residents each having a number of corresponding activities Ni for i=1...R,
4.Experiments
In the following we will describe the dataset as well as the preprocessing associated with before introducing two models PHMM and CHMM against which our models LHMM and CL-HMM are compared. Two main experiments are studied. In the first we present the results of the individual residents using all models; while in the second experiment joint results after preprocessing are discussed. Special attention is given to the performance of the models on cooperative and parallel activities.
To evaluate the models proposed in this study we use a publically available multi-resident dataset which is the CASAS "Multi-resident ADLs" dataset2(Singla et al., 2010). This dataset was collected through 26 volunteer pairs performing 15 scripted activities. Some activities are individual like 'filling medication dispenser', 'hanging up clothes', 'reading magazine', 'sweeping floor', 'setting the table', 'watering plants', and 'preparing dinner'. Others are cooperative activities like 'moving furniture', 'playing checkers', 'paying bills', and 'retrieving dishes from a kitchen cabinet'. Such activities were pre-determined and repeatedly performed. This collection accounts for inter-subject variability, yet it is not sufficient for explaining real-world situations.
The dataset consists of 26 files; each contains the sensor events of the corresponding pair of volunteers performing each of the 15 activities. In all, the dataset contains 17 232 events described by (Date, Time, SensorID, Value, ResidentID, TaskID). If an event is trigged by the two residents, it is then represented by (Date, Time, SensorID, Value, ResidentID, TaskID, ResidentID, TaskID).
Activities were manually annotated by recording their start and end time. Although, the smart home includes a variety of sensor types (i.e., motion sensors, item sensors, burner sensor, water sensors, light controllers, phone sensor), only 27 motion sensors, 2 item sensors and 8 door sensors were used to collect this dataset. All these sensors produce binary values: ON/OFF for motion sensors, PRESENT/ABSENT for item sensors, OPEN/CLOSE for the cabinet sensor. The motion sensors provide the real-time location of the residents. In their absence, the location of the person corresponds to the location of the last object used.
Because this dataset stemmed from a laboratory experiment on a voluntary basis, the recording of the activities is not continuous in time and is spread over two months. However, it is a very good benchmark for the community and was used in most of the studies in the context of multi-resident HAR(Chen and Tong, 2014)(Chiang et al., 2010)(Cook et al., 2010)(Hsu et al., 2010)(Singla et al., 2010). Additional details on the dataset are given in (Singla et al., 2010).
Finally note that the activities 3, 7, 11 and 13 are cooperative, while the 11 remaining ones are parallel ones.
4.1.Pre-processing
In order to compare the performance of our multi-resident models against other models like CHMM, we followed the same data pre-processing procedure applied in (Chiang et al., 2010). The pre-processing approach aims to represent at each time step the sensor event, its corresponding value as well as the given activity label for each resident (i.e., Date, Time, Resident 1 <SensorID, Value, Activity label>, Resident2 <SensorID, Value, Activity label>). Then, we generate the sequence of activities performed by each resident by simply separating the events according to the Resident ID.
The data contains 16 activities for each resident, 15 known activities and one void (Null) activity that represents unknown activities. In all, there are 37 different binary sensors in the dataset resulting in 75 observation values for each resident including the null value.
Moreover, in order to accurately learn the activity model parameters, we need to produce sequences from the raw data. The design of the training sequences does not affect much observations and transitions estimation, in contrast to initial state estimations. The initial states do get a better estimate when accurate activity data segmentation is applied. The design of sequences strongly depends on the type of activities monitored in the environment. Generally, studies consider each day of registration as a sequence when activity data reflects the natural human behavior of residents as in (van Kasteren et al., 2008). But in the case of CASAS "Multi-resident ADLs", many days represent activity data of a single pair of volunteers, while others represent activity data of two pairs of volunteers. Segmenting activity data on a daily basis would result in a lot less samples for initial and transition estimates. Therefore, each file serves to build one sequence. We run leave-one-out cross-validation on our 26 sequences of activity data.
4.2.Comparison against Parallel HMM (PHMM) and Coupled HMM (CHMM)
To further illustrate the performance of our two HMM-based approaches, LHMM and CL-HMM, we will consider comparing them against PHMM and CHMM. The models PHMM and CHMM rely on the assumptions we made about the CL-HMM and the LHMM.
PHMM is obtained by modeling each resident as a separate HMM (See Fig. 2) that is {A1, O1}and {A2, O2} for Resident 1 and Resident 2 respectively. The parameters of a PHMM are defined below:
)
(
)
(
i
P
a
1i
R R
, (18))
(
a
j
a
1i
P
Q
tR R t R ij
, (19))
(
)
(
i
P
o
a
i
B
tR
tR tR
, (20)Fig. 2: Topology of PHMM (blank squares indicate the hidden states, shaded squares indicate the observed states)
CHMM, on the other hand, is a combination of HMMs that interact with each other (see Fig. 3). In each HMM, there is a directed edge from each hidden state at time t to the hidden state at time t+1. In addition, there are direct edges from each hidden state at time t of an HMM to all hidden states of the other HMMs at time t+1 to indicate the interaction between the residents when performing cooperative activities. The only difference between the parameters of a PHMM and the ones of a CHMM lies in the transition matrices corresponding to Resident 1 chain and Resident 2 chain as shown below:
)
,
(
21 1 1 ,P
a
i
a
j
a
k
Q
t t R t R k j i
, (21) where R={1,2}, R is the resident index, i=1...N in case R=1 (i.e., N is the number of activities performed byResident1 while i=1...M in case R=2 (i.e., M is the number of activities performed by Resident 2). Qi|j,k1 is an
N×M by N matrix and Qi|j,k2 is N×M by M matrix.
a
1(1)o
1(1)a
2(1)o
2(1)a
T-1(1)a
T(1)o
T(1)...
a
1(2)a
2(2)...
a
T-1(2)a
T(2)o
1(2)o
2(2)o
T-1(2)o
T(2)o
T-1(1)Fig.3: Topology of CHMM
PHMM and CHMM parameters are obtained by frequency counting of occurrences of initial states, transitions and observations for each resident chain, resulting then into an initial state vector, a transition matrix and an observation matrix for each resident's chain. For CHMM, the process doesn't differ for computing the initial state vector and the observation matrix of each resident chain. However, in addition to estimating inner-chain transition probabilities P(at(1)|at-1(1)) and P(at(2)|at-1(2)) in transition matrices of the
individual chains, CHMM requires to estimate the inter-chain transition probabilities P(at(1)|at-1(2)) and P(at(2)|a t-1(1)) which represent the incoming transitions from Resident 2 chain to Resident 1 chain and incoming
transitions from Resident 1 chain to Resident 2 chain respectively. These are used to estimate the likelihoods P(at(1)|at-1(1), at-1(2)) and P(at(2)|at-1(1), at-1(2)) for Resident 1 chain and Resident 2 chain respectively. For instance,
Q 3|1,41 represents the number of outgoing transitions from the pair of activities (1,4) and arriving in activity 3
in Resident1 chain divided by the total number of outgoing transitions from the pair of activities (1,4) to Resident1's chain.
In PHMM, the inference for one chain is independent of the other chain. Specifically, given an observation sequence O1 and the already learned parameters of the HMM corresponding to Resident1 that is (π1(i), Qij1,
Bt1(i)), we need to find a state sequence A1 which maximizes P(A1|O1). Thus, the conventional Viterbi
algorithm for HMMs (Rabiner, 1989) is applied on the observation sequence O1 in order to compute the most probable state sequence A1. Similarly, for inference on Resident 2 chain, the Viterbi algorithm is applied on O2 to compute the most probable state sequence A2. The computational complexity of the algorithm is then O(TN2+TM2), where T is the total number of sensor events in the dataset (i.e., length of the entire dataset). Considering R residents, each having a number of corresponding activities Ni, i=1...R, the computational
complexity would be O(∑i=1RT Ni2).
In contrast, inference in CHMM is not independent from Resident 1 chain to Resident 2 chain. The inputs of the Viterbi algorithm (Nefian et al., 2002) consist of observations of both residents O={O1, O2} and the
a
1(1)o
1(1)a
2(1)o
2(1)...
a
1(2)a
2(2)...
o
1(2)o
2(2)a
1(1)o
1(1)a
2(1)o
2(1)a
1(2)a
2(2)o
1(2)o
2(2)algorithm outputs the best state sequence A={A1, A2} which maximizes P(A|O). Details of the Viterbi algorithm are given in (Nefian et al., 2002) and its computational complexity is about O(TN2M2), where T is the total number of sensor events in the dataset (i.e., length of the entire dataset). Considering R residents, each having a number of corresponding activities Ni, i=1...R, the computational complexity would be
O(T∏i=1RNi2).
4.3.Experiment1: Results by individual residents 4.3.1.Description
In this experiment results are computed for each resident separately without any interference. That is the misclassification of the activity by Resident 1 doesn't impact the correct classification of Resident 2 and vice versa. In PHMM, CHMM a pair of labels is inferred representing Resident 1 activity label and Resident 2 activity label while in CL-HMM and LHMM a combined activity label is inferred. We convert the inferred combined activity label for the two latter models into the corresponding inferred Resident 1 activity label and inferred Resident 2 activity label. As the activities come with their true labels, each inferred resident activity label is compared to its corresponding true label. We therefore compile for each resident a confusion matrix and compute the overall accuracy, precision, recall and F-measure which are given as follows:
N tp C i i
1 curacy Overall_Ac (22) ) ( 1 Precision 1
C i i i i tp fp tp C (23) ) ( 1 Recall 1 i C i i i tp fn tp C
(24) Recall Precision Recall * Precision * 2 measure -F (25) where N is the total number of events, C is the number activities, tpi is the number of true positive, fni is thenumber of false negative, fpi is the number of false positive for activity i.
The overall accuracy is defined as the percentage of correctly classified events. We compute the precision, recall and f-measure according to the definition given in (van Kasteren et al., 2010). That is, we compute the precision and recall for each class (i.e., activity) separately and take the average over all classes. Precision is defined as the percentage of inferred activity labels which was correctly classified. Recall is defined as the percentage of true activity labels which was correctly classified. The f-measure is a combination of the two latter metrics. The recall is equivalent to the average accuracy (i.e., the average percentage of correctly classified events per activity). Most HAR datasets are imbalanced which means that some classes (i.e., activities) appear much more frequently than other classes. If dominant classes yield a good recognition performance, the overall accuracy would be high even if all other classes are not well recognized, but, recall will be low. Because all activities are equally important, precision, recall and f-measure seem a better choice in order to demonstrate the HAR performance on each of the different activities.
We separated the overall accuracy reported by each resident for parallel individual activities and cooperative activities as done in (Wang et al., 2009)(Wang et al., 2011)(Gu et al., 2009). For each resident,
the labels of the cooperative activities are 3, 7, 11 and 13. The remaining activities are parallel ones. A resident is supposed to perform a cooperative activity at time when its corresponding activity label is included in {3, 7, 11, 13}, even if the other resident performs an individual activity in parallel. For each resident, we extract cooperative activities accuracy which represents the overall accuracy over the activities 3, 7, 11 and 13 and parallel individual activities accuracy which represents the overall accuracy on the remaining ones {1, 2, 4, 5, 6, 8, 9, 10, 12, 14, 15, 16}. Cooperative activities accuracy for both residents is then obtained by computing the average of these one over the two residents. Likewise for parallel individual activities accuracy for both residents, after computing this latter for each resident, we give the average of them over both residents. These ones provide more insight on the ability of each model to deal with the two types of activities.
Please note that the code used in this study was implemented in MATLAB. The parameter estimation of all the models is computed by frequency counting of occurrences of initial state vector, transition of hidden states and observations. Some part of the code is obtained from (van Kasteren, 2010). We also used the Viterbi decoder of the HMM toolbox of Kevin Murphy3 for our PHMM, CL-HMM, and LHMM.
4.3.2. Results
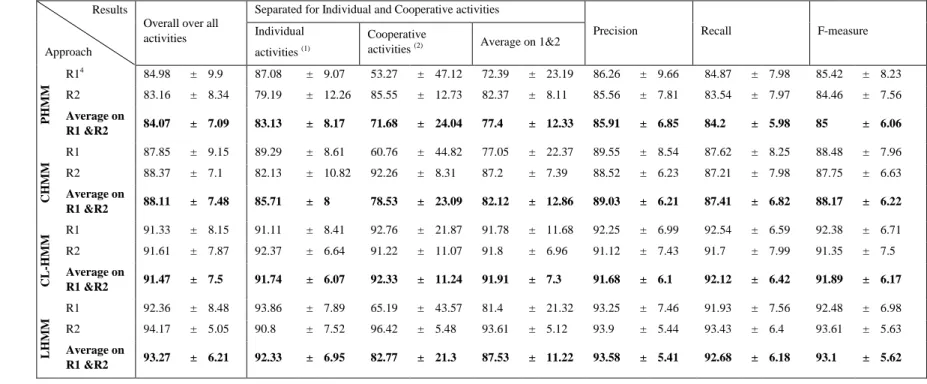
Results, shown in Table 2, are given for each of the proposed models, LHMM and CL-HMM, as well as for the state-of-the-art models used for multi-resident HAR namely PHMM and CHMM. We cycle over all the 26 training sequences using the leave-one-out cross validation and report the average performance measure for each evaluation metric.
Table 2 shows that each model produces similar results for the overall accuracy and recall which means that each model recognized all the activities with an equal performance (i.e., the recognition rate does not vary greatly from one activity to another one).In fact, using all of the metrics, it is easy to see in Tab. 2 that LHMM outperforms all of the other models, while CL-HMM looks more accurate than CHMM and PHMM. The least accurate recognizer is PHMM, which is expected to a large extent. In particular, in comparison with CHMM, LHMM improves the overall accuracy, precision, recall and f-measure by roughly 5%, 4.5%,5% and 5% respectively; whereas CL-HMM does by about 3%, 3%, 5% and 4% respectively. Moreover, when looking at the accuracies separated for parallel individual resident activities and cooperative activities, it is clear that CHMM improves the recognition of parallel individual activities by 2.5% in comparison to PHMM. On the other hand, compared to CHMM, LHMM and CL-HMM improve the accuracy by approximately 7% and 6% respectively.
For cooperative activities, the experiments show that CHMM outperforms PHMM with a difference of 7%, while LHMM improves the recognition of cooperative activities by approximately 4% in comparison with the CHMM. However, CL-HMM seems to be the best with an improvement of 20.65%, 14% and 9.5% in comparison to PHMM, CHMM and LHMM. Moreover, for cooperative activities the breakdown by resident shows that the performance difference is about 30% from Resident 2 to Resident 1 for PHMM, CHMM and LHMM. CL-HMM performs similarly for both residents (92.76% for Resident 1 and 91.22% for Resident2).
Neurocomputing 00 (2015) 1–23
Table 2. Results breakdown by resident
4
R1 indicates Resident 1 and R2 indicates Resident 2 Results
Approach
Overall over all activities
Separated for Individual and Cooperative activities
Precision Recall F-measure
Individual activities (1)
Cooperative
activities (2) Average on 1&2
PHM M R14 84.98 ± 9.9 87.08 ± 9.07 53.27 ± 47.12 72.39 ± 23.19 86.26 ± 9.66 84.87 ± 7.98 85.42 ± 8.23 R2 83.16 ± 8.34 79.19 ± 12.26 85.55 ± 12.73 82.37 ± 8.11 85.56 ± 7.81 83.54 ± 7.97 84.46 ± 7.56 Average on R1 &R2 84.07 ± 7.09 83.13 ± 8.17 71.68 ± 24.04 77.4 ± 12.33 85.91 ± 6.85 84.2 ± 5.98 85 ± 6.06 C HM M R1 87.85 ± 9.15 89.29 ± 8.61 60.76 ± 44.82 77.05 ± 22.37 89.55 ± 8.54 87.62 ± 8.25 88.48 ± 7.96 R2 88.37 ± 7.1 82.13 ± 10.82 92.26 ± 8.31 87.2 ± 7.39 88.52 ± 6.23 87.21 ± 7.98 87.75 ± 6.63 Average on R1 &R2 88.11 ± 7.48 85.71 ± 8 78.53 ± 23.09 82.12 ± 12.86 89.03 ± 6.21 87.41 ± 6.82 88.17 ± 6.22 CL -HM M R1 91.33 ± 8.15 91.11 ± 8.41 92.76 ± 21.87 91.78 ± 11.68 92.25 ± 6.99 92.54 ± 6.59 92.38 ± 6.71 R2 91.61 ± 7.87 92.37 ± 6.64 91.22 ± 11.07 91.8 ± 6.96 91.12 ± 7.43 91.7 ± 7.99 91.35 ± 7.5 Average on R1 &R2 91.47 ± 7.5 91.74 ± 6.07 92.33 ± 11.24 91.91 ± 7.3 91.68 ± 6.1 92.12 ± 6.42 91.89 ± 6.17 L HM M R1 92.36 ± 8.48 93.86 ± 7.89 65.19 ± 43.57 81.4 ± 21.32 93.25 ± 7.46 91.93 ± 7.56 92.48 ± 6.98 R2 94.17 ± 5.05 90.8 ± 7.52 96.42 ± 5.48 93.61 ± 5.12 93.9 ± 5.44 93.43 ± 6.4 93.61 ± 5.63 Average on R1 &R2 93.27 ± 6.21 92.33 ± 6.95 82.77 ± 21.3 87.53 ± 11.22 93.58 ± 5.41 92.68 ± 6.18 93.1 ± 5.62
Neurocomputing 00 (2015) 1–23
4.4.Experiment 2: Joint results for both residents 4.4.1.Description
In this second experiment, we are interested to measure the recognition performance of the pair of activities by both residents. The pair of activity labels is assumed to be correctly classified when both Resident 1 activity and Resident 2 activity are correctly classified, that is when the combined activity label is correctly classified. As a result, the misclassification of individual activities of both residents impacts the overall classification outcome. In the inference step of CL-HMM and the LHMM, both models infer a combined activity label. PHMM and CHMM, on the other hand, infer individual activity labels which are then combined to form pairs of combined labels. In order to run this experiment, we first define the true label of the combined label for each pair of activities against which the inferred combined label is compared to compute the evaluation measures: overall accuracy, precision, recall and f-measure. The overall accuracy is equivalent to the joint accuracy measure computed in (Chiang et al., 2010).
We also separate the overall accuracy results for parallel individual activities and cooperative activities. Note that residents are considered to perform parallel unrelated activities if Resident 1 activity and Resident 2 activity are different (e.g., Resident1 activity label=1 and Resident 2 activity label=2). In contrast, residents perform cooperative activities when the activity labels are the same. Among all cooperative activities defined in the dataset which are 3, 7, 11, 13, only activity 13 appears for both residents at the same time in the training data. The activities 3, 7 and 11 appear with other parallel individual activities.
4.4.2.Results
Table 3 shows the results obtained by all models using leave-one-out cross validation. Clearly the outcome of accuracy, precision, recall and f-measure indicate that the proposed LHMM outperforms the rest of the models. In particular, the overall accuracy results indicate that CL-HMM performs much better than PHMM and CHMM; while results related to precision, recall and f-measure show that CL-HMM and CHMM perform similarly. Note also that although PHMM is known to report good results in the case of individual activities performed in parallel, results of overall recognition accuracy of individual activities show that PHMM is outperformed by CL-HMM, LHMM and CHMM by approximately 10.78%, 14.67% and 8.02% respectively. LHMM performs the best in the case of individual activities producing 3.89% and 6.65% better than CL-HMM and CCL-HMM respectively.
For cooperative activities, PHMM achieves a very low performance and is less accurate than CHMM with a difference of 20.5% which is consistent with our expectations. The difference in performance between
Neurocomputing 00 (2015) 1–23
Table 3.Joint Accuracy results for residents
Results
Approach
Overall accuracy
Overall accuracy separated for individual and cooperative
activities Precision Recall Fmeasure
Individual (1) Cooperative(2) Average on 1& 2
PHMM 72.8 ± 11.13 74.79 ± 10.59 40.23 ± 46.22 59.55 ± 22.63 65.95 ± 9.94 71.89 ± 11.26 68.64 ± 10
CHMM 81.65 ± 10.27 82.81 ± 10 60.72 ± 44.76 73.21 ± 22.08 73.77 ± 10.88 77.6 ± 10.74 75.5 ± 10.4
CL-HMM 86.04 ± 10.84 85.57 ± 11.23 88.03 ± 28.77 86.78 ± 17.02 72.26 ± 11.01 76.75 ± 9.38 74.32 ± 9.81
Neurocomputing 00 (2015) 1–23
LHMM and CHMM, which is 4.49%, is much smaller than that between CL-HMM and CHMM (i.e., 27.31%). This illustrates that CL-HMM is the best model for recognizing cooperative activities followed by LHMM.
4.5.Comparison against existing studies on Multi-resident ADLs dataset of CASAS
Several studies used the same dataset (Hsu et al., 2010)(Cook et al., 2010)(Singla et al., 2010)(Chen and Tong, 2014)(Chiang et al., 2010). The common metrics used by these studies are the average accuracy (i.e., recall) and the overall accuracy; hence, our decision to use these measures for evaluating the various models.
(Cook et al., 2010) developed an integrated system for data association and activity recognition based on CRF and HMM respectively. This study reported an average accuracy of 50.67% and 90% respectively. While (Singla et al., 2010) reported an average accuracy of 60.60% using HMMs. Nevertheless, these studies do not consider cooperative and parallel activities.
(Hsu et al., 2010) reported an average accuracy of 64.16% for their independent CRFs for residents. (Singla et al., 2010) reported an average accuracy of 73.15% for their independent HMMs for residents (i.e., PHMM). The average accuracy of our PHMM is higher by 11% which is may be due to data pre-processing. Note that the authors did not provide details about the pre-processing of the activity data. Moreover, three-fold cross validation was used; while in our case leave-one-out cross validation was applied. Nevertheless, these approaches only recognize parallel activities.
The only studies that considered both parallel and cooperative activities are (Chen and Tong, 2014) and (Chiang et al., 2010). The authors in (Chen and Tong, 2014) applied a combined label approach on the pair of activity using HMM and CRF. They reported an average accuracy (i.e., computed from the average accuracy of Resident 1 and average accuracy of Resident 2) of 75.77% and 75.38% respectively. Although, the performance of our CL-HMM seems to be better than theirs, we do not have the same experimental setting.
In (Chiang et al., 2010), a leave-one-out cross validation was applied producing an accuracy of 77.38%, 82.82% and 85.58% and a joint accuracy of 61.78%, 74.78% and 78.26% for their PHMM, CHMM and CHMM with the interaction feature respectively. On the contrast, our PHMM and CHMM produce an overall accuracy of 84.07% and 88.11% and overall joint accuracy (First column in table 3) of 72.8% and 81.65% respectively. However, this comparison is subjective because the authors in (Chiang et al., 2010) did not provide details about the way they computed the accuracy. Note we used the same pre-processing as theirs.
5.Conclusion
In this paper we proposed two HMM-based models, Combined-label HMM and Linked HMM to investigate the problem of multi-resident activity recognition. These two models were compared against the state-of-the-art baseline methods which are Parallel HMM and Coupled HMM. Our first experiment shows that the proposed models outperform the baseline models for both cases of parallel individual activities and cooperative activities. In particular, CL-HMM not only significantly improves the recognition accuracy of cooperative activities but also performs equivalently in recognizing the individual activities of Resident 1 and Resident 2. That is, the recognition rate of the activities does not vary from Resident 1 to Resident 2 in
contrast to the other models. This is an important aspect in a multi-resident setting as the recognition of the activities from one resident to another one is equally important.
Our second experiment shows another important aspect of multiple-resident monitoring which is about the correct inference of the activities of all residents at any time. CL-HMM performed the best in the case of cooperative activities; while LHMM performed the best in the case of parallel individual activities. This is to say that the proposed models are not only valuable for dealing with cooperative activities but also for individual parallel ones.
In the future, we will investigate real-world multi-residents activities in a more complex scenario as the data used is rather scripted and does not reflect on the real-world setting. Specifically, we plan to evaluate the proposed models on another data collections like those of ARAS (Alemdar et al., 2013).
References
Afrin Emi, I., Stankovic, J.A., 2015. SARRIMA: smart ADL recognizer and resident identifier in multi-resident accommodations, in: Proceedings of the Conference on Wireless Health WH ’15. New York, NY, USA. doi:10.1145/2811780.2811916
Alemdar, H., Ertan, H., Incel, O.D., Ersoy, C., 2013. ARAS human activity datasets in multiple homes with multiple residents, in: 2013 7th International Conference on Pervasive Computing Technologies for Healthcare (PervasiveHealth). Presented at the 2013 7th International Conference on Pervasive Computing Technologies for Healthcare (PervasiveHealth), pp. 232–235.
Amiribesheli, M., Benmansour, A., Bouchachia, A., 2015. A review of smart homes in healthcare. J. Ambient Intell. Humaniz. Comput. 1–23. doi:10.1007/s12652-015-0270-2
Benmansour, A., Bouchachia, A., Feham, M., 2015. Multioccupant Activity Recognition in Pervasive Smart Home Environments. ACM Comput Surv 48, 34:1–34:36. doi:10.1145/2835372
Brand, M., 1997. Coupled hidden Markov models for modeling interacting processes 1–28. doi:10.1.1.50.8099
Chen, R., Tong, Y., 2014. A Two-stage Method for Solving Multi-resident Activity Recognition in Smart Environments. Entropy 16, 2184–2203. doi:10.3390/e16042184
Chiang, Y., Hsu, J.Y.-J., Lu, C.-H., Fu, L.-C., Hsu, J.Y.-J., 2010. Interaction models for multiple-resident activity recognition in a smart home, in: 2010 IEEE/RSJ International Conference on Intelligent Robots and Systems (IROS). Presented at the 2010 IEEE/RSJ International Conference on Intelligent Robots and Systems (IROS), pp. 3753–3758. doi:10.1109/IROS.2010.5650340
Cook, D.J., Crandall, A., Singla, G., Thomas, B., 2010. Detection of Social Interaction in Smart Spaces. Cybern. Syst. 41, 90–104. doi:10.1080/01969720903584183
Gu, T., Wu, Z., Wang, L., Tao, X., Lu, J., 2009. Mining Emerging Patterns for recognizing activities of multiple users in pervasive computing, in: Mobile and Ubiquitous Systems: Networking Services, MobiQuitous, 2009. MobiQuitous ’09. 6th Annual International. Presented at the Mobile and Ubiquitous Systems: Networking Services, MobiQuitous, 2009. MobiQuitous ’09. 6th Annual International, pp. 1–10. doi:10.4108/ICST.MOBIQUITOUS2009.6818
Hoque, E., Stankovic, 2012. AALO: Activity recognition in smart homes using Active Learning in the presence of Overlapped activities, in: 2012 6th International Conference onPervasive Computing Technologies for Healthcare (PervasiveHealth). San Diego, CA, pp. 139 – 146. doi:10.4108/icst.pervasivehealth.2012.248600
Hsu, K.-C., Chiang, Y.-T., Lin, G.-Y., Lu, C.-H., Hsu, J.Y.-J., Fu, L.-C., 2010. Strategies for Inference Mechanism of Conditional Random Fields for Multiple-Resident Activity Recognition in a Smart Home, in: García-Pedrajas, N., Herrera, F., Fyfe, C., Benítez, J.M., Ali, M. (Eds.), Trends in Applied Intelligent Systems, Lecture Notes in Computer Science. Springer Berlin Heidelberg, pp. 417–426.
van Kasteren, T.L.M., Englebienne, G., Kröse, B.J.A., 2010. Human Activity Recognition from Wireless Sensor Network Data: Benchmark and Software, in: Chen, L., Nugent, C.D., Biswas, J., Hoey, J. (Eds.), Activity Recognition in Pervasive Intelligent Environments, Atlantis Ambient and Pervasive Intelligence. Atlantis Press, pp. 165–186.
van Kasteren, T.L.M., Noulas, A., Englebienne, G., Kröse, B., 2008. Accurate Activity Recognition in a Home Setting, in: Proceedings of the 10th International Conference on Ubiquitous Computing, UbiComp ’08. ACM, Seoul, South Korea, pp. 1–9. doi:10.1145/1409635.1409637
Liu, Y., Nie, L., Han, L., Zhang, L., Rosenblum, D.S., 2015. Action2Activity: Recognizing Complex Activities from Sensor Data, in: Proceedings of the 24th International Conference on Artificial Intelligence, IJCAI’15. AAAI Press, Buenos Aires, Argentina, pp. 1617–1623.
Meditskos, G., Kontopoulos, E., Kompatsiaris, I., 2015. ReDef: Context-aware Recognition of Interleaved Activities using OWL 2 and Defeasible Reasoning., in: Kyzirakos, K., Henson, C.A., Perry, M., Varanka, D., Grütter, R., Calbimonte, J.-P., Celino, I., Valle,