http://jtlu.org
. 3 . 1 [Spring 2010] pp. 85–112 doi: 10.5198/jtlu.v3i1.137
Evaluation of land use-transportation systems with the Analytic
Network Process
Reza Banai
University of Memphisa
Abstract: Developments in models and methods of urban systems have increasingly drawn attention to the joint effect of land use and transportation on behavioral and policy relevance, with multicriteria evaluation of and attention to the site-level analysis of spatial impacts. In this paper, we use Saaty’s Ana-lytic Network Process (ANP), a systems-oriented method, to contribute to the emerging methodological developments in land use and transportation systems evaluation, planning, and forecasting. e ANP is applied to the problem of light rail route selection with station area land use and property value among multiple criteria. e application shows how the analysis of land use and transportation as elements of an urban system with feedback is facilitated by the ANP with data parsimony in the ex ante estimation of site-speci c, spatial-economic impacts.
Keywords: Land Use, Transportation, Urban Systems, Light Rail Transit (LRT), Route Selection, Mar-ket Impact Share, Land Use and Property Value Impact, Analytic Network Process (ANP), Analytic Hierarchy Process (AHP), GIS
1 Introduction
e basic idea that land use and transportation are connected in a “two-way” relationship was initially suggested in the 1950s and 1960s during discussions of urban traffic as a function of land use (Mitchell and Rapkin 1954) and in treatment of the idea in regional science that land use is in uenced by transportation (seeHall 1996). e concept of land use and transportation as elements of an interactive, nonlinear system or network with feedback has endured. How-ever, subsequent issues have centered on the methodological concerns of how to better measure the land use/transportation interaction and determine the policy implications.
A wide variety of ex ante and ex post methods are used in planning, forecasting, and eval-uation of land use/transportation systems. e concept of land use and transportation as ele-ments of an urban system with feedback, however, reveals some limitations of commonly used
e methods include multicriteria evaluation analysis (ranking methods, objective optimization, multi-attribute utility analysis), statistical (regression), survey (interviews, contingent valuation), scenario (trend case study, growth scenario), deterministic (input/output, bene t/cost, cost-effectiveness), quasi-experimental meth-ods, simulation using GIS, and case comparisons. e case comparison, survey method, cost/bene t and multicri-teria analysis are examples of the ex ante or “predictive” evaluation of transportation alternatives and of estimation of the land development and redevelopment impact of transportation. Quasi-experimental and hedonic price models are among ex post “evaluative” methods. For a comprehensive discussion of the strength and weaknesses of methods and data requirements for LRT station area analysis of impact, seeTransit Cooperative Research Program(1998). Copyright 2010 Reza Banai.
() methods. ese limitations are evident in the evaluation of LRT route alternatives with joint consideration of land use and transportation. e evaluation methods are commonly of the linear and ex-post variety that limit application to land use/transportation systems with inter-action. ese shortcomings apply equally as well to the evaluation methods of the ex ante va-riety like multicriteria, multi-attribute, and optimization methods. Among the ex ante vava-riety, the case comparison method is economical to administer, but its ndings have limited trans-ferability. In the context of rail transit projects, variability requires attention to the conditions speci c to place and context in the empirical investigation of the impacts. (For a comprehensive review and discussion of the methods used in transit impact analysis, seeTransit Cooperative Research Program 1998andCervero and Landis 1993.)
In this paper, Saaty’s, Analytic Network Process (ANP) is applied to an archetypal problem of public transit (LRT) route selection with land use interaction. e ANP is a systems-oriented method, which is the general, nonlinear form of the Analytic Hierarchy Process (AHP)—a multi-criteria evaluation, ranking, and decision-making method developed bySaaty(1980) with vast and wide-ranging applications (for a survey of the applications, seeZahedi 1986and Saaty and Vargas 2001. e ANP surmounts the limitations of simple linear methods of plan-ning, forecasting, and evaluation in situations such as LRT route selection, where land use and transportation system elements—commonly mixed tangibles and intangibles—are known to interact but are considered cumbersome to take into account with standard statistical, anal-ysis, and optimization methods. e ANP provides contributions with: 1) a problem def-inition (land use/transportation is de ned by a network structure of interrelated elements); 2) multi-attribute qualitative and quantitative evaluation of land use and transportation; 3) high resolution, site-speci c, small area spatial analysis; and 4) prediction with limited data. In brief, ANP facilitates the evaluation of the LRT route alignment alternatives with diverse spatial, economic, political, and environmental factors that in uence land use/transportation interaction with a small number of station area neighborhoods characterizing the impact ar-eas. Furthermore, ANP provides a wide-ranging, inclusive analytic framework in which land use/transportation as elements of a system with feedback is speci ed deductively, and in which multiple evaluation criteria and their in uence are determined in a site-speci c context induc-tively. e structural framework and probability-like measure of the multiple criteria facilitate the interpretation of ndings akin to path analysis techniques of statistics, and ratio-methods like bene t/cost analysis.
Given the pedagogic purpose of the paper, a step-by-step introduction of both methods—ANP and AHP—is given comparatively. e introduction is aimed at readers who are likely familiar with AHP, since it was introduced in the early 1970s, but who are likely less familiar with its general form, ANP, that has only recently received attention through applications in literature. e ANP is introduced with two simpli ed examples before the case application to an LRT route alternative selection problem. It was found that ANP methodological contributions are aligned with developments in urban systems analytical methods, and these are brie y reviewed. e paper begins with a brief description of the background and rationale for a case application of ANP in LRT route selection.
Evaluation of land use-transportation systems with the Analytic Network Process
2 Land use-transportation: An urban system with feedback
2.1 Problem context
Two route alignment alternatives, proposed for light rail transit currently under consideration in the city of Memphis, Tennessee, in the United States, provide context for a case application ( gure 1).
2 0 2 Miles
N
1/4 Mile buffer around LRT stations
#
Alternative 1 Madison corridor Alternative 2 Lamar corridor Block groups
Figure 1:Block groups containing or adjoining quarter-mile LRT station areas along two route alignment alternatives.
e route alternatives were assessed in a recent study that used AHP with multiple land use and transportation criteria to determine the best corridor and route alignment (Banai 2006; Memphis Area Transit Authority 1997). at study considered the public transit planning process in Memphis, which identi ed corridors and determined alignment alternatives within the best corridor (Memphis Area Transit Authority 2001). e Federal Transit Administra-tion New Starts planning process determined the multiple land use and public transit criteria; the AHP model re ected public transportation decision-making in deference to federal New Starts guidelines as well as local priorities and preferences. e alternative corridors and routes
() were assessed quantitatively in deference to the multiple criteria in a uni ed framework. e goal, participant groups, criteria, sub-criteria, and alternatives constituted various elements of a uni ed framework of public transportation decision-making process with relative in uence on the outcome (seeBanai 2006).
A logical extension of that study is to determine the land use impacts of the two highest rated LRT route alignment alternatives of neighborhoods within a quarter-mile of the station area. e extension is possible analytically from the linear method of AHP to the nonlinear method of ANP. e ndings should indicate whether or not the best alternative will fare equally as well with land use impacts. Since literature generally indicates that land use and transportation have a reciprocal relationship, the ANP method, with a facility to evaluate sys-tems with feedback, is used in this paper.
Given the pedagogic objective of this paper and the focus on method, we have brie y re-viewed the place of ANP in the development of urban systems analytical methods and its appli-cations to land use/transportation. It was found that ANP methodological contributions are in alignment with the developments in urban systems analytical methods (Subsection 2.2).
2.2 Background on method: Urban systems analysis and ANP
Developments in the analytical models and methods of urban systems increasingly draw at-tention to the joint effect of land use and transportation on behavioral and policy relevance. Models of the land use/transportation system are developed through case applications and with policy expectations. One example of this genre is LUTRAQ, a model developed to assess the re-lationships between urban land use, transportation, and air quality. AsCalthorpe and Fulton (2001) and others have observed, transportation models developed and applied to the char-acteristically highway-dependent suburban growth pattern have lacked adequate multi-modal consideration. Transportation planning and forecasting methods particularly lack transit, bike, and walk trips, as well as responsiveness to land use. Emerging metropolitan planning and eval-uation methods such as LUTRAQ ll a void in the standard modeling technology used to describe the land use/transportation interaction, and respond to public policy that promotes their joint consideration. Prominent examples of public policy that call for attention to the in-terrelationship of land use and transportation are two federal legislations in the United States: the Intermodal Surface Transportation Efficiency Act (ISTEA) and the Transportation Equity Act for the Twenty-First Century (TEA 21). Public policy thus provides a new direction in the assessment of transportation alternatives, such as transit route alignment alternatives—if ap-proached jointly, with land use among the multiple functional, economic, and environmental factors.
e joint consideration of land use and transportation has logically progressed to the use of multicriteria evaluation methods and an attention to site-level analysis of spatial impacts. Mea-surement of the tradeoffs among the criteria is revealed in multi-objective (rather than single objective) optimization (for examples, seeAzis 1990;Piantanakulchai 2005;Rogers and Bruen 2000;Shanget al.2004). is has lead to the popularity of the decision-support systems that play an increasing role in the recent development of urban systems analytical methods used in conjunction with a geographical information system (GIS). e land use/transportation decision-support system is aided by a desktop computer (with either loose coupling or seam-less integration) with GIS (Batty 1992;Harris and Batty 1993). e use of GIS has liberated
Evaluation of land use-transportation systems with the Analytic Network Process urban systems models from the “tyranny” of zones (Wegener 1998) and facilitated site-level spatial analysis (Landis and Zhang 1998). e AHP—the precursor to ANP—is among these very applications (for examples, seeBanai 1993;Jiang and Eastman 2000;Li and Yeh 2000; Malczewski 1999;Wu 1998;Wu and Webster 1998; see alsoZahedi 1986for a survey of the applications; see alsoSaaty and Vargas 2001). e AHP models of the urban system are aligned with the developmental trajectory of models that have generally involved disaggregate land use/transportation relational data analysis in comparison to earlier aggregate data (Garin 1966; Lowry 1964). In addition, AHP models are structurally akin to discrete choice theory, partic-ularly of the nested logit-type variety, commonly with some speci cation of the chain or hier-archy of individual or collective choice (e.g. employment, housing, shopping, and travel mode choices). However, a recent innovation that includes land use and transportation with feed-back loops (de la Barra 2001) highlights the conceptual elegance of nonlinearity in the urban system, which is better served by ANP than by AHP.
e ability to analyze a complex, multidimensional urban system qualitatively and quanti-tatively is a contributing factor in the development of hybrid methods that combine AHP with other techniques such as statistical, optimization, cellular automata, and fuzzy evaluation (Li and Yeh 2000;Wu 1998;Wu and Webster 1998). However, ANP, as the general form of AHP, provides even greater ability to address the basic concept that land use and transportation are el-ements of a nonlinear system with feedback, compared to the multi-linear mathematics of AHP without feedback (for a basic exposition of ANP, seeSaaty 2003). In land use and transporta-tion systems planning and evaluatransporta-tion, and highway or transit route selectransporta-tion decision-making, AHP/ANP applications highlight the importance of multicriteria analysis with mixed tangi-ble and intangitangi-ble factors and with limited data (Dantaset al.2001;Jankowski and Richard 1994;Khasnabis and Chaudhury 1994;Yoon and Hwang 1995). Multiple functional, spa-tial, economic, and ecologic criteria are used in the evaluation of an “optimum” route. e strength of AHP/ANP, compared to commonly used methods in land use and transportation systems, includes a structural exibility to account for multiple stakeholders with varying goals and preferences in public transportation systems planning (Levineet al.1999). Compared to bene t/cost analysis methods, a diverse set of factors, both tangible and intangible, with vary-ing short- and long-term time frames, is considered in an analytical framework that includes opportunity and risk as well as bene t and cost (Saaty 2003;Shanget al.2004;Tabucanon and Lee 1995). However, the lack of interrelationship among land use and transportations systems criteria and the absences of alternatives in AHP applications is a common limitation noted in the literature, and is an impetus for the ANP approach (Piantanakulchai 2005). Transportation systems evaluation factors are commonly structured by separate ANP “control hierarchies” of bene t, cost, opportunity, and risk, and are synthesized to determine the composite priority of alternatives (Saaty 2003). e optimum solution is identi ed by the highest-scoring alter-native. In common applications of ANP, the land use impacts of transportations systems are rarely modeled explicitly in the determination of the best alternative.
e ANP model of the land use/transportation interaction in case application is aligned with urban systems analytical methods that required transportation alternatives be sensitive to land use and site-speci c attributes. For example, the urban physical form quality of the area that surrounds the transit station, as well as pedestrian-friendly access to the station from lo-cations with a ne mix of land use and without arterial separation, are factors considered in addition to the commonly used quantitative indicators of physical form (e.g. density) in the
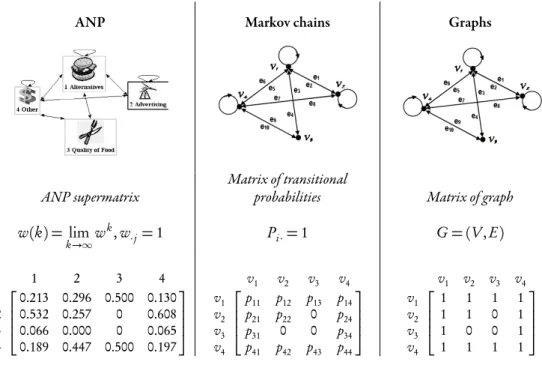
() measurement of the transit use/land use interaction. However, ANP surmounts a limitation of observational studies like the commonly used hedonic models by determining ex ante the land use and property impacts of transit (seeAl-Mosaindet al.1993). Furthermore, statistical and random utility theory-based methods that draw upon a large sample are of limited use in a trans-portation route selection problem with a small number of parcels or zones; this is the case in the LRT impact study in this paper ( gure 1 on page 87). Efficient sampling techniques require taking a subset of the population rather than counting the entire population. Alternatives to the sampling methods, however, are needed to overcome the limitation of statistical sampling methods in situations where the sample is the entire population, which is the case in our study of two LRT routes and a limited number of station areas (seeBennett 1985). In this paper, the case application example shows how ANP facilitates an analysis of land use and transportation as elements of an urban system with feedback with data parsimony in the ex ante estimation of site-speci c, spatial-economic impacts. A brief introduction to ANP is given comparatively with AHP following. Additionally, a brief comparison of ANP in relation to the commonly used methods of Markov chains and graph theory is provided in the appendix.
A step-by-step introduction of ANP and AHP methods is given comparatively. e in-troduction contains two simpli ed examples: a bridge selection with safety and aesthetics as criteria, and an LRT route selection with density and land use mix as criteria. e simpli ed examples highlight how ANP makes intuitive sense in multicriteria evaluation of systems with feedback.
3 The Analytic Network Process
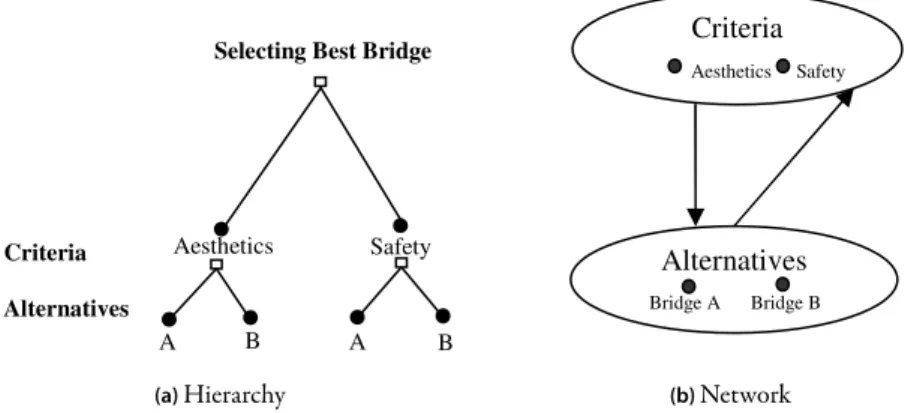
A bridge evaluation example: Consider a simple example of selecting the best bridge (Saaty 2003). Problem data: two selection criteria, safety and aesthetics, are used with safety being strongly preferred to aesthetics. Attributes of alternatives: Bridge A is safe and beautiful; Bridge B is safer but ugly. Which bridge is ideal, given both the extreme importance of safety relative to aesthetics and the features of the alternatives? Let us approach this problem with two methods: AHP and its general form, ANP. e answer depends on which method is used. As shown below, the AHP answer is Bridge B, since safety is given a high priority. However, the ANP answer is Bridge A, when nonlinearity is taken into account. Let us see which answer is closer to “common sense” (Saaty 2003).
First, let us examine the AHP approach to this simple problem. e AHP is a multicriteria evaluation/decision method that identi es and arranges the components of a complex prob-lem into a hierarchal structure with multiple levels. It determines the in uence of all of the elements measured from the top down, from the goal to the criteria to the alternatives. In our example, the goal of selecting the best bridge appears at the top of the simple hierarchy ( g-ure 2a). e two criteria (aesthetics and safety) are shown in the second level, and the two alternatives (Bridge A and Bridge B) are shown in the lowest level of the hierarchy. is is the problem-framing phase of AHP, which uses a hierarchy to structure a problem. e problem-solving, analytic phase involves paired comparisons of the factors to determine relative impor-tance. Saaty’s AHP method arranges the factors in a matrix and demonstrates that the charac-teristic vector (or eigenvector) solution is the best method of synthesizing (and thereby deter-mining the relative weights) of the judgments that arise from all the paired comparisons (Saaty 1990, more on this below). Factors at the second level (criteria) are compared relative to the
Evaluation of land use-transportation systems with the Analytic Network Process goal, and alternatives are compared relative to the criteria. In complex problems with multiple levels, the factors at each level are compared with respect to the factors at each previous level until a lowest level (that typically contains the alternatives) is reached. Finally, in the synthe-sizing step that determines the “global” weights of the elements in the hierarchy, the weights of the criteria are multiplied by the ratings of the alternatives and the results are calculated to determine the nal scores of the alternatives.
B A B
A
Selecting Best Bridge
Aesthetics Alternatives Criteria Safety (a)Hierarchy Alternatives Bridge A Bridge B Criteria Aesthetics Safety (b)Network
Figure 2: e bridge model shown in a hierarchy (a) and network (b) of criteria (“clusters”, represented by ovals) and alternatives (“nodes”, dots within clusters) with feedback.
e bridge example problem above is solved this way by AHP. e parried comparison of safety and aesthetics with respect to the goal of a safe bridge is indicated by the extreme importance of safety over aesthetics. is is noted by a value of 9 from the nine-point AHP scale explained below (table 1 on the following page). is rst comparison produces the relative weights of the aesthetics (0.1000) and safety (0.9000) criteria (table 1). More on the method of calculation is given below.
e AHP uses a 9-point scale of absolute numbers (Saaty 1987):
1. Equal importance (1)—the two activities contribute equally to the objective.
2. Moderate importance (3)—experience and judgment slightly favor one activity over an-other.
3. Essential or strong importance (5)—experience and judgment strongly favor one activity over another.
4. Demonstrated importance (7)—an activity is strongly favored and its dominance is demon-strated in practice.
5. Extreme importance (9)—the evidence favoring one activity over another is of the high-est possible order of affirmation.
6. Intermediate values between two adjacent judgments (2, 4, 6, 8)—compromise is needed. 7. Reciprocals of the above numbers—if an activity i has one of the above numbers assigned to it when compared with activityj, thenjhas the reciprocal value when compared with
() i. Note that even ner numbers are used to compare elements that are close together. For example, alternatives with nearly equal importance could have values of1.1, 1.2, . . . , 1.9.
Table 1:Paired comparison of the criteria (aesthetics and safety) with respect to the goal (safe bridge) as well as the alternatives (bridges) with respect to the criteria.
Goal: Safe bridge Aesthetics Safety Weight (wi)
Aesthetics 1 1/9 0.1000
Safety 9 1 0.9000
Consistency index = 0.0000 ∑wi=1
Aesthetics Bridge A Bridge B Weight (wi)
Bridge A 1 7 0.8750
Bridge B 1/7 1 0.1250
Consistency index = 0.0000 ∑wi=1
Safety Bridge A Bridge B Weight (wi)
Bridge A 1 1/2 0.3333
Bridge B 2 1 0.6667
Consistency index = 0.0000 ∑wi=1
All that remains is the comparisons of the alternatives with respect to the two criteria (also shown intable 1). Recall the features of the alternatives noted above. e beautiful Bridge A is rated as far more preferable than the unattractive Bridge B (value of 7). However, the quite safe Bridge A is rated as equally to moderately more preferable than the safer Bridge B (value of 2). Finally, the relative weights of the aesthetics (0.1000) and safety (0.9000) criteria are post-multiplied by the ratings of the alternatives for the criteria. e results are calculated to determine the nal composite scores of the alternatives (table 2).
Table 2:Weighted linear summation method for determining the nal scores of the alternatives. Alternatives Aesthetics Safety Criterion Weight Alternative Priority Bridge A 0.8750 0.3333 Aesthetics: 0.1000 0.387 (38.7%) Bridge B 0.1250 0.6667 Safety: 0.9000 0.613 (61.3%)
e AHP identi es Bridge B as the better choice. Even though Bridge A is quite safe and beautiful as well, it receives a lower score relative to the safer but unattractive Bridge B. But if the two bridges are both safe, why would we not prefer the one that is also beautiful?
Now consider the same problem approached as a simple network with feedback ( gure 2b). We will examine whether this alternative, nonlinear formulation is closer to our intuition. e criteria and the alternatives are shown as four connected “nodes” of a simple network. Unlike
Evaluation of land use-transportation systems with the Analytic Network Process the linear hierarchical representation, in which the direction of causation is from the top down (i.e. from criteria to alternatives), in a network with feedback, the criteria and the alternatives are connected in both directions. e numerical example below captures the signi cance of this type of representation, which allows for comparisons of the nodes in order to determine the interactions and relative in uence of all of the nodes in a network operationally using the mathematics of the ANP. We have already compared the alternatives with respect to the criteria. All that remains is comparisons of the criteria with respect to the alternatives (table 3). Table 3:Comparisons of the criteria to determine the prevalence or dominance of the criteria in the
al-ternatives for the bridge selection problem.
Bridge A Aesthetics Safety Weight (wi)
Aesthetics 1 6 0.8571
Safety 1/6 1 0.1249
Consistency index = 0.0000 ∑wi=1
Bridge B Aesthetics Safety Weight (wi)
Aesthetics 1 1/9 0.1000
Safety 9 1 0.9000
Consistency index = 0.0000 ∑wi=1
e prevalent feature of Bridge A is its aesthetics (beauty) compared to safety. is is in-dicated by the strong to very strong importance or dominance of aesthetics (value of 6) over safety for Bridge A. For Bridge B, the predominant feature of safety is indicated by the extreme importance or dominance of safety (value of 9) compared to aesthetics. It is natural to expect that the perception of the features of the bridges will in uence selection preference criteria. To measure the in uence of the criteria on the alternatives, as well as the alternatives on the criteria, we form a “supermatrix” (table 4).
Table 4:Supermatrix showing weights of the alternatives and criteria for the bridge example in a simple network from Figure 2b.
Cluster node names Alternatives Criteria Bridge A Bridge B Aesthetics Safety
Alternatives Bridge A 0 0 0.8750 0.3333
Bridge B 0 0 0.1250 0.6667
Criteria Aesthetics 0.8571 0.1000 0 0
Safety 0.1429 0.9000 0 0
e row and column headings simply list the alternatives and criteria, and the columns contain the computed relative weights fromtable 1 on the preceding pageandtable 3. e supermatrix is the operational method of determining the impacts of weights of the alternatives on the weights of the criteria. A similar set of impacts is determined for the effect of the criteria
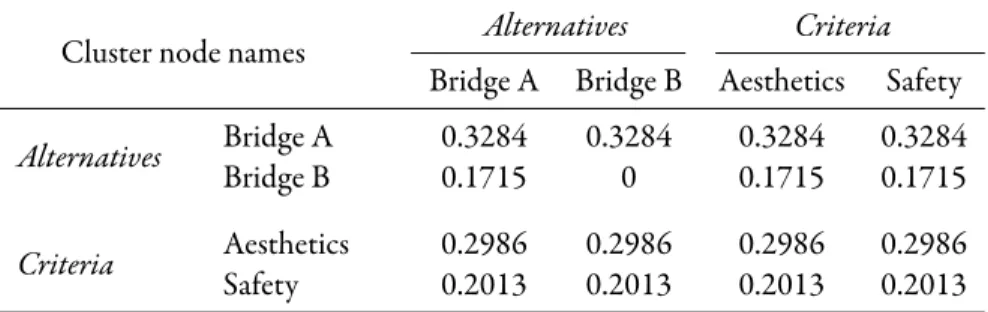
() on the alternatives by simply multiplying the supermatrix by itself repeatedly. ( e rst row is multiplied by the rst column, second row by the second column, and so on, until all of the supermatrix entries are weighted). is procedure is tantamount to raising the supermatrix to powers. e stopping point or limit for the row-by-column multiplication process is reached when all of the columns are identical (i.e. when the priorities are obtained from any column of the supermatrix; more on the mathematics of ANP below). e ANP results for the bridge example are shown intable 5, which identi es the beautiful and safe Bridge A (32.8 %) as the better alternative to the safe but unattractive Bridge B (17.2%).
is example highlights the contrasting features of AHP and ANP. e AHP allows the weights of the criteria to be adjusted for new information, and it even provides an indicator (consistency index) of when it is desirable to reassess the weights of the criteria. e ANP al-lows us to go one step further–the alternatives, like new or additional alternative-speci c pieces of information, determine the weights of the criteria. Alternatives in various contexts in uence the criteria differently according to ANP. erefore, ANP provides a context-speci c multicri-teria evaluation method that allows for the measurement of one unique alternative in the face of general criteria.
Table 5:Limit supermatrix showing weights of the alternatives and criteria for the bridge example in a simple network from Figure 2b.
Cluster node names Alternatives Criteria Bridge A Bridge B Aesthetics Safety Alternatives Bridge A 0.3284 0.3284 0.3284 0.3284
Bridge B 0.1715 0 0.1715 0.1715
Criteria Aesthetics 0.2986 0.2986 0.2986 0.2986
Safety 0.2013 0.2013 0.2013 0.2013
e relative importance of the criteria is determined independently from the alternatives in AHP
is follows from an axiom of AHP stating that the hierarchy levels are independent (for a thorough discussion of the axioms of AHP, seeSaaty 1986). A hierarchical model structure e admission of student candidates to schools (with GPA, GRE score, statement of goals, and similar criteria) or tenure or promotion evaluation of professors and staff (with teaching, research, and collegiality) provide examples of criteria considered as independent from the alternatives. In cases like these, when either the number of alternatives is large (as in an applicant pool for school admission) or the criteria are treated as xed standards, the rating mode of the AHP is used instead of the paired comparison mode. e relative importance (or weight) of the criteria is determined by the paired comparison method of the AHP and may be used as a formulaic standard. e alternatives (candidates) are rated individually against the criteria. e rating score is weighted by the relative importance of the criteria, and the total score of each alternative is determined.Table 2 on page 92shows in detail the AHP calculations for the bridge example corresponding to the hierarchy model in Figure 2a. e discussion of contrasting features of the AHP and ANP with additional examples (e.g. land suitability or LRT route evaluation) indicates the desirability of the nonlinear ANP over the linear AHP. is is particularly true in situations where criteria are not independent of the alternatives. e general form of AHP—ANP—provides a better technique in situations where the criteria are not ubiquitously held as standards; in these cases, the global criteria are determined jointly with the local, context-or site-speci c alternatives. Fcontext-or a conceptual discussion distinguishing the terms idiographic (case-speci c) and nomothetic (law-like) in spatial analysis, seeBennett and ornes(1988) andBrown(1988,1991).
Evaluation of land use-transportation systems with the Analytic Network Process makes intuitive sense, because by de nition one begins with the “abstract” goal (top) and ends with the “concrete” alternatives (bottom) in a hierarchy. However, in situations where the goal or criteria are dependent upon the alternatives, a network model structure, with feedback from the alternatives to the goal and criteria, is desirable ( gure 2b). An example of this situation is a land suitability analysis, where a land unit (as an alternative) determines site-speci c suitabil-ity criteria (i.e. where the overall suitabilsuitabil-ity criteria are partly determined by land unit spatial characteristics) (see alsoMalczewski 1999). In the nonlinear ANP, the relative weights of the criteria affect alternatives; these alternatives in turn affect the criteria. In the linear AHP, the relative weights of criteria determine the score of the alternatives independent of the in uence of the alternatives.
Consider an example closer to the case analysis in this paper. e density and land use mix are among the criteria considered in choosing between two possible LRT routes A and B, with density generally regarded as more important than land use mix. Suppose both routes meet the density threshold criterion for an LRT, and that route A serves residential and commercial areas with a better land use mix than areas served by route B. Land use mix, which is consid-ered a desirable site area feature for the LRT route, is more prevalent in route A than route B. If both routes meet the critical density requirement, it is logical to expect that the better choice is the one that also provides a desirable land use mix. Intuitive calculations of this sort are facilitated by ANP. is example also indicates how the site-speci c information is used in an ANP application–the site-speci city does not arise merely from local data used to verify universal phenomena, as is the case in a deductive methodological approach. Economic and spatial factors, generally identi ed in literature as interrelating impacts of land use and urban transportation , are used in this case study to de ne or frame the universal elements of a land use/transportation network. is problem-framing or problem-structuring phase characterizes the case study approach as a deductive process. However, the feedback aspect of this network formulation allows for the site-speci c assessment (rating) of factors in such a way that it cap-tures the impact of the particular site-speci c or local characteristics on the universal elements. is problem-solving phase characterizes the ANP approach as an inductive process, much like the example above, where a particular bridge in uences the weights of the general criteria, and the nal weights or priorities are obtained from the interrelationship of the general and par-ticular system elements. e ANP used in the case analysis below facilitates a simultaneously deductive and inductive systems approach.
A square matrix is the basic AHP procedure for comparing factors and determining their relative importance. In general, matrixA= (ai j)is positiveai j >0and reciprocalaj i=1/ai j. All of its diagonal elements are set to oneai i=1. e coefficients of this matrix are determined by comparing pairwise the weight of the criterion or elementCi with weight of criterion or elementCj, thus forming a matrix of ratiosai j=wi/wjfor all of the criteriaC1, . . . ,Cn.
e judgments of the paired comparisons can be synthesized in various ways, such as the normalized row-average method. For numerical examples, see the paired comparisons that de-termine the criteria weights in the bridge example (table 1 on page 92). e normalization of row averages provides an approximation to the characteristic value (or eigenvalue) solution (for an explanation of the alternative methods of estimation, seeSaaty and Vargas 1982). However, the eigenvalue method provides the more precise or “robust” solution regardless of matrix size and inconsistency of judgments that vary with the order of the matrix of paired comparisons (Saaty 1996a).Rogers(1971, p. 405) noted that several problems in urban and regional
analy- () sis call for the solution of the following system of linear equations. e characteristic value (or eigenvalue) problem isAw=nw, whereAis a matrix that is post-multiplied by a column vector w, and the result is proportional tow, andnis a scalar factor. In the system of linear equations A(I−n)w=0,Ais known and we solve for the unknownswandn.Ahas unit rank, and all of its eigenvaluesλi,i =1, . . . ,nexcept one are zero (λmax̸=λi =0). e sum of all of the diagonal elements ofA= (ai i=1)(i.e. the trace ofA) is denoted by∑λi=tr(A) =n. e system above is thus restated asAw=λmaxw. e solution w is recovered from any column ofA; columns inAdiffer by a multiplicative constant. Upon normalization of the columns ofA, a unique solutionw is obtained regardless of the column used. is also ensures that ∑
wi=1,i=1, . . . ,n.
Contributing to the wide-ranging applications of the AHP are practical problems that in-volve the measurement of intangibles, and problems that include mixed qualitative and quan-titative criteria. Compared to other multicriteria methods in the literature (e.g.Nijkamp and Voogd 1983;Yoon and Hwang 1995), AHP is a viable alternative to the measurement of intan-gibles since intanintan-gibles by de nition do not have known units (Saaty 1994). However,Saaty (1996b) remarked that the paired comparison method is a natural way of assessing utility, even in problems with known scales and known variable values. For example, to a low-income trav-eler, a $20 trip by car may be much more expensive that a $10 trip by transit; to a high-income traveler, however, the cost differential may be large but not perceived as important. Similarly, the conceptual affinity with “satis cing” or bounded-rationality, instead of utility-maximizing behavior, contributes to the popularity of AHP particularly in transportation applications (e.g. Banai-Kashani 1989). is follows from the logic of a cognitive limit for the number of fac-tors n that are compared12n(n−1)in a reciprocal matrix of sizengauged with a consistency index. e limit on the size of the paired comparison matrix (n≤9±2) and the associated con-sistency index con rm the results from psychological experiments on the number of pieces of information that can be processed before one gets confused (see alsoMiller 1956;Simon 1981, 1983). Saaty(1980) showed that the value of random consistencyI¯increases when the size of the paired comparison matrix is increased (i.e. with the number of factorsnin the paired comparison matrix; more in next subsection below; see alsoSaaty 1980). However, AHP lls a void in evaluation methods: 1) with a framework for the analysis of a problem with interrelated parts (i.e. a hierarchy or network) and 2) with a measure of consistency with which the parts are assessed. e problem of consistency in the paired comparison matrices is discussed next before the structural properties of AHP are described.
3.1 The calculus of consistency
When the elements are known tangible quantities (e.g. weight, length, etc.), the matrix of ratios that contains the relative weights of the elementsAis consistent; logically, ifAiis better than or preferred to (>)Aj andAj > Ak, thenAi > Ak. ai k = wi/wk,ai j = wi/wj,aj k = wj/wk. With consistency,ai k =ai jaj kfori,j,k =1, . . .,n. With inconsistency, however, ai k̸=ai jaj k. It turns out thatλmax≥nalways (seeSaaty 1980). e closerλmaxis ton, the better the consistency of the parried comparisons. is gives rise to a measure of consistency with an indexI = (λmax−n)/(n−1). is index is compared to its average value determined in a large sample of size 500 of randomly generated reciprocal matrices of the same size asA. e comparisonR=I/I¯indicates whether the estimates of the relative weights are closer to
Evaluation of land use-transportation systems with the Analytic Network Process being logically consistent or closer to being random (Saaty 1987). An upper limit of 10 percent indicates a measure of good consistency (seeSaaty 1980).
3.2 From hierarchy to network structure
In a typical AHP, the goal and objectives are represented at the top of a hierarchy and the al-ternatives are represented at the lowest level (as in gure 2 on page 91). e priority (i.e. sum normalized to unity) of thei alternativesPi with respect to thencriteria is determined by means of the principle of hierarchic composition with a linear weighted summation method. e weights of the criteriawkare multiplied by the scores or ratings of themalternatives with respect to allkcriteriaAmk, and the results are calculated to obtain the overall priority of the alternativesP i=∑wkAmkfor allk=1, . . .,nandm=1, . . .,m.
In gure 2 on page 91, the two criteria and the two alternatives form four “nodes” of a “control” system or network. In the standard AHP, the priorities of the alternatives are derived from the weights of the criteria. However, since alternatives also in uence the criteria, and criteria in turn in uence alternatives (i.e. since the system has feedback), the nal priorities of the alternatives are obtained from both the criteria and the alternatives. In the bridge example above, the priorities are determined from all four nodes of the system.
e relative importance of the alternatives relative to the criteria is determined through paired comparisons as in the standard AHP (seetable 1 on page 92. However, the alternatives are rated relative to the criteria, and the weights of the criteria are themselves determined inde-pendently from the alternatives. In ANP, an additional step is taken to establish the impact of an indirect link (in our example, feedback from the alternatives to the criteria). In this second step, the relative importance (or weight) of the criteria is determined with respect to a spe-ci c alternative. e prevalence of the criteria in the alternatives is thus determined. In other words, the criteria are treated as dependent in the second step, instead of alternative-independent as in the rst step.
Just as in AHP, the criteria-dependent step in which we perform paired comparisons of the alternatives (e.g. Bridge A and Bridge B) with respect to the criteria results in two column vectors shown in the two columns under the alternatives cluster of the supermatrix (table 4 on page 93). For the alternative-dependent step, the hallmark of ANP is the paired comparison of the criteria with respect to the alternatives; this step produces two column vectors in the columns of the supermatrix under the criteria cluster. Note that the table entries containing ze-ros indicate the independence of the inner nodes of the clusters. Otherwise, the cluster is shown graphically with a loop, and the nonzero elements are calculated to determine the relative im-portance of the nodes. e loop indicates competition among the vendors. ( e “hamburger” model provides an example in Appendix gure A.1 on page 111; see alsoSaaty 2003). e case analysis below (Section 3, gure 3 on page 99) is framed in a similar manner to this example, which aims to determine the market impact share of two LRT route alignment alternatives that are considered mutually exclusive.
e computations are made operational in supermatrixW. e columns of this matrix contain the weights of the nodes of the clusters, and the relative importance of the clusters is determined though paired comparisons. Our goal is to makeW column stochastic (i.e. the column sum is one). Multiplication ofW by the cluster weights (which are also column stochastic) provides the intended result of a stochasticW. e nal step is to determine the
() global weights of all of the nodes in the network; this is achieved by increasing powersk of Wk =limWk,k → ∞. e overall priorities are given from any column ofWk . Here the introduction to ANP is given with a simple example and with limited mathematics (for a thor-ough mathematical exposition of ANP, including its de nition, concepts, theory, and method of priorities in systems with feedback, seeSaaty 1996b). A brief discussion of the conceptual and methodological affinity of ANP with Markov chains and graph theory is provided in the Appendix.
e scaling method in ANP with absolute priority weights—such as probability—provides exibility in the measurement of diverse but interdependent system elements of a uni ed land use/transportation system. is is in contrast to the simple categorical (0–1 designation) or interval-scaled methods of graph theory (see Appendix). Furthermore, statistical methods com-monly used to measure impact in the urban system assume independence in the face of inter-dependent of the system elements. More importantly, in the small area problem like the case described in this paper, relational spatial data at the parcel level provided a sample that con-sisted of the entire population of parcels (see alsoBennett 1985). e interdependence of data invalidates the assumption of statistical independence. Parcels are not drawn randomly as if they are statistically independent, as in the relative-frequency view of probability. However, applying probability methods to the urban system or subsystem appeared in the near-classic approaches byChapin and Weiss(1968) andHuff(1963) that described shopping center trade areas or the growth in the residential areas (see alsoChapin and Kaiser 1979). ese studies are considered precursors to the recent models of urban systems in the larger scale of the city-region, e.g. with cellular automata that is used in combination with multicriteria methods like AHP, noted above.
Statistical and probability methods are useful when historical data are available for empir-ical observation and parametrempir-ical estimation. ey are limited when there is a structural trans-formation or when past observation is no longer sufficient for the prediction of future system performance (e.g. a er the introduction of new modes or technologies). e limitations are addressed by means of a proxy in transportation; for example, a nonstop or express bus on an exclusive right-of-way provides a proxy (ex-post) for an LRT route and is thus used to estimate impacts (ex-ante). However, the ex-post/ex-ante analytical tension remains. Similarly, the de-ductive/inductive or universal/particular tensions exist in analysis due to the unique nature of the conditions speci c to a given place in the face of a universal phenomenon.
Land use and transportation epitomize a system or network with feedback and thus offer a plausible application for ANP. Diverse applications of AHP/ANP to planning, design, evalu-ation, alternative selection, and location/allocation problems provide remarkably accurate pre-dictions of political, economic, and even sports outcomes. (Niemira and Saaty 2004;Saaty and Vargas 2001; see also the collection of papers from a recent symposium on AHP/ANP,Levy and Saaty 2005). In the next section, an application of ANP to the problem of LRT alterna-tive route selection is presented. e ANP determines which of the two LRT route alignment alternatives is better when land use and property value impacts on station area neighborhoods are among the multiple in uencing factors. e ndings should inform public discussion from the perspective of impacted quarter-mile station area neighborhoods, thereby in uencing a de-sirable public policy decision on the city’s LRT alignment choice.
Evaluation of land use-transportation systems with the Analytic Network Process
4 Determining market impact share of LRT route alternatives with ANP
Figure 3illustrates a network with land use, property value, redevelopment potential, etc., and LRT route alignment alternatives as clusters. is network with feedback among the clusters (or factors) and nodes (or sub-factors) is used to determine the “market impact share” of two route alignment alternatives. e case application is limited to only two alternatives because that is the actual number of alternatives currently under consideration in the city. Furthermore, if desired, the “no-build,” “do nothing,” TSM, or still others could be assessed and added as ad-ditional alternatives. Previous AHP studies include examples of this kind of evaluation as well (Banai 2006). is network model is conceptually analogous to the determination of market share in a consumer economy (Saaty 2003and Appendix; see alsoKhasnabis and Chaudhury 1994). A notable difference is in the absence of a loop in the alternative routes cluster, since the alternatives are regarded as mutually exclusive, compared to the market share model in Ap-pendix gure A.1 on page 111in which the alternatives are treated competitively, with inter-dependence indicted with a loop. e better LRT route alternative is identi ed by the “market share impact” in a network of land use/transportation with interactions. is term is used to describe which of the two LRT route alignment alternatives has the greater share or proportion of impact, determined by the interactions of all the factors and sub-factors of the network. A GIS with parcel-level land use attribute data in the public domain (e.g. tax assessment) provides inputs for the site-speci c assessment of impacts in ANP.
Property Value P1 P2 P3 Alternative Routes A1 A2 Land-Use Features L1 L2 L3 Redevelopment Potential R1 Other O1 O2
Figure 3:Route alternatives market impact share network. Alternative Routes: Madison (A1), Lamar (A2)
Land use Features: Composition/Mix (L1), Density (L2), Activity Nodes (L3)
Property Value: Residential Single Family (P1), Residential Multi Family (P2), Commer-cial/Retail/Office (P3)
Redevelopment Potential: Vacant Land (R1)
Other: Environmental (O1), Political (O2).
Note that the alternative routes cluster has two nodes (route alternatives) with no “buckle” or loop, since as noted above the route alternatives are considered mutually exclusive ( gure 3). However, the land use and property value clusters contain nodes with interactions indicated with loops. e land use cluster, for example, contains three nodes called activity nodes, density,
() and composition/mix. e procedure for the estimation of the weights of the network clusters and nodes to determine the optimal route, i.e. the LRT route with greater “market impact share” is summarized as follows.
First, the clusters are compared in order to determine their relative in uence in a network of ve clusters ( gure 3 on the previous page). is step produces a column stochastic cluster weights matrix (column sums are one) that contains relative weights. Second, the nodes in each cluster are compared, andthe comparisons are repeated for all nodes of the related clusters of the network and in deference to the direction(s) of causation. e relative weights of the nodes are determined for all the clusters. A supermatrix contains the weights for all cluster nodes. ird, the weights of the nodes that were just determined are weighted by the cluster weights (from rst step) in a weighted supermatrix. Finally, the limit supermatrix is computed. When the clusters in a network are considered equally important, their weights are determined by the “default value” of1/n, wherenis the number of the nodes under each cluster in the so ware for ANP, SuperDecisions (Saaty 2003). However, the ve clusters in the network of gure 3 contribute to the market impact share of the LRT alternatives with varying magnitudes of in u-ence. To determine their relative in uence the clusters are compared. e clusters are identi ed from a vast literature of the interrelationship land use and urban public transportation, rang-ing from physical and economic to political and environmental impact of LRT ; however, the factors are rarely considered simultaneously in a uni ed analytical framework.
Furthermore, the clusters shown in gure 3 on the preceding pageare commonly studied in one-way analysis of impacts. For example, the two-way relation between LRT alternatives cluster and property value cluster in our network approach ( gure 3) commonly appear sepa-rately in the studies of the LRT impact on property values, and of the impact of property type (e.g., residential, commercial, office, etc.) on LRT ridership. e importance of the political and environmental factors in land use and transportation planning and evaluation is realized. However, owing to the intangible qualities, they are either assumed away or considered exoge-nously in the standard quantitative methods commonly used to determine the land use impact of transportation. In contrast, they are considered endogenously in the land use/transportation network, impacting LRT alternative routes qualitatively, which in turn impact land use features and property values quantitatively. e ANP facilitates land use/transportation system evalua-tion with both qualitative and quantitative attribute data. ere are four variables with recipro-cal relationships; only one factor (redevelopment potential) maintains a one-way relationship Parcel-level GIS facilitates determination of the station-area neighborhood activity nodes, density, composi-tion and mix as factors quantitatively. Paired comparisons can be made by forming ratios of the raw numbers and entering values directly in the matrix of paired “marginal” comparisons. However, the “likely” mode of the ANP rating scale permits assessment of factors with relative priority scale re ecting the uncertainty in the estimation of likely impacts in the absence of precedent. e likely mode is justi ed logically when ANP is used in ex ante esti-mation and prediction in the face of limited observation. Diverse applications of AHP/ANP to planning, design, evaluation, alternative selection, and location/allocation problems provide remarkably accurate predictions of polit-ical, economic, and even sports outcomes (Niemira and Saaty 2004;Saaty and Vargas 2001). See also the collection of papers from a recent symposium on AHP/ANP (Levy and Saaty 2005). Remarkably, when used in prediction in wide ranging applications, ANP/AHP results are validated when data and information are made available later (Saaty 1998). With reference to “validation exercises”Saaty(2007, p. 1) concludes that “…judgments using the An-alytic Hierarchy Process can match objective measures rather closely.” e “validation exercises” with AHP/ANP thus “build con dence that our judgments can give good results when objective measures are not available.” e case analysis in this paper con rms this observation. A cost-bene t analysis (B/C) replicated the results of the ANP model and identi ed Madison Avenue as the better alternative.
Evaluation of land use-transportation systems with the Analytic Network Process in the network. e nonlinear network approach in our simpli ed case application of ANP lls a void in the literature with a systemic analysis of land use/transportation elements with interaction quantitatively and qualitatively. However, in the process of determining the rela-tive in uence of the network elements through the ANP scale and method of paired compar-isons, we draw upon the existing literature as prior knowledge, in addition to “local” knowledge that re ects the particular or site-speci c conditions. In short, our approach is both deductive and inductive. e (network) systems approach is a synthesis of previous studies considered in a uni ed framework of the site-speci c case study. For example, in the comparison of the two clusters “land-use features” and “property value”, the following typical question is posed: Which cluster in uences the market share of the LRT alternatives more—land use features or property value? e nine-point scale of ANP explained above is used to quantify the judgment of relative in uence. Examples of speci c values and their justi cations are given in gure 4 on page 104.
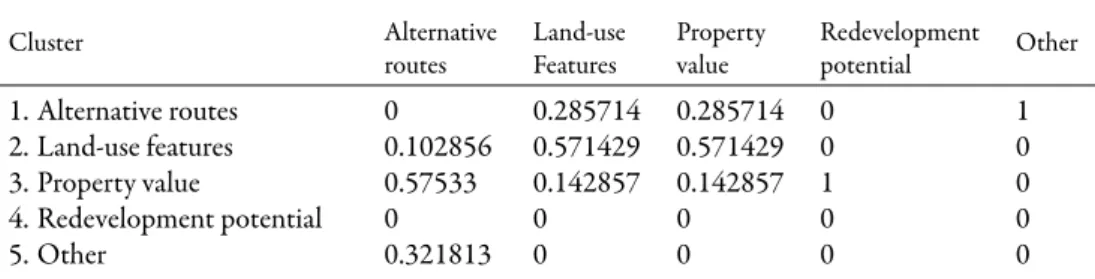
When all the interrelated clusters are compared and rated, the resulting relative importance is shown compactly in a cluster weights matrix intable 6(as intable 4 on page 93in the bridge example, displaying the weights of the alternatives and the criteria). e cluster weights matrix is column stochastic (its column sums are one). If multiplied by a supermatrix in which the weights of the cluster nodes are contained (step 2 and 3 outlined above), the resulting cluster-weighted supermatrix is also column stochastic. In the interest of brevity, the result of the mul-tiplication is shown a er it is raised to powers, concluding with the limit supermatrix in which all the columns are identical (table 7 on the following page, as intable 5in the bridge example) (for a discussion of the limitations of this rule, seeSaaty 1996b). e cluster node weights are obtained from any column of the limit supermatrix (table 7).
Table 6:LRT market share: Cluster weights matrix
Cluster Alternative routes Land-use Features Property value Redevelopment potential Other 1. Alternative routes 0 0.285714 0.285714 0 1 2. Land-use features 0.102856 0.571429 0.571429 0 0 3. Property value 0.57533 0.142857 0.142857 1 0 4. Redevelopment potential 0 0 0 0 0 5. Other 0.321813 0 0 0 0
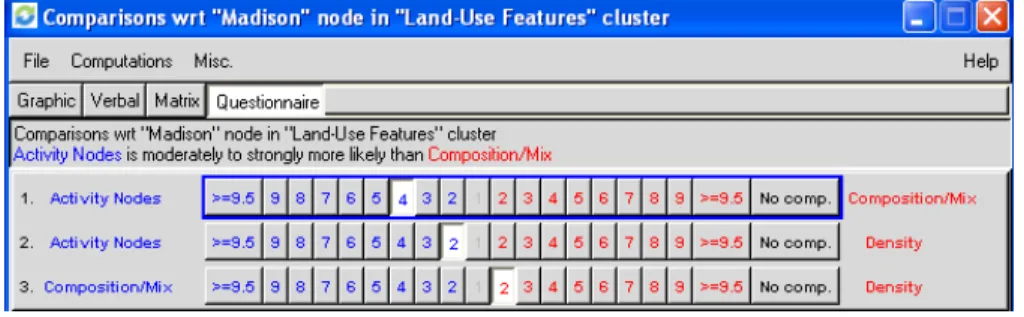
e paired comparisons of the cluster nodes (for example, land use features) in a matrix with respect to an alternative route cluster (Madison and Lamar) determine the prevalence or dominance of the land use features in the alternative routes cluster ( gure 4 on page 104). is kind of comparison is contextual, or site-speci c, and responds to a direction of causation that ows from the alternative routes to the land use cluster ( gure 3). is is similar to the bridge example above. For example, the justi cation for the ratings of Madison Avenue is stated thus ( gure 4a). e Madison line is slated to serve medical and shopping centers, here referred to as “activity nodes.” Activity nodes are dense and have good composition/mix of their land uses. e factors of activity nodes and density as well as density and composition/mix are jointly determined by a rating value of two (see footnote 3). is rating indicates that dense places in Madison are equally to near-moderately likely to be places with a good land use composi-tion/mix. However, the composition/mix are moderately to strongly likely (i.e. have a rating
() Table 7: L R T m ar ket im pact sh ar e: L im it in g su p er m at rix . C lu st er N ode N ames 1 A lt er n at iv e R ou tes 2 Land -U se Fea tu res 3 P ro p er ty V al ue 4 R ede v. P ot en tia l 5 Ot he r 1 Lam ar 2 M ad iso n 1 A ct iv . N odes 2 Co m p/ M ix 3 D en sit y 1 Co m m ./ R et ail/Off. 2 R es M F 3 R es SF 1 V ac an t Land 1 E n vi ro n 2 P ol it ic al 1 A lt er n at iv e R ou tes 1 Lam ar 0.13330 0.133296 0.133296 0.133296 0.133296 0.133296 0.133296 0.133296 0.133296 0.133296 0.133296 2 M ad iso n 0.14301 0.143007 0.143007 0.143007 0.143007 0.143007 0.143007 0.143007 0.143007 0.143007 0.143007 2 Land -U se Fea tu res 1 A ct iv .N odes 0.12641 0.126405 0.126405 0.126405 0.126405 0.126405 0.126405 0.126405 0.126405 0.126405 0.126405 2 Co m p/M ix 0.12648 0.126481 0.126481 0.126481 0.126481 0.126481 0.126481 0.126481 0.126481 0.126481 0.126481 3 D en sit y 0.15030 0.150304 0.150304 0.150304 0.150304 0.150304 0.150304 0.150304 0.150304 0.150304 0.150304 3 P ro p er ty V al ue 1 Co m m/ R et ail/Offic e 0.10408 0.104083 0.104083 0.104083 0.104083 0.104083 0.104083 0.104083 0.104083 0.104083 0.104083 2 R es M F 0.08522 0.085216 0.085216 0.085216 0.085216 0.085216 0.085216 0.085216 0.085216 0.085216 0.085216 3 R es SF 0.04229 0.042291 0.042291 0.042291 0.042291 0.042291 0.042291 0.042291 0.042291 0.042291 0.042291 4 R ede v. P ot en tia l 1 V ac an t Land 0 0 0 0 0 0 0 0 0 0 0 5 Ot he r 1 E n vi ro n 0.04140 0.041404 0.041404 0.041404 0.041404 0.041404 0.041404 0.041404 0.041404 0.041404 0.041404 2 P ol it ic al 0.04751 0.047514 0.047514 0.047514 0.047514 0.047514 0.047514 0.047514 0.047514 0.047514 0.047514
Evaluation of land use-transportation systems with the Analytic Network Process value of 4) to be determined by presence of the “activity nodes” for Madison. is is tanta-mount to an observation that activity nodes in Madison Avenue are a near-strong (scale value 4) indication of land use composition/mix. e justi cation for the ratings of Lamar Avenue can be stated with similar logic.
Conversely, for the direction of causation that ows to the alternative routes cluster, the paired comparisons of route alternatives are determined using the relative importance of the elements of the land use cluster as criteria ( gure 3). e comparison of two nodes (Lamar Avenue and Madison Avenue) in the alternative routes cluster regarding the composition/mix node of the land use cluster is shown in Figure 4b. Madison is rated as moderately more likely (value of 3) than Lamar. e justi cations for this rating draw upon the observation of the land use mix, which is only moderately more prevalent in Madison Avenue than Lamar Avenue. e nine-point scale values from equal (1) to most important (9) are shown with dialogue boxes in Figures 4a and 4b with ANP so ware (for an introduction to SuperDecisions so ware for decision making with dependence and feedback, seeSaaty 2003). e so ware incorporates the fundamental AHP scale, which allows for variable data input. Raw data values are exible, either entered directly or alternatively scaled to provide a meaningful assessment of preference, utility, probability, or likelihood in the face of nonlinearity. e exibility is helpful particularly in the comparisons of the alternative routes with intangibles and tangibles, as in assessment of the relative in uence of the political and environmental factors in the “other” cluster of the network ( gure 3). e in uence of intangibles (e.g. local political support that favors one alternative route over another)is compared to the in uence of tangibles (e.g. which alternative route has less impact on the environmentally sensitive station areas along the LRT routes) and is assessed with the facility of the scaling method.
A network with feedback thus determines the relative weights from all of the elements as clusters and nodes. When providing justi cations for the ratings, local, site-speci c conditions are considered together with knowledge of the space-economic impact of LRT from surveyed literature. We developed a questionnaire with a comment section in which the ratings with jus-ti cajus-tions could be recorded; this quesjus-tionnaire permitted desired modi cajus-tions of the rajus-tings to be made in the subsequent application of the ANP. Applied in a survey framework, the ques-tionnaire responses provide the ratings observations for further statistical analysis of consensus weights.
Property value is the largest impact (0.57533) of the alternative routes (column oftable 6 on page 101) in comparison to land use features (0.102856) and other (environmental and polit-ical) factors (0.321813). e results re ect the relative importance of property value when de-scribing the impact of LRT among the land use factors in literature (e.g.Cervero 1994;Cervero and Landis 1993). e greater weight of the other (environmental and political) factor in com-parison to the land use features is noteworthy. Findings in the literature similarly highlight the neighborhood effects of LRT that are perceived differently both politically and environmen-tally in different neighborhoods (e.g.Nelson 1999;Weinberger 2001).
Although Lamar Avenue is not far behind, Madison Avenue was found to be the better route for LRT due to its greater market impact share (table 7 on the preceding page). e rel-ative weights of the remaining cluster nodes provide additional insight. Density has a greater weight than either activity nodes or composition/mix in the land use cluster, and the results cor-roborate the relative importance of density among the land use impacts of the LRT route. With respect to property value, commercial/retail/office is of greater importance than either
residen- ()
(a)Ratings of land use features, activity nodes, composition/mix, and density with respect to alternative routes (Madison Avenue).
(b)Dialogue box for the comparison of the two alternatives with respect to the “composition/mix.” Figure 4:Comparison of alternative routes using ANP so ware.
tial multi-family or residential single family. e impact of rail transit on property value near station areas is studied in substantial literature, and these results are comparable to the ndings in the literature. ⁴ Finally, the intangible environmental and political factors in the other cluster are nearly equal in importance in this site-speci c case. Whether the greater marginal weight of the political (0.0475) versus environmental (0.0414) criteria tips the nal route selection de-cision in favor of either alternative remains to be seen, particularly since the overall impact of the factors reveals a marginal difference in the score of the two alternatives (Madison Avenue = 14.30% and Lamar Avenue = 13.33%). A cost-bene t analysis replicated the results of the ANP and chose Madison Avenue as the better route alignment alternative for LRT. is nding is not surprising in the light of the greater relative weights of land use features and property value in the ANP; these factors are also included in a cost-bene t analysis. However, ANP results are derived from a set of factors that include intangibles that defy monetization in a standard cost-bene t analysis. Furthermore, the microscopic, site-level analysis of the spatial-economic impacts performed with ANP using limited data overcomes a shortcoming of cost-bene t anal-ysis— as well as of predictive or evaluative methods commonly used in LRT station area impact assessment—which is constrained by the availability of data at the macroscopic regional level.
⁴ For example, seeArmstrong(1994);Cervero(1994);Cervero and Duncan(2002a,b);Cervero and Landis
(1993);Dean and Smith(1993);Diaz(1999);Dueker and Bianco(1999);Price Waterhouse Coopers(2001); Tran-sit Cooperative Research Program(2004);Weinberger(2001);Weinstein and Clower(1999). For a discussion of transit planning as both a technical and political process, seeWachs(1985).
Evaluation of land use-transportation systems with the Analytic Network Process
5 Conclusions
Literature identi es the wide-ranging impact of urban public transportation, from physical and economic to political and environmental. ese impacts are a mixed bag of tangibles and intan-gibles with interactions, which pose limitations for commonly used methods, whether in the predictive or evaluative, ex ante or ex post variety. Furthermore, factors are rarely considered simultaneously in a uni ed analytical framework with feedback. By accounting for the interde-pendencies among land use and transportation as elements of a uni ed system with feedback, ANP provides an alternative method for determining optimal LRT route alignment when the impact criteria contain both tangible and intangible factors with interaction.
e system elements are compared and their relative importance determined by using the fundamental nine-point scale of AHP/ANP with absolute numbers. is makes it possible to assess elements with either no underlying scale (intangibles) or with incomplete information without imposing arbitrary units in measurement. e route alignment alternatives are ex-pressed in proportions—like probability—which facilitates the interpretation of relative weight in context. e formulation of land use and transportation as elements of an interdependent system, as well as the measurement of the relative weights with the paired comparison matrix method, allow ANP to overcome a limitation of probabilistic and statistical methods used in systems evaluation. e latter methods require independence when the goal is to account for the interdependence of the system elements; this is characterized by the network model of the case study.
A questionnaire with examples of paired comparison matrices from the ANP so ware screen display facilitated the interactive and systematic assessment of the clusters and nodes. e consistency of the paired comparisons is shown together with the eigenvector matrix so-lution for further deliberation when the consistency index exceeds 10 percent (the acceptable threshold). Similar to the case comparison method noted above, ANP provides case- or site-speci c assessments of the relative systemic impacts of land use and transportation. In-depth estimates of the impacts’ orders of the magnitude provide a logical area for further analysis. Systematic comparisons using a similar ANP-aided land use and transportation system frame-work across different cities provide the variation, if any, in both the incidence and magnitude of impacts upon further calibration. e addition of clusters that contain transportation-speci c impacts (e.g. travel time and costs) provides an extension of the simpli ed network in the case study. A fertile area for further investigation includes sensitivity analysis with scenarios that depict the choice of route alignment in various site-speci c conditions. Comparison of ANP results with other commonly used methods is also a potentially insightful area of investigation. For example, a cost-bene t analysis (B/C) replicated the results of ANP and identi ed Madi-son Avenue as the better alternative. However, ANP facilitates the evaluation of land use and transportation interaction qualitatively and quantitatively. Extension of the method of cost-bene t in a uni ed evaluation framework of ANP with risk and opportunity as well as cost-bene t and cost (seeSaaty 2003) is a fruitful area for the further evaluation of the LRT alternatives.
From problem de nition in a network of interrelated elements, to multi-attribute qual-itative and quantqual-itative analysis, high-resolution site-speci c spatial assessment, and predic-tion with limited data deductively and inductively, ANP features are among those that are in-creasingly recognized as desirable in the recent development of urban systems—of which land use/transportation is the archetype subsystem—from simulation to prediction and evaluation.
() e features are likely to spur further application of ANP in land use/transportation systems forecasting and evaluations in alignment with the development of methods of urban systems. Finally, with the increasingly wide-ranging applications of ANP as the general form of AHP, hybrid methods that are likely to be integrated with ANP (i.e. similarly to the use of the AHP in the development of integrated methods for urban systems analysis) offer a promising venue for future work.
Acknowledgments
e comments of the anonymous reviewers of JTLU are gratefully acknowledged. e author would also like to thank David Levinson and Kevin Krizek for constructive comments on an earlier version of this paper.
References
Al-Mosaind, M. A., K. J. Dueker, and J. G. Strathman. 1993. Light-rail transit stations and property values: A hedonic price approach.Transportation Research Record, 1400:90–94. Alexander, C. 1965. A city is not a tree.Architectural Forum, 122(1; 2):58–61; 58–62. Armstrong, R. J., Jr. 1994. Impacts of commuter rail service as re ected in single-family
resi-dential property values.Transportation Research Record, 1466:88–98.
Azis, I. 1990. Analytic hierarchy process in the bene t-cost framework: A post-evaluation of the Trans-Sumatra highway project.European Journal of Operational Research, 48:38–48. Banai, R. 1993. Fuzziness in Geographical Information Systems: Contributions from the
Analytic Hierarchy Process. International Journal of Geographical Information Systems, 7(4):315–329.doi: 10.1080/02693799308901964.
Banai, R. 2006. Public transportation decision-making: A case analysis of the Memphis Light Rail Corridor and route selection with Analytic Hierarchy Process.Journal of Public Trans-portation, 9(2). URLhttp://www.nctr.usf.edu/jpt/jptv9n2.htm.
Banai-Kashani, R. 1989. Discrete mode-choice analysis of urban travel demand by the Analytic Hierarchy Process.Transportation, 16(1):81–96.doi: 10.1007/BF00223047.
Batty, M. 1992. Geographical information systems: GIS in urban planning and policy. In GIS in Regional Development Planning, number 51 in UNCRD Meeting report series, pp. 27–60. United Nations Centre for Regional Development, United Nations Centre for Re-gional Development.
Bennett, R. J. 1985. Quanti cation and relevance. In R. Johnston, ed., e Future of Geography, pp. 211–224. Methuen.
Bennett, R. J. and J. B. ornes. 1988. Geography in the United Kingdom 1984–1988: Report to the 26th International Geographical Congress in Sydney, Australia, in August 1988. e Geographical Journal, 154(1):23–48. URLhttp://www.jstor.org/stable/633474.
Brown, L. A. 1988. Re ections on ird World development: Ground level reality, exogenous forces, and conventional paradigms. Economic Geography, 64(3):255–278. URLhttp:// www.jstor.org/stable/144073.
Brown, L. A. 1991.Place, Migration and Development in the ird World: An Alternative View. Routledge series on geography and environment. Routledge.