INTERNATIONAL ENERGY AGENCY
AGENCE INTERNATIONALE DE L’ENERGIE
IEA I
NFORMATIONPAPERENERGY EFFICIENCY OF
AIR CONDITIONERS
IN DEVELOPING COUNTRIES
AND THE ROLE OF CDM
SATORU KOIZUMI INTERNATIONAL ENERGY AGENCY © OECD/IEA, November 2007
INTERNATIONAL ENERGY AGENCY
The International Energy Agency (IEA) is an autonomous body which was established in November 1974 within the framework of the Organisation for Economic Co-operation and Development (OECD) to implement an inter national energy programme.
It carries out a comprehensive programme of energy co-operation among twenty-six of the OECD thirty member countries. The basic aims of the IEA are:
To maintain and improve systems for coping with oil supply disruptions.
To promote rational energy policies in a global context through co-operative relations with non-member countries, industry and inter national organisations.
To operate a permanent information system on the international oil market.
To improve the world’s energy supply and demand structure by developing alternative energy sources and increasing the effi ciency of energy use.
To promote international collaboration on energy technology.
To assist in the integration of environmental and energy policies.The IEA member countries are: Australia, Austria, Belgium, Canada, Czech Republic, Denmark, Finland, France, Germany, Greece, Hungary, Ireland, Italy, Japan, Republic of Korea, Luxembourg, Netherlands, New Zealand, Norway, Portugal, Spain, Sweden, Switzerland, Turkey, United Kingdom and United States. The Slovak Republic and Poland are likely to become member countries in 2007/2008. The European Commission also participates in the work of the IEA.
ORGANISATION FOR ECONOMIC CO-OPERATION AND DEVELOPMENT
The OECD is a unique forum where the governments of thirty democracies work together to address the economic, social and environmental challenges of globalisation. The OECD is also at the forefront of efforts to understand and to help governments respond to new developments and concerns, such as corporate governance, the information economy and the challenges of an ageing population. The Organisation provides a setting where governments can compare policy experiences, seek answers to common problems, identify good practice and work to co-ordinate domestic and international policies.
The OECD member countries are: Australia, Austria, Belgium, Canada, Czech Republic, Denmark, Finland, France, Germany, Greece, Hungary, Iceland, Ireland, Italy, Japan, Republic of Korea, Luxembourg, Mexico, Netherlands, New Zealand, Norway, Poland, Portugal, Slovak Republic, Spain, Sweden, Switzerland, Turkey, United Kingdom and United States. The European Commission takes part in the work of the OECD.
© OECD/IEA, 2007
International Energy Agency (IEA), Head of Communication and Information Offi ce, 9 rue de la Fédération, 75739 Paris Cedex 15, France.
Please note that this publication is subject to specifi c restrictions that limit its use and distribution. The terms and conditions are available online at http://www.iea.org/Textbase/about/copyright.asp
Abstract
This paper seeks to identify the technical potential for energy efficiency improvement of air conditioning in developing countries brought about by the penetration of energy efficient
appliances. The potential reduction of electricity consumption and CO2 emission is estimated
for China (warm provinces) and Ghana, which are selected as examples of developing countries which may or may not have their own manufacturing capacity. Barriers to penetration of energy efficient appliances and measures to lower these barriers are also studied to assess the feasibility of energy efficiency of home appliances in developing countries. Since barriers and possible measures are likely to be different depending on the existence of manufacturing capacity, studies are carried out for China (warm provinces) and Ghana. In identifying the barriers and possible measures, some of the energy efficiency projects implemented under the GEF (Global Environment Facility) are selected to be studied. Based on these analyses, this paper aims to clarify the effects and feasibility of measures to be undertaken as possible CDM projects with suggestions for a smooth implementation of CDM.
The potential electricity consumption by cooling-only air conditioners would be reduced by 8% in Ghana through the proper enforcement of energy efficiency standards. In Chinese warm provinces accounting for about 30% of Chinese population, the maximum reduction of electricity consumption would amount to 38% which is equivalent to 260TWh if more
advanced technologies available in developed countries were introduced. CO2 emissions
would be reduced correspondingly. However, energy efficient air conditioners may not penetrate the markets of developing countries due to various types of barriers. Efforts to overcome barriers by transforming markets have been made under the auspices of GEF since the 1990s. It has been observed that the energy efficiency of appliances in developing countries has improved to some extent in each project. It should also be noted that the scales and effects of GEF projects have sometimes been insufficient due to the limits of funds allocated to each project by GEF. CDM could expand the coverage of GEF projects and promote the market transformation more deeply than existing GEF projects with its potentially larger funds generated through the sales of CERs (Certified Emission Reduction) on carbon markets.
1.
Introduction
Electricity consumption by the residential sector in developing countries is low compared to other sectors in developing countries, and same sectors in developed countries at present. However, it will increase drastically in the near future, since the adoption and capacity of each home appliance will rise due to the desire of people in developing countries to improve their standard of living. If China is taken as an example, the electricity consumption in the Chinese residential sector is about 10% of total electricity consumption at present which is quite low compared to the average figures in developed countries which is about 30%. As for the diffusion of home appliances, the adoption of air conditioners by urban residents had increased from 8% in 1995 to 70% in 2004 and that for refrigerators from 66% to 90% respectively. The same trends are expected to continue for coming decades.
Among home appliances, air conditioners, refrigerators and lighting fixtures are likely to be the three major electricity consuming appliances in developing countries. It is therefore most effective to concentrate on the energy efficiency improvement of these appliances in order to suppress the electricity consumption in developing countries. Though it is promising to suppress the electricity consumed by residential sectors in developing countries through energy efficiency of home appliances, it would appear that comprehensive measures to make this happen have not yet been taken. As a result, the energy efficiency of home appliances in developing countries remains low compared to that of developed countries, where efforts to improve the energy efficiency have been made since the oil crisis.
If energy efficient products were to penetrate into developing countries together with proper standard settings and labelling programs, they could contribute to the energy efficiency improvement of home appliance stock in developing countries. This paper assesses the effects of energy efficiency improvement of air conditioners in China and Ghana used for cooling by technology diffusion from developed countries and/or proper enforcement of energy efficiency
standards. It also estimates the possible reduction of CO2 emissions caused by energy
efficiency improvement, which could generate CER (certified Emission Reduction) to be sold in carbon markets. These are presented through a case study based on the comparison of energy efficiency of air conditioners in China and Japan and also expected energy efficiency improvement by CDM implementation proposed for Ghanaian air conditioners. The comparison between China and Japan is made in order to understand effects of energy efficiency improvement and potential barriers for air conditioners in developing countries with their own manufacturing capacity. The Ghana case study sheds light on the effects of energy efficiency projects implemented in developing countries without manufacturing capacity.
Under the GEF (Global Environmental Facility) several projects on appliance energy efficiency have been implemented in developing countries. These projects could hint at possible barriers and countermeasures for the energy efficiency of appliances to be implemented by CDM since methodologies taken by GEF have been partly comparable to a programmatic approach of possible CDM projects, such as labelling programs and technology transfer from developed countries.
For this case study, air conditioners used for cooling are selected since electricity consumption is expected to grow faster than other appliances such as refrigerators and lighting. In addition, the estimation of energy efficiency effects is easier since test procedures for these air conditioners are practically identical internationally.
2.
Energy Efficiency of Air Conditioners
In order to understand the situation concerning the energy efficiency of air conditioners, comparisons are made among three countries representing developed countries, developing countries with and without their own manufacturers respectively. Presently, in developed countries, energy efficiency of air conditioners has been rising due to the successful enforcement of energy efficiency standards with the endorsement of labelling programs. However, in developing countries, energy efficiency standards have not been enforced sufficiently and energy efficiency of air conditioners remains low at present. In particular, the situation in developing countries without their own manufacturers is more severe, since they have to import products which are sometimes expelled from other developing countries with their own manufacturers.
2.1
Energy efficiency of air conditioners in developing countries
2.1.1 Energy efficiency of air conditioners in countries without their own manufacturers
Ghana is taken as an example of a country without its own manufacturers. In Ghana, all air conditioners are imported from developed countries or developing countries owning their own manufacturers such as China. However, as is underlined in a Project Design Document of a proposed CDM project, “current import patterns allow manufacturers to send their least efficient models to Ghana even though these models may be barred from more developed economies because they represent extremely inefficient technology.” (Project Design Document of CDM on NM0072: Mandatory Energy-Efficiency Standards for Room Air conditioners in Ghana) Therefore, the average energy efficiency of air conditioners sold in Ghana is relatively low compared to those in more developed countries.
Minimum energy efficiency standards for air conditioners in Ghana already exist. However, labelling programs to inform retailers, wholesellers and custom officials of these standards have not yet been established due to the lack of resources such as a testing laboratory with properly trained staff and modern equipment.. As a result, the Energy Efficiency Rate (EER) of air conditioners remains low, with the prospect of only a small improvement in future. Fig.1 indicates the development of average EER sold between 2000 and 2005. It had been improved year by year but the average yearly improvement is small, remaining at 0.7% during this period.
Fig.1 Energy efficiency development of air conditioners sold in Ghana
0.0 0.5 1.0 1.5 2.0 2.5 3.0 2000 2001 2003 2004 2005 Year EER (UNFCCC 2006)
2.1.2 Energy efficiency of air conditioners in countries with their own manufacturers
China is taken as an example of countries with their own manufacturing capacity. Chinese energy efficiency initiatives started in 1989 when the former State Quality and Technical Supervision Bureau (QTSB) issued the first set of standards on the energy efficiency of appliances including air conditioners. China has developed its standards program since then, where efforts have been made to cover more product categories and raise the performance levels of each product. Responding to the requirements for the accession to the WTO, China consolidated the two overlapping institutions which were the State Administration for Entry-Exit Inspection and Quarantine (CIQ) and QTSB into the General Administration for Quality Supervision, Inspection and Quarantine (AQSIQ) as the standard setting agency. In April 2001, the AQSIQ formed the Standardisation Administration of China (SAC), the body which is currently charged with establishing and monitoring national standards in China and also the official Chinese representation to ISO and IEC. This organisation controls the China National Institute of Standardisation (CNIS) which is the main standards research institute. (Chaoyi Zhao and John M. Graham, 2006)
In 2005, China launched an energy efficiency labelling program which classifies appliances in 5 grades in order to provide more detailed information to consumers. At the same time, the minimum energy efficiency requirements (MEPS) for air conditioners were raised from 2.37 stipulated in 1990 energy efficiency standards (APEC 1999) to 2.6 in 2005 (CNIS 2005) in terms of EER, which is equivalent to an annual rise of 0.62%. For an integrated assessment of energy policy in China, please see WEO 2007
Sales weighted average EER of Chinese air conditioners can be calculated based on a composition of sales of air conditioners shown in Fig.2 and their energy efficiency requirements also shown in Fig.2. (CNIS 2005) The energy efficiency of most of air conditioners
was in the lowest of the 5 grades. Consequently, the sales weighted average EER was 2.8 in
2005, slightly above the MEPS for air conditioners.
Fig.2 Composition of sales of registered air conditioners by energy efficiency in Chinese markets
Distribution of EER in Chinese AC markets
Grade 2 5% Grade 3 4% Grade 4 17% Grade 5 71% Grade 1 3% (CNIS 2005)
As a future outlook of the MEPS development of Chinese air conditioners, it is projected to increase to 3.2 in terms of EER in 2009 from 2.6 set by the MEPS in 2005, which corresponds to 5.3 % of annual improvement. (Jiang Lin 2006)
2.2
Energy efficiency of air conditioners in developed countries
In order to see the past trend of energy efficiency improvements of air conditioners in Japan, the transition of EER distribution for Japanese reversible air conditioners with cooling capacity of 2.8kW is depicted in Fig.3. The energy efficiency of Japanese air conditioners has been
Grade Requirement 1 3.40≤EER 2 3.40>EER≥3.20 3 3.20>EER≥3.00 4 3.00>EER≥2.80 5 2.80>EER≥2.60
improved since the Top Runner Program 1started in 1999 which required the energy efficiency target to be met by 2007. Air conditioners with 2.8kW cooling capacity were chosen since they are the most popular in Japan, and also, seemingly, among the most popular air conditioners in other developing countries.
Fig.3 Evolution in Distribution of Energy Efficiency for Japanese Air Conditioners
(ECCJ 2006b)
A relationship between energy efficiency and the price of air conditioners sold from 2001 to 2005 in Japan is depicted in the graph on a biannual basis, where the horizontal axis expresses the energy efficiency achievement to the target in percentages and the vertical axis indicates the price of each product in euros. These graphs show that the energy efficiency performance of each air conditioner (indicated by diamonds) has improved in these five years. By 2005, almost all the air conditioners in the Japanese markets had met the criteria set by the Top Runner Program and some air conditioners went ahead further. The energy efficiency of these air conditioners went beyond the target spontaneously as more energy efficient products were profitable in Japan in terms of Life Cycle Costs (LCC), which has not occurred in the markets of developing countries. The price information and energy efficiency information used here were obtained through the POS (point of sales) system which covered 35 - 40% of air conditioner sales in Japan for each year (ECCJ 2006b).
Fig.4, the trend of the sales weighted average EER for Japanese air conditioners from 1997 to 2005 depicts. The EER of air conditioners has increased from 3.17 in 1997 to 5.27 in 2005, with an annual average improvement of 6.6%.
As for the projection of the future EER of Japanese air conditioners, this would increase to 6.32 with a 20% improvement by the year of 2010 (METI 2006), due to the revision of the Energy Efficient Law in Japan. This improvement corresponds to 3.7 % annual improvement between 2005 and 2010.
In order to compare energy efficiency performances quantitatively, test methods of appliances need to be equivalent. The Chinese domestic test procedure for heat pumps, GB/T7725-1966 is not equivalent to ISO 5151-94(E). However, the cooling capacity tests are conducted at the ISO 5151-94(E) T1 test conditions. The Japanese air conditioners are tested by JIS B8615-1 which is technically equivalent to the test procedure in the ISO 5151 T1. (APEC 1999) Since the test procedures and conditions for air conditioners of China and Japan with regard to energy efficiency performance are identical, these two countries can be compared directly. As for air
1
The Japanese government launched the Top Runner Program based on the amended Energy Conservation Law in 1999, under which the standards are set based on the efficiency level of the most efficient product commercially available in a given category. For each manufacturer and importer, the Top Runner Program requires that the weighted average efficiency of all units shipped within the same category meet the standards for that category by the target year decided for each category. Target products of the Top Runner Program are ones designated as machinery and equipment which are commercially used in large quantities in Japan, consume significant amounts of energy on use and satisfy energy consumption efficiency requirements. (ECCJ 2006a)
July in 2003 0 200 400 600 800 1000 1200 25 50 75 100 125 150
Energy Efficiency Index (%) July in 2001 0 200 400 600 800 1000 1200 25 50 75 100 125 150
Enrgy Efficiency Index (%)
P u rcha se P ri ces ( eur o s) July in 2005 0 200 400 600 800 1000 1200 25 50 75 100 125 150
conditioners in Ghana, EER is also used for the estimation of energy efficiency of air conditioners.
Fig. 4 Past trend of EER for Japanese air conditioners with cooling capacity of 2.8kW
0.0 1.0 2.0 3.0 4.0 5.0 6.0 1997 2000 2005 Year EE R (ECCJ 2006c)
2.3
Comparison of the situation between developed countries and developing
countries
Energy efficiency of air conditioners in developing countries is currently low compared to that in developed countries. This is caused by the past sluggish improvement of energy efficiency performance of air conditioners in developing countries. In Ghana, the annual average improvement of EER had been 0.7 % between 2000 and 2005. For Chinese air conditioners, explicit historical development of EED is not available. However it is likely that it has not been high given the development of MEPS in that country, which is only 0.62% between 1990 and 2005 on an annual basis.
In the future, expected MEPS development suggests that energy efficiency of Chinese air conditioners would rise more rapidly than in the past. However, the speed of improvement which is 5.3% on annually is comparable with that in Japan which is 3.7% on an annual basis. Therefore, it is not likely that the gap in energy efficiency between these two countries will close in the near future.
3.
Estimation on Reduction of Electricity Generation and CO
2Emission by Energy Efficiency Improvement of Air Conditioners
The reduction of electricity generation and CO2 emissions by the improving energy efficiency
of air conditioners is evaluated both for China and Ghana. For China, the evaluating of possible
electricity reduction and CO2 emissions has not yet been performed. Therefore, this evaluation
uses a model based on actual data of Chinese air conditioners. For Ghana, the evaluation
performed in the Project Design Document (PDD) Form of CDM project for energy efficiency
improvement of air conditioners in Ghana can be used in this study.
3.1
Estimation of reduction of electricity generation and CO
2emissions in
Ghana
3.1.1 Outline of CDM project in Ghana
For the energy efficiency improvement of Ghanaian air conditioners, a new methodology of CDM using a programmatic approach was proposed to the UNFCCC. This methodology had been assessed by the Methodology Panel but was disapproved of on the grounds of the weakness of available reliable data and/or scientific surveys, which make the baseline and the monitoring methodology rely on statistical sampling rather than the performance of every appliance in the market. It also pointed out that little precedence with approved methodologies and necessary long term activity involving plural actors are a potential weakness of the project. (UNFCCC
2007) Even though the project was disapproved, the outlook of CO2 reduction by energy
efficiency of air conditioners and proposed possible measures are still useful in studying the effects of energy efficiency of air conditioners and possible measures to be taken in countries without their own manufacturers.
The project was supposed to cover all room air conditioners used in Ghana. The boundary for this project was expected to be all consumers connected to the grid in Ghana, which covers most of the territory. In Ghana, the most expensive and presumably least efficient electricity
based on operational costs comes from fossil-fuel based generators that emit CO2. By
implementing a room air conditioner standard, suppliers in Ghana would be forced to take the most inefficient units off the market and consumers would be forced to purchase on average more efficient models than they would do otherwise.
Developing a national level appliance standard has traditionally required a tremendous investment of time and resources. Project developers would need to work jointly with key government, industry and NGO groups to move projects forward. Ghana has been trying for a long time to try to implement appliance standards and is one of the most advanced African countries in its efforts. No other African country except South Africa has made comparable efforts to implement an appliance standard. In spite of the effort towards appliance standards in Ghana, program costs, financial investment, political will and other key barriers remain that CDM would be directly responsible for overcoming. For example, no mandatory standard could come into effect without the creation of a local appliance testing lab facility, with sensitive and expensive equipment available only in developed countries. The lab needs both start up and annual operational budgets, funding that the government currently lacks. The CDM revenue would be used to directly overcome this currently insurmountable barrier. (UNFCCC 2006, Project Design Document of CDM)
Ghana has a very hot and humid climate. In the capital city of Accra, for example, the high temperature averages above 30 °C, and humidity levels reach 80% June through September. Air conditioners are a common consumer purchase as in any country with a similar climate and a growing consumer class. In Ghana, more than 100,000 room air conditioners are currently
sold each year with the number expected to grow by about 8% each year. (UNFCCC 2006) The program proposed does not have any significant impact on air conditioner stock, but rather it aims at reducing the negative impacts from air conditioners newly sold by ensuring that they meet a minimum efficiency performance (EER=2.8) and that consumers have the life-cycle cost information needed to select air conditioner with even higher levels of efficiency.
Fig. 5 Map of Ghana
The boundaries and names shown and the designations used on maps included in this publication do not imply official endorsement or acceptance by the IEA.
(UNFCCC 2006)
3.1.2 Estimates of reduction in electricity generation and CO2 emission
The duration of the project is set to be seven years in the PDD, starting from 2005. Distribution loss is not considered in the estimation. Therefore, total electricity generation caused by air conditioners are equivalent to electricity consumption by air conditioners. Total electricity generated air conditioners between 2005 and 2011 is the sum of annual electricity consumption in each year. The annual electricity consumption in year N, AEC(N) is the sum of electricity consumption caused by air conditioners entering stock between 2005 and year N as shown below.
AEC(N) = EAS(N)
×
K +∑
=−12005
N
Y EAS(Y)
In this equation, EAS(Y) represents electricity consumption caused by air conditioners entering stock in year Y. Notably, the electricity consumption by air conditioners in year N is multiplied
by the coefficient of K in order to reflect the average yearly operation hours of equipment
bought in that year. This figure is set to be 50% in this case based on the assumption that air conditioners are introduced unrelated to the time of year in tropical Ghana.
EAS(Y) is calculated by the following equation. EAS(N) =
)
(
)
(
Y
EERS
OH
CC
Y
NAES
×
×
where,NAES(Y) = number of air conditioners entering stock in year N EERS(Y) = Average EER of air conditioners entering stock in year Y
CC = Average cooling capacity of air conditioners is assumed to be 4.02kW
OH= annual operation hours of air conditioners = 299 days/year*9 hours/operational day= 2691 hrs/year
As for the number of air conditioner sales, a projection in the PDD shows that sales would increase from about 100,400 units in 2005 to reach about 169,000 units in 2011.
As for the EER development in the baseline case, energy efficiency performance of air conditioners to be sold in the Ghanaian market is assumed to improve by 0.2% annually, from 2.56513 in 2005 to 2.59066 in 2011 in EER’s term, based on the historical records. If CDM project had been implemented, EER of air conditioners sold in Ghanaian market would have been raised to 2.8 during the same period.
Operation hours and carbon intensity of electricity in Ghana is assumed to be constant during the project implementation period.
Following the estimation method shown above, Fig.6 indicates annual electricity generation caused by air conditioners for both the baseline case and the case with EER improvement by proposed CDM project.
Fig. 6 Electricity generation caused by air conditioner operation in Ghana between 2005 and 2011
0.0 2.0 4.0 6.0 8.0 10.0 12.0 14.0 2005 2006 2007 2008 2009 2010 2011 Year e lect ri ci ty ge ner a ti on (T W h) Baseline power generation reduced power generation (UNFCCC 2006)
Total electricity generation caused by air conditioners in Ghana between 2005 and 2011 is estimated to be 43TWh as indicated in Table 1. The possible reduction of electricity generation brought about by the enforcement of minimum energy standards would be 3TWh,
which accounts for 8% of total power generation during the same period. CO2 emissions can
be calculated by multiplying carbon intensity (kept constant at 0.88 kg CO2/kWh) by
electricity consumption. CO2 emissions would be reduced correspondingly by 3Mt as also
indicated in Table 1.
Table 1 CO2 emission and possible reduction for Ghanaian air conditioners between 2005 and 2011 Power generation (TWh) Reduction of power generation (TWh) Reduction of power generation (%) CO2 emission reduction (Mt) 43 3 8 3 (UNFCCC 2006)
3.2
Estimation of reduction of electricity generation and CO
2emission in China
3.2.1 Estimation method of electricity generation
The outlook for the reduction of electricity consumption caused by energy efficiency can be
obtained by subtracting the electricity generation of a low CO2 emission case from that of a
baseline case. For the baseline case, electricity generation is calculated based on the outlook of average EER of air conditioners without technology diffusion from developed countries and
the outlook of air conditioner stock of China. The low CO2 emission case is where the energy
efficiency of air conditioners is improved through technology diffusion. Total electricity consumption from 2006 through 2020 for each case can be calculated as the sum of electricity consumed by all air conditioners in each year as indicated in the following equation.
Total electricity consumption =
∑
= 2020 2006 Y(
)
(
1
)
)
(
Pl
Y
AEER
OH
CC
Y
NAS
−
×
×
×
where, AEER(Y), NAS(Y), CPE(Y) and Pl are defined as follows. NAS(Y) = Number of air conditioners in stock in year Y
CC = Cooling capacity of air conditioners is assumed to be 2.8kW OH = Annual operation hours kept constant at 400 hours
AEER(Y) = Average EER of all the air conditioners in year Y Pl = Distribution loss and suppliers own use kept at 21.9 %
Operation hours are assumed to be kept at 400 hours which is supposed to be the average for air conditioners in warm provinces in China. (David Fridley, Gregory Rosenquist et al. 2001) In this study, only electricity consumption by air conditioners in warm provinces of China is estimated since cooling only air conditioners are viable in these regions. Distribution loss and own use of electricity by suppliers is assumed to remain constant at the present level of 21.9%
over the next 15 years (IEA 2005). As for the cooling capacity of each air conditioner, it is
assumed to be 2.8kW which is common both in China and Japan.
3.2.2 Outlook of air conditioner stock in China
The outlook of air conditioners stock is indicated in Fig.7.
Fig. 7 Forecast for Air Conditioners in Stock in Chinese warm provinces
0 20,000 40,000 60,000 80,000 100,000 120,000 140,000 160,000 180,000 1997 2000 20052006 2010 2015 2020 Year U n it s( *1 ,0 00)
A dotted curve in the graph indicates the low outlook and a dashed curve depicts the high outlook of an air conditioners adoption in Chinese households in warm regions until 2020 respectively. (See Annex A) The warm or hot regions in China can be identified by selecting the southern provinces which are Suchuan, Hubei, Nanchang, Zhejiang, Hunan, Guangdong, Fujian, Jiangxi, and Guangxi shown in Fig.8. These provinces account for 34% of total households in China.
Fig.8 Map of China
The boundaries and names shown and the designations used on maps included in this publication do not imply official endorsement or acceptance by the IEA.
3.2.3 Outlook of average energy efficiency of Chinese air conditioners
Average energy efficiency of air conditioners in stock will be improved through the replacement of existing air conditioners with more energy efficient ones as shown in Fig.9.
Fig.9 Improvement of EER caused by the replacement of air conditioners
The average EER in year Y is the weighted average EER of the stock carried forward from
previous year of Y-1 and newly installed air conditioners in year Y. For the baseline case of CO2
emissions, the EER of air conditioners is assumed to develop with Chinese domestic
technologies and for the low CO2 emission case, EER of air conditioners is assumed to be
improved by the adoption of technologies coming from developed countries. In this replacement model, all the air conditioners are supposed to be replaced at the end of their lifetime; when the new air conditioners are more energy efficient. This will improve the average energy efficiency of air conditioners in stock year by year.
Average EER = AEER(Y) Air conditioner in stock in year Y Average EER = AEER(Y-1) Air conditioner in stock in year Y-1 Average EER = AEER(Y-1) Air conditioners replaced Air conditioner purchased in year Y Average EER =IEER(Y)
Two outlooks are made for the development of EER for air conditioners to be sold in both China and Japan, in order to set a high limit and a low limit of EER development as shown in Fig.10.
Fig.10 Outlook of EER for Chinese and Japanese Air Conditioners for sale
0.0 1.0 2.0 3.0 4.0 5.0 6.0 7.0 1997 2000 20052006 2010 2015 2020 Year EE R
EER of Japanese air conditioners
EER of Chinese air conditioners for fast technology development
EER of Chinese air conditioners for slow technology development MEPS in 2000 2005 2009
7 Years
The high EER outlook for Chinese air conditioners is depicted by a dashed line and lower one by a dash-dot line. The actual energy efficiency of Chinese air conditioners is expected to be between these two curves. A conservative outlook of the energy efficiency improvement is made based on the assumption that the EER of Chinese air conditioners will be improved at the same rate as their past improvement. The past improvement is assumed to be the same as the development of Chinese energy efficiency standards since most of the actual air conditioners have seemed to stay just above the energy efficiency standards as shown in Fig.2. For the estimate of higher EER development, it is assumed that the energy efficiency improvement of Chinese air conditioners will follow the same path as Japanese ones with a delay of seven years. In Japan, the average EER of air conditioners increased from 3.17 in 1997 to 5.27 in 2005 almost linearly as depicted with solid curve in Fig.4. The outlook of a future improvement of EER accompanying the revision of the Energy Efficient Law is extrapolated linearly as indicated with a dotted line. It is also assumed that the EER will stabilise after reaching 6.32 in 2010, though it might be improved further in its present situation.
The present EER of Chinese air conditioners is almost the same as Japanese air conditioners seven years ago. In the same graph, the MEPS of Chinese split type air conditioners with cooling capacity less than 4,500 W which were enforced in 2000 and 2005 and which will come into effect in 2009 are depicted by diamonds. The average EER was slightly above the MEPS in 2005. By observing the relationship between the MEPS and average EER of air conditioners, it is probable that development of future EER in 2009 and thereafter would be just above the MEPS to fall between the lower and higher improvement outlook.
Air conditioners sales in warm provinces in China from 2006 to 2020 for the low and high sales outlooks are depicted in Fig.11, which are derived from the outlooks of air conditioner stock indicated in Fig.7.
The sales of air conditioners are the sum of new installation and replacement occurring each year. The sales of air conditioners would increase for each scenario with fluctuation for each year caused by the fluctuation in the actual sales of air conditioners before 2005. The replacement of air conditioners will rise around 2015 since the sales of air conditioners were large around 2003.
Fig. 11 Outlook of air conditioner sales in Chinese warm provinces 0 2,000 4,000 6,000 8,000 10,000 12,000 14,000 16,000 18,000 20,000 2006 2010 2015 2020 Year U n it s (* 1 ,0 0 0 ) Low outlook sales High outlook sales
As for the occurrence of replacement by year, it is assumed that 40% of existing air conditioners are replaced when they reach their lifetime and the remaining 60% are assumed to be replaced before and after their lifetime. Outlooks of the average EER of air conditioners in stock for each scenario are indicated in Fig.12. In each graph, dotted curves and dashed curves indicate the average EER trend where only Chinese domestic technologies are used. Solids curves indicate the possible average EER development with energy efficiency technologies transferred from developed countries.
Fig. 12 Average energy efficiency improvement for a higher sales outlook
The right-hand graph in Fig.12 indicates the average EER improvement in next 15 years for the low sales outlook of Chinese air conditioners and a left-hand graph indicates the average EER improvement in next 15 years for the high sales outlook. Even if the development of Chinese domestic technologies were brisk, an average EER would be low compared to that realised by technology transfer from more developed countries. The difference between a solid curve and a dotted or dashed curves indicate the margin of energy efficiency improvement brought about by technology transfer.
3.2.4 Estimates of reduction in power generation and CO2 emission
Electricity generation for 4 cases caused by air conditioners and their potential reductions
realized through technology transfer are depicted in Table 2 with possible reduction of CO2
emissions.
Average EER development with technology transfer
Average EER with Chinese domestic technology developing actively Average EER with Chinese domestic technology developing slowly
High sale outlook of air conditioners
2.5 3.0 3.5 4.0 4.5 5.0 5.5 6.0 20052006 2010 2015 2020 Year EE R
Low sales outlook of air conditioners
2.5 3.0 3.5 4.0 4.5 5.0 5.5 6.0 2005200 6 201 0 2015 202 0 Year EE R Effects of Technolog y
Table 2 CO2 emission and possible reduction for Chinese air conditioners in Chinese warm provinces until 2020 Electricity generation (TWh) Reduction of electricity generation (TWh) Reduction of electricity generation (%) CO2 emission reduction (Mt)
High sales and high improvement
of Chinese domestic technologies 494 79 16 67
High sales and low improvement
of Chinese domestic technologies 674 260 38 216 Low sales and high improvement
of Chinese domestic technologies 401 62 15 52
Low sales and low improvement
of Chinese domestic technologies 521 181 34 152
Electricity generation caused by air conditioners in Chinese warm provinces over the next 15 years is estimated to range from 401TWh to 674TWh depending on sales outlooks and energy efficiency development of air conditioners. The possible reduction of power generation brought about by technology transfer from developed countries would range from 62TWh to 260TWh, which account for between 15% and 38% of total power generation in next 15 years.
CO2 emissions would be also reduced correspondingly. Chinese CO2 emission intensity will
decrease in a linear fashion from 0.9011kgCO2/kWh in 2005 to 0.7989kgCO2/kWh in 2020 due to
a power generation technology improvement and a decrease in ratio of coal power generation in China. (IEA 2004)
CO2 emissions in each year can be calculated by multiplying the electricity generation by CO2
emission intensity of each year. Details of calculation results are indicated in Fig.13 and Fig.14.
Fig. 13 Electricity generation caused by air conditioner operation for a high sales outlook
The outlook of electricity generation for the high sales outlook and the low sales outlook are indicated in Fig.13 and 14 respectively. Indicated on the right-hand side of each graph is the outlook of electricity generation where Chinese domestic technologies are improved slowly. The left-hand side graph shows the electricity generation where Chinese domestic technologies are improved briskly. The solid bars indicate the electricity generation outlook with solely Chinese domestic technologies used and meshed bar indicate the electricity generation outlook where more energy efficient technologies coming from developed countries are adopted. In the high sales scenario, electricity consumed by air conditioners would increase drastically in next 15 years but efficient technology transfer could curb the rise of electricity consumption.
High EER development for Chinese air conditioners
0.0 10.0 20.0 30.0 40.0 50.0 60.0 70.0 80.0 2006 2010 Year 2015 2020 E lec tr ic it y ge ner a ti o n (TW h )
Low EER development for Chinese air conditioners 0.0 10.0 20.0 30.0 40.0 50.0 60.0 70.0 80.0 2006 2010 Year 2015 2020 El e c tr ic it y G e n e ra ti o n (T W h )
In the low sales scenario, the electricity generation would not increase drastically, however there still seems to be a margin of improvement realised by technology transfer from developed countries.
Fig. 14 Electricity generation caused by air conditioner operation for a low sales outlook
High EER development for Chinese air conditioners 0.0 10.0 20.0 30.0 40.0 50.0 60.0 70.0 80.0 2006 2010 Year 2015 2020 El e c tric it y g e na ra ti on (T W h )
Low EER development for Chinese air conditioners 0.0 10.0 20.0 30.0 40.0 50.0 60.0 70.0 80.0 2006 2010 Year 2015 2020 El e c tric it y g e na ra ti on (T W h )
4.
Barriers and countermeasures for the energy efficiency of air
conditioners
4.1
General description of barriers to the diffusion of appliances and
measures to overcome them
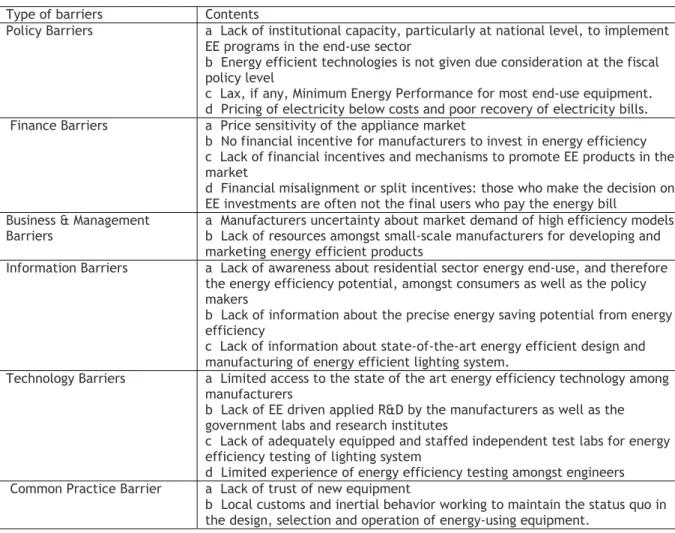
General barriers to the diffusion of energy efficient appliances are outlined in Table 3. This Table was prepared for the barrier analysis for energy efficient lighting. However, it is likely to be applicable to other types of appliances.
Table 3 Main barriers to energy efficient products in developing countries
Type of barriers Contents
Policy Barriers a Lack of institutional capacity, particularly at national level, to implement EE programs in the end-use sector
b Energy efficient technologies is not given due consideration at the fiscal policy level
c Lax, if any, Minimum Energy Performance for most end-use equipment. d Pricing of electricity below costs and poor recovery of electricity bills. Finance Barriers a Price sensitivity of the appliance market
b No financial incentive for manufacturers to invest in energy efficiency c Lack of financial incentives and mechanisms to promote EE products in the market
d Financial misalignment or split incentives: those who make the decision on EE investments are often not the final users who pay the energy bill
Business & Management
Barriers a Manufacturers uncertainty about market demand of high efficiency models b Lack of resources amongst small-scale manufacturers for developing and marketing energy efficient products
Information Barriers a Lack of awareness about residential sector energy end-use, and therefore the energy efficiency potential, amongst consumers as well as the policy makers
b Lack of information about the precise energy saving potential from energy efficiency
c Lack of information about state-of-the-art energy efficient design and manufacturing of energy efficient lighting system.
Technology Barriers a Limited access to the state of the art energy efficiency technology among manufacturers
b Lack of EE driven applied R&D by the manufacturers as well as the government labs and research institutes
c Lack of adequately equipped and staffed independent test labs for energy efficiency testing of lighting system
d Limited experience of energy efficiency testing amongst engineers Common Practice Barrier a Lack of trust of new equipment
b Local customs and inertial behavior working to maintain the status quo in the design, selection and operation of energy-using equipment.
(Figueres and Bosi, 2006)
The influence of each barrier differs from one country to another due to the difference in technological, financial and political situation in each country. In addition, some barriers are on the national level while others exist on the international level (Cf. Ellis and Kamel, 2007). Since some barriers such as low pricing of electricity and split incentives are domestic and institutional, it is more difficult to come up with policies and implementation measures to overcome these barriers. However, other barriers linked to finance, information and technology might be overcome through financial and technical measures to assist market transformation.
From 1991 to 2000, the GEF approved eight projects designed to stimulate markets for energy-efficient products—lights, refrigerators, industrial boilers, and building chillers—in 12 developing and transition countries. Total project costs for this portfolio are about $520
million, with GEF contributions of $90 million and co-financing from other donors, multilateral agencies, governments, and private companies of $430 million. These projects use a combination of approaches to remove supply side and demand-side barriers to sustained markets for energy-efficient products. (Birnera, S. and Martinot 2005)
Table 4 shows some of the projects outlined implemented under GEF. For many of the projects, the GEF funds contributed to expansion of markets for energy efficient appliances by capacity building of government officials, labelling program and technology transfer. However, for some projects aiming at the technology transfer of advanced technologies, they did not seem to achieve the expected goals due to the lack of financing and insufficient protection of intellectual property.
Table 4 Examples of GEF projects on energy efficiency of home appliances
Project (date approved by
GEF Council) Implementing agency / budget Description / Suggestion Mexico high efficiency
lighting pilot (1991)
World Bank / 7.7m euros GEF 17.8m euros total
Pilot a utility DSM program to sell CFLs purchased by bulk procurement to residential consumers
China efficient industrial
boilers (1996) World Bank / 25.5m euros GEF 78.2m euros total
Develop affordable energy-efficient industrial boiler designs by technology transfer and mass produce and market these designs throughout China
China commercialisation of energy efficient CFC-free refrigerators (1998) UNDP / 7.7m euros GEF 31.7m euros total
Assist Chinese manufacturers to design, produce, and market efficient refrigerators; raise demand with education, marketing, incentives and labelling Thailand promotion of electricity energy efficiency (1991) World Bank / 7.4m euros GEF 147.0m euros total
Conduct a 5-year utility DSM program by the national electric utility responsible for power generation (EGAT)
(Birnera, S. and Martinot 2005)
4.2 Barriers to the diffusion of energy efficient air conditioners in developing
countries
Barriers and countermeasures for the diffusion of energy efficient air conditioners are studied for two types of countries, which are countries with their own manufacturers and countries without their own manufacturers: China and Ghana, respectively. In countries with their own
manufacturers, Finance Barriers and Business & Management Barriers are likely to suppress the
diffusion of more energy efficient air conditioners on top of Policy, Information Technology Barriers which are main barriers in less developed countries.
Potential solutions are then offered and the role of CDM in weakening the current barriers is studied. Let us look at the CDM as a mechanism that could create funds through the sale of credits generated by the individual projects. These revenues are currently in the hands of the project investors and implementers, but there are examples (in China) where a tax is being put on certain project types, implying that the government receives a share of the CERs. In this paper we assume that the government retains (a share of) the revenues from CDM projects, which can therefore be used to set incentives for investments in energy efficient appliances.
4.2.1. Barriers in Ghana
Products have to be imported from other countries where countries do not have their own manufacturers, like Ghana. In these countries, Policy, Information and Technology barriers depicted in Table 3 are likely to hamper the diffusion of energy efficient appliances.
The previous section has highlighted the high potential for energy efficient air conditioners in Ghana. Until now, however, this potential has not yet materialised. The project design document of CDM on energy efficient air conditioners in Ghana suggests lack of capacity on the part of the government to implement an appliance standard as the barriers to the diffusion of
energy efficient appliances. This is caused by the lack of education of policy makers, various government agencies (i.e. customs officials), importers, distributors and consumers. Sufficient testing capacity of advanced energy efficient appliances is also mentioned as essential for the implementation of the project since accurate information on energy efficiency of appliances is indispensable for labelling programs. Without labelling programs, it would be difficult to provide appropriate information on the advantage of energy efficiency to consumers, retailers and government officials including customs officials. Though the Ghanaian Government has been aware of the policy benefits of implementing a standard and labelling program, they have lacked the financial resources to implement these measures.
Fig.15 indicates the relationship between energy efficiency performance and prices in US dollars for air conditioners sold in Ghanaian markets. Proposed minimum energy efficiency standards (EER=2.8) are indicated with a thick line in the same graph. Since the prices of air conditioners do not rise with the increase of EER, consumers do not have to pay additional costs on the purchase of more energy efficient air conditioners. However, air conditioners with EER lower than minimum energy efficiency standards are dominant in Ghanaian markets due to insufficient information dissemination to custom officials and to the general public at present.
Fig.15 Energy efficiency performance and prices of air conditioners sold in Ghana
(UNFCCC 2006)
4.2.2 Possible Countermeasures in Ghana
In Ghana’s case, implementing measures for the enforcement of the minimum energy efficiency standards (EER=2.8), such as establishment of a well-equipped laboratory and capacity building of government officials such as customs officials and staffs in the testing laboratory, are proposed. The feasibility of these measures to be taken for the energy efficiency of appliances can be estimated by assessing the effects of projects implemented by the GEF in other developing countries.
In 1993, the Thai national electric power utility (EGAT) launched a comprehensive five-year DSM program. The utility first created a new DSM office, and then supported that office in developing and implementing a number of different market interventions for energy efficiency. Once the DSM office staff was trained, it showed strong leadership and initiative throughout the program—a key factor in many of the results. (Birnera and Martinot, 2005) This project proved the effectiveness of a labelling program on policy and presumably on technology barriers, too. The fund from the GEF was effectively used for strengthening the technological capacity of government officials working for the energy efficiency of appliances. This suggests that the proposed CDM project – whose revenues are assumed to be available for public interventions – could strengthen the capacity of government officials in Ghana, which will be a foundation for the implementation of programs to increase public awareness on energy efficient appliances.
The second example shows the effectiveness of GEF projects on information dissemination of energy efficient appliances in China. The project was to conduct education programs to enable consumers to understand the benefits of efficient refrigerators, create incentive programs for retailers to stock the efficient models, enact a national labelling program so consumers had the right information to choose between different models in the store, and create national standards against which different models could be compared. (Birnera and Martinot, 2005) For the CDM project in Ghana, information should be disseminated to government officials, as well as to consumers. The project in China shows the effect of the project implementation on lowering the information barriers exiting for policy makers, various government agencies (i.e. customs officials), importers, distributors and consumers in Ghana.
The success of these projects indicates that funds coming from aid organisations are an essential factor for the smooth implementation of projects on energy efficiency of appliances in developing countries. These funds could offer necessary financial resources to overcome existing policy, information and technology barriers in developing countries. For the implementation of these countermeasures, a newly introduced programmatic approach of CDM could be effective because of small scale and wide spread characteristics of home appliances.
4.2.3. Potential barriers in China
In developing countries with their own manufacturers, Financial and Business & Management barriers depicted in Table 3 are likely to hamper the diffusion of more energy efficient appliances. To better highlight this point, let us provide some empirical evidence, comparing the circumstances in China with those in a country that has managed to overcome a wide range of barriers hampering energy efficient appliances, Japan. Fig.16 and Fig 17 depict the Financial barrier facing consumers in China. Crosses in Fig.16 depict the relationship between purchase prices and EER air conditioners with cooling capacity of 2.8kW in Japan and diamonds indicate those sold in China. For Japanese air conditioners, the information is collected by POS (Point of Selling) system which cover 35-40% of total air conditioner sales in Japan. (ECCJ 2006b) For Chinese air conditioners, the information was collected from internet shopping sites.
Fig.16 Purchase prices of Japanese air conditioner
The overall trends show a rise with increases in energy efficiency. The prices rise steeply for air conditioners of EER of 4.0 or more. Energy efficiency of Chinese air conditioners is higher than that of air conditioners in Ghana. However, the margin of improvement of EER remains low compared to that of more developed countries. There are overlaps for the energy efficiency of Chinese and Japanese air conditioners. If the price of air conditioners of the same energy efficiency is compared, the difference in the selling price between Japanese air conditioners and Chinese air conditioners is almost zero. The difference is small because some of the air conditioners sold in Japan are manufactured in China. These facts suggest that the price of more energy efficient air conditioners presently sold in Japan would be in the same price range if they were sold in China.
2.8kW air conditioners 0 200 400 600 800 1000 1200 1400 2.0 3.0 4.0 5.0 6.0 EER P u rc h ased p ri ce( eu ro s)
In Fig.17, the LCC for 2.8kW air conditioners to be used in China is depicted with the discount rate changed from 5% to 10%.
Fig.17 LCC of air conditioner with cooling capacity of 2.8kW
LCC is calculated using the price information of Japanese air conditioners depicted in Fig.16 where the operation hours and the electricity tariff are set to be identical with the value for air conditioners in Guangzho (representing warm provinces). The LCC for Japanese air conditioners to be used in China is depicted by crosses in both graphs with solid trendcurves added. LCC for Chinese air conditioners is also depicted in both the graphs by diamonds with dashed trendcurves added.
Operation hours of air conditioners are short in China and the LCC curve is strongly affected by the rise in purchase costs. For both discount rates, LCC increases with the rise of EER, which should make their diffusion more difficult. This is considered to be a financial barrier as indicated in Table 3. Since operation hours will not change immediately, it is essential to suppress the purchase prices as low as possible for the diffusion of energy efficient air conditioners.
Presently, enforced low energy efficiency standards offer little incentive on manufacturing
energy efficient products to manufacturers. Chinese air conditioners are categorised into five
grades in terms of EER as shown in Fig.2. Air conditioners with the EER of 3.4 or more are categorised as the most energy-efficient air conditioners. Minimum energy efficiency required for the least energy-efficiency air conditioners is set to be 2.6 in terms of EER by the labelling program presently implemented in China. Fig.18 explains the Business & Management barrier facing domestic manufacturers in China. In this graph, the energy efficiency standards of Japanese air conditioners stipulated in the Top Runner Program are compared with Chinese air conditioners. Requirements for larger cooling capacity air conditioners in Japan are less strict than for smaller ones. However, Chinese requirements imposed on those with a low cooling capacity (which are also popular in China as well as Japan) are 50% less stringent than Japanese requirements. This is considered to be a business & management barrier as indicated in Table 3.
LCC for 5% discount rate
0 200 400 600 800 1000 1200 1400 1600 2.5 3.5 4.5 5.5 6.5 EER LCC ( e ur os )
LCC for 10% discount rate
0 200 400 600 800 1000 1200 1400 1600 2.5 3.5 4.5 5.5 6.5 EER LC C ( e ur os )
Fig.18 Energy Efficiency Requirement in EER for Japanese Split Heat Pump by Top Runner Program 0.00 1.00 2.00 3.00 4.00 5.00 6.00 Less than 2500W 2500-3200W 3200-4000W 4000-7100W More than 7000W
Cooling capacity range(W)
EER EE requirements in Japan Minimum EE requirements in China Maximum EE requirements in China (CNIS 2005, ECCJ 2007)
Chinese domestic manufacturers are reluctant to invest in R&D, since R&D resources of medium and small scale domestic manufacturers are low. Actually, the percentage of expenditure on science and technology in China was 1.49% in 2004 (Chinese Statistical Book 2006), which was less than half of R&D expenditure in Japan reaching 3.49% in 2004 (METI 2005). The expenditure of small enterprises is likely to be far smaller than the average percentage of R&D expenditure for the whole industry. In developing countries, there are typically a higher proportion of small or medium sized manufacturers, compared to developed countries. For example, about 60% of air conditioners sold in Chinese markets were coming from four major manufacturers. The remaining 40% are supplied by smaller domestic manufacturers as shown in Fig.19.
Fig.19 Market Share of Air Conditioners by Manufacturers, January - June 1998
Gree 17% Chunlan 16% Meidi 13% Haier 13% Kelong 9% Sharp 5% Hualing 5% Jingsong 5% Matsutishita 4% Mitsubishi 2% Others 11%
(David Fridley, Gregory Rosenquist et al. 2001)
Making investment in the energy efficiency of appliances is likely to be more demanding for small or medium scale manufacturers than for large scale manufacturers since they face severe sales competition. Some major Chinese domestic manufacturers already seem to possess the relatively sophisticated energy efficiency technologies, but the remaining smaller manufacturers could not catch up with the development of energy efficient technologies which requires large amount of investments. A similar obstacle was experienced in the DSM project implemented under the GEF in Thailand, where EGAT also tried to develop a labelling scheme for air conditioners. However, in contrast to the small number of fluorescent tube and refrigerator manufacturers, the Thai air conditioner industry was more fragmented, with 55 different manufacturers. In addition, the added cost for more-efficient air conditioner models was higher than for refrigerators. EGAT did offer interest-free loans for the added costs of level-5 (most energy efficient) units through local credit card companies and rebates through retail stores selling level-5 models during promotional periods. However, EGAT was unable to reach agreement with the air conditioner industry on mandatory labels or on ratcheting up efficiency levels for each label level over time. (Birnera, S. and Martinot 2005)
It should also be noted that the manufacturers of developed countries are not so eager to export their product or transfer energy efficient technologies since their energy efficient
products can not be distinguished from less energy efficient products with Chinese present standards.
4.2.4 Possible countermeasures in China
Financial barriers are thus a major reason hampering the adoption of energy efficient appliances in countries like China. One measure to reduce purchase costs of air conditioners is to increase the market size. “Learning-by-doing” suggests that, on general, manufacturing costs of new technologies decrease by 18% for every sales increase of 100%. (IEA 2000a) If manufacturers were to produce and sell their products in emerging Chinese markets of energy efficient air conditioners, they might be able to lower their manufacturing costs, which also would decrease the selling prices at retailers. Since the sales of air conditioners in emerging air conditioner markets in Chinese warm provinces are expected to be comparable to existing Japanese markets, the possible reduction of manufacturing cost of Japanese air conditioners manufactured in Chinese factories would reach about 20%. Increase of public awareness of more energy efficient air conditioners in China will contribute to raising the sales of more energy efficient air conditioners and creating the new markets for energy efficient air conditioners. Labelling programs can also be effective in increasing public awareness as has been experienced in developed countries.
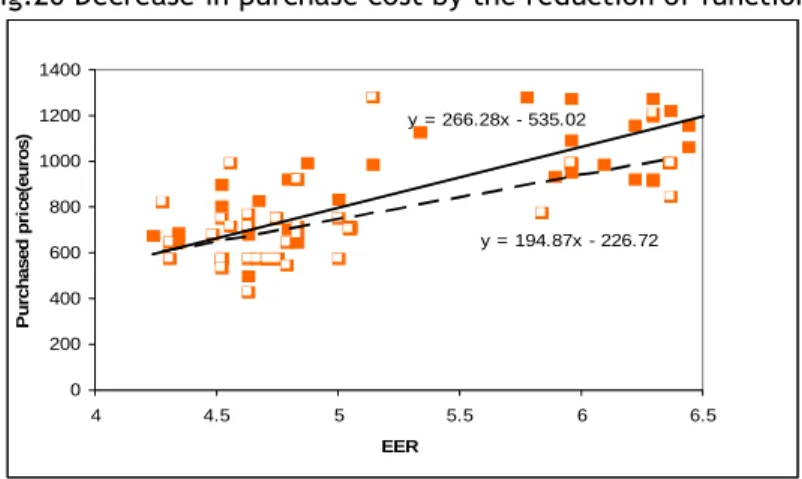
Another measure which might reduce the purchase price of more energy efficient air conditioners is proper specification setting. Japanese air conditioners, for example, are equipped with functions to increase comfort and reduce chores, such as automatic filter cleaning, ventilation, air cleaning, air flow control and preheating of air during the operation of dehumidification. In Fig.20, the effects of reducing additional functions on purchase cost are depicted. Squares indicate the price of air conditioners and painted squares especially indicate the price of multi-functional air conditioners. The ratio of products with more sophisticated features is higher among the more energy efficient air conditioners, which may raise the purchase price of energy efficient air conditioners. A dashed line in the graph indicates a trendline for the price of air conditioners with seemingly basic functions, which are identified by eliminating air conditioners with more than two additional functions.
In order to promote the diffusion of air conditioners with less functions, authority technology procurement would be effective. For example, Sweden’s technology procurement program, administered by the Swedish National Energy Authority (STEM), gathered potential purchasers of some particular equipment (item, process or system) and puts them together with energy experts in order to draft energy efficiency and other performance specifications for an equipment development competition. STEM subsidises the purchasers with a certain proportion of the purchasing cost of new products, in order to cover the risks always associated with the application of new technology, under the condition that the product installations can be used for demonstration purposes. (IEA 2003). The similar government procurement programs could be implemented in developing countries for the prioritised purchase of basic function appliances.
Fig.20 Decrease in purchase cost by the reduction of functions y = 266.28x - 535.02 y = 194.87x - 226.72 0 200 400 600 800 1000 1200 1400 4 4.5 5 5.5 6 6.5 EER P u rc ha sed p ri ce( eu ro s)
Fig. 21 Energy efficiency of Chinese air conditioners before and after the labeling program
(CNIS 2005)
Fig.21 indicates the comparison of energy efficiency of air conditioners before and after the categorical energy labelling program was introduced in China in 2005. The figure shows that the energy efficiency requirements set by the labelling program have been effective in stimulating energy efficiency improvements in China. However, it would be difficult for these small or medium scale manufacturers to follow the drastic rise of energy efficiency standards which may cause bankruptcy and unemployment in developing countries like China. Even with present energy efficiency standards, “failure to comply with standard requirement” and “exaggeration of manufacture’s advertising” is occurring. (CNIS 2005)
In order to mitigate the impact to a society caused by bankruptcy and unemployment, the energy efficiency standard should be raised so as not to eliminate all the products presently manufactured by small scale domestic manufacturers. In China, the air conditioners are categorised by 5 grades from grade 5 (minimum energy efficiency standard) to grade 1 reflecting the energy efficiency of most efficient appliances at present as indicated in Fig.22. If grade 1 and grade 5 were set to reflect the energy efficiency performance of most energy efficient appliances available in developed countries and the energy efficiency performance of appliances presently sold in developing countries respectively as indicated in Fig. 22, the labelling program could transform the market in developing countries in a manner acceptable to manufacturers in developing countries.
-40% -20% 0% 20% 40% 60% 80%
1级 first Grade 2级 2nd Grade 5级 5th Grade <5级 less than 5th Grade 能效等级 Energy grade 市 场 占 有 率 Ma rket sh are 3月1日以前生产的产品 Produced before Mar.1 3月1日起至10月份生产的产品 Produced between Mar.1 and Oct.
Fig.22 Energy efficiency labelling and requirements for each grade
(UNDP 2006)
As well as mass production, proper standards and specification settings, offering rebates to consumers could contribute to the apparent suppression of prices of air conditioners. The funds for rebates could be generated by the sales of CER generated by CDM, as specified
above.In this case, it is assumed that the CER is generated if the energy efficiency is improved
beyond the average energy efficiency of air conditioners presently sold in Chinese markets, which is 2.8 in terms of EER. It is also assumed that 70% of funds obtained from CER sales could be offered to consumers as rebates on their purchase of energy efficient air conditioners. The remaining 30% are distributed to project implementers and project investors of CDM as project management expenses. It should be noted that the appropriate distribution of funds will be studied further.
In Fig.23, the LCC curve realised by the combined measure of mass production, function reduction and rebates to consumers is depicted by the original LCC curve without measures taken.
A horizontal dot-dash line in the graph indicates the LCC level which is realised by air conditioners of average EER (EER=2.8) presently sold in China. Any air conditioners with LCC below this line are regarded as economically feasible in terms of LCC. (See Annex B)
Fig.23 Decrease in LCC by mass-purchase and reduction of additional functions
The feasible EER of air conditioners could be raised up to around 5.0, which is about the same as the average EER of air conditioners available in Japan at present. The funds might be more effectively utilised if they were offered to manufacturers directly. It could reduce markups for the distribution of products and transaction costs to offer rebates to each consumer. If the funds generated by CDM were delivered directly to manufacturers, it would also contribute to overcoming Business & Management barriers by providing incentives to suppliers of energy efficient appliances.
LCC for 5% discount rate
0 200 400 600 800 1000 1200 1400 3.5 4 4.5 5 5.5 6 6.5 EER L C C (eu ro s) Present situation Mass production, reduction of functions and CDM
LCC for 5% discount rate
0 200 400 600 800 1000 1200 1400 3.5 4 4.5 5 5.5 6 6.5 EER LC C( e u ro s ) Present situation Mass production, reduction of functions and CDM Energy efficiency of air conditioners
available in developed countries Energy efficiency of air conditioners presently sold in developing countries