2013 International Nuclear Atlantic Conference - INAC 2013 Recife, PE, Brazil, November 24-29, 2013
ASSOCIAÇÃO BRASILEIRA DE ENERGIA NUCLEAR - ABEN
ISBN: 978-85-99141-05-2
DETERMINATION OF URANIUM AND ZIRCONIUM BY
FLOW INJECTION ANALYSIS
Alvaro S. F. de Sousa1, Maria de L. F. Domingues1, Valeska P. de Araujo Rocha1 and Camila S. de Jesus1,2
1
Instituto de Engenharia Nuclear (IEN / CNEN) – Divisão de Engenharia Nuclear Serviço de Química nuclear e Rejeitos – Rua Hélio de Almeida, 75
Cidade Universitária - Ilha do Fundão –Rio de Janeiro – RJ – Brasil - CEP 21941 906
[email protected] [email protected]
2
Industrias Nucleares do Brasil (INB/CNEN) – Diretoria de Recursos Minerais - Av. João Cabral de Mello Neto, n° 400 sala 101 a 304 - Barra da Tijuca - Rio de Janeiro – RJ – CEP 22775-057
ABSTRACT
As an integral part of chemical quality control of nuclear materials a method for determination of uranium and zirconium, in a mixture is presented. A simple, cheap, selective and quantitative Flow Injection Analysis (FIA) system was developed. Zirconium and uranium were determinate in presence of each other and no prior separation was needed. Arsenazo III was used as a colorimetric reagent and parameters such as acidity and reagents concentration were studied and optimized. An analytical throughput of 30 sample determination per hour was obtained.
1. INTRODUCTION
Spectrophotometry is the cheapest and simplest instrumental technique used for the determination of uranium and zirconium. However, the application of this technique is almost difficult to the simultaneous determination of uranium and zirconium, because the absorption spectra of the chromophores created by these elements, generally, overlap in bright region and the superimposed curves are not suitable for quantitative evaluation [1]. The use of FIA with spectrophotometric detection in order to determine simultaneously elements which present superimposed curves has been demonstrated to be a feasible and promising alternative for analytical purposes [2].
Similarly, uranium and thorium present the same difficult and can be easily detected and quantified in presence, one each other in a FIA system with spectrophotometric detection [2] despite of the interference of the superimposed curves that are produced by the crhomophore used. Basically the technique consist in measure the signal produced by Th(IV) and U(VI) together, and then again by reduced the U(VI) to U(IV), in presence of Arsenazo III in strong
acid media . The first measurement correspond only to the Th(IV) signal and the second measure to the Th(IV) and the U(IV) signal. The difference between the second and the first measure gives the signal correspondent to the uranium. This is possible because U(VI) has no notable signal in the conditions used, and only U(IV) is detected.
The goal of this work was to develop and optimize an on line system that determine uranium and zirconium in presence one each other. Several physic-chemical parameters were evaluated and optimum conditions for the determination of uranium and zirconium were established. The uranium concentration in the samples was determined by spectrophotometry with Arsenazo III using a FIA system.
2. EXPERIMENTAL
2.1. Reagents and Solutions
All solutions were prepared from analytical-reagent grade by adequate dilution in tri-distilled water. Uranium and zirconium stock solutions (500 mg L-1) were prepared by dissolving the appropriated amount of UO2(NO3)2.6H2O (Merck) and ZrCl4 (Aldrich) in HCl 3.6 mol L-1. The carrier stream was HCl 3.6 mol L-1 and Arsenazo III (Fluka) 1.0·10-4 mol L-1 in HCl 3.6 mol L-1 was used as the reagent solution. Lead powder (0.1 - 0.3 mm particle size, Merck) was used for uranium reduction onto the mini column. Pitchblende (IAEA) sample (0.075 mm particle size), were dissolved by HCl and HNO3 (Merck) and later analyzed by ICP-MS showing the following results in U3O8: P3 = 0.036 ± 0.001 %.
2.2. Instrumentation and Apparatus
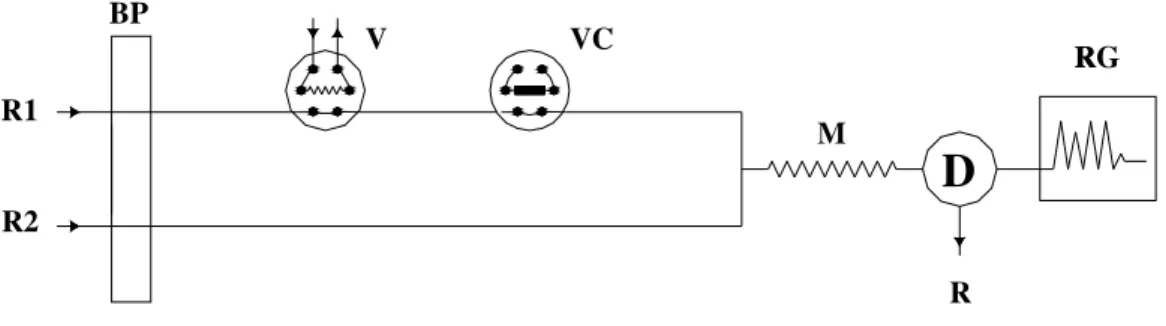
The absorption spectra (400 nm to 800 nm) were obtained using glass cells with 10 mm optical path using a spectrophotometer UV / Visible double beam model GBC UV / VIS 918. The FIA set-up system for uranium and zirconium determination (Figure 1) consist of: a Gilson Miniplus 2 HP-8 (France) peristaltic pump, two Rheodyne 5041 (Cotati, CA, USA) six-port valves, one 250 µL loop sampler. Polypropylene connection (inverted Y shape), one glass/polypropylene column (2 ID x 300 mm length) filled with lead powder, one stitched mixer in PTFE tube (0.8 ID x 300 mm length), a GBC UV/VIS 911A (Australia) UV-vis spectrophotometer set at 665 nm with a Hellma (Jamaica, NY, USA) standard glass flow cell of 80 µL internal volume and 10 mm optical path and a computer for data collection.
R1 RG R M V R BP R2
D
VCFigure 1. FIA set-up system for uranium and zirconium determination: (BP) peristaltic pump, (V) six-port injection valve with 250 µL loop sampler , (VC) six-port injection
valve with a glass/polypropylene reduction column, (M) stitched mixer, (R1) carrier solution HCl 3.6 mol L-1, (R2) reagent solution Arsenazo III 1.0·10-4 mol L-1 in HCl 3.6
mol L-1 media, (R) waste, (D) GBC UV/VIS 911A UV-vis spectrophotometer, (RG) computer.
2.3. General Procedure:
2.3.1. Flow injection system for uranium and zirconium determination
The FIA system for uranium and zirconium determination, depicted in Figure 1 is started with the valve (V) in the load position. The loop is filled with sample or standard solutions, while the HCl 3.6 mol L-1 carrier stream (R1), bypass through the reduction column in (VC), and then is mixed with the reagent stream Arsenazo III 1.0·10-4 mol L-1 in HCl 3.6 mol L-1 media (R2), yielding a final stream that allows the establishment of the signal (for zirconium). In the second step the loop is filled again with sample or standard solutions, while the HCl 3.6 mol L-1 carrier stream (R1), pass though the reduction column in (VC), and then is mixed with the reagent stream Arsenazo III 1.0 · 10-4 mol L-1 (R2), yielding a final stream that allows the establishment of the signal (for zirconium plus uranium).
2.3.2. Uranium and zirconium signals
The following equation was used to calculate the uranium signal in the FIA system.
SU = S(Zr4+U4)-S(Zr4+U6) (1)
Where S(Zr4+U4)-and S(Zr4+U6) are respectively the signals of zirconium and uranium when the sample or standard solutions passed through the reduction column and bypassed though the reduction column. SU is the uranium signal used in the uranium analytical curve to calculate the uranium concentration and the S(Zr4+U6) is also the signal correspondent to zirconium
signal, which is used in the zirconium analytical curve to calculate the zirconium concentration.
3. RESULTS AND DISCUSSION
3.1. Absorption spectra
The profiles obtained for the complexes of Zr(IV)-Arsenazo III; U(VI)-Arsenazo III and U(IV)-Arsenazo III between 620 and 680 nm (Figure 2) indicates a difference between maximum absorption for both (U (VI ) of 653 nm and the U (IV) at 664 nm) and the superimposed curves of the uranium and zirconium Arsenazo III complexes.
400 500 600 700 800 -0,20 -0,15 -0,10 -0,05 0,00 0,05 0,10 0,15 0,20 0,25 0,30 0,35 Zr(IV) U(VI) U(IV) Arsenazo III A b so rb a n ce nm
Figure 2. Absorption spectra (400 nm to 800 nm) of Arsenazo III; U(IV)-Arsenazo III; U(VI)-Arsenazo III; Zr(IV)-Arsenazo III; in HCl 3.6 mol L-1 media. GBC UV / VIS 918
Spectrophotometry, cell with optical path length of 10 mm.
3.2. The Effect of the Acidity in the Intensity of the Absorbance Signal of Uranium
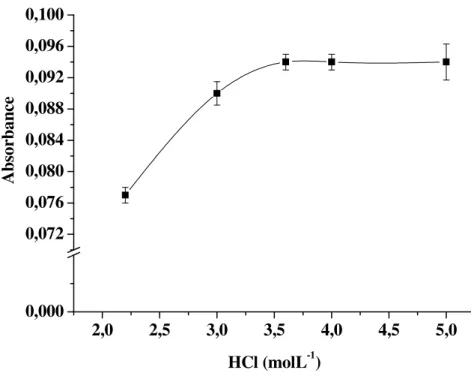
Arsenazo III is a non-specific reagent for uranium [3], however, a high selectivity can be achieved for the U(IV) in strongly acidic medium (Figure 3) where only the thorium and zirconium react with the Arsenazo III. According to literature the optimal HCl concentration is 4 molL-1 [4] as demonstrated in Figure 3, but the application of such concentration can become complicated its use in the system of flow injection analysis proposed, because of the hydrogen gas release. In concentrations higher than 3.7 molL-1 the acid become to attack the lead used into the reduction column, releasing hydrogen gas. The gas, once formed, will be
entrained into the flow cell making a oscillating signal and impairment measurements. Therefore, we chose to work with a concentration of 3.6 molL-1.
2,0 2,5 3,0 3,5 4,0 4,5 5,0 0,000 0,072 0,076 0,080 0,084 0,088 0,092 0,096 0,100 A b so rb a n ce HCl (molL-1)
Figure 3. The effect of the acidity in the intensity of the absorbance signal of U(IV)-Arsenazo III complex. Uranium concentration 0.5 mgL-1 and Arsenazo III 2.0 x 10⁻⁴ molL-1, in HCl media. The measurements were carried out on a GBC UV / VIS 918
spectrophotometry, at 665 nm with a cell optical path length of 10 mm.
3.3. Analytical Characteristics
3.3.1. Uranium determination
For uranium concentration ranging between 0.05 and 2.0 mg L-1, the signal was found to be proportional to the uranium concentration and a straight line was obtained with a correlation coefficient (r) of 0.999 for the follow curve calibration:
SU = (0.177[U] ± 0.001) – (0.003 ± 0.001) (2) Where SU is the absorbance signal measured, and [U] the unknown uranium concentration in mg L-1. Detection limit (DL: 3 σ criterion) and quantification limit (QL: 10 σ criterion) derived from 5 measurements of blank solution were 0.02 and 0.06 mg L-1, respectively. A Relative Standard Deviation (RSD) of 2.83 % at 0.10 mg L-1 was also derived from 5 measurements of the solution. A sampling frequency of 30 h-1 was calculated, taking into consideration a time passed between two consecutive injections.
3.3.2. Zirconium determination
For zirconium concentration ranging between 0.2 and 1.0 mg L-1, the signal was found to be proportional to the zirconium concentration and a straight line was obtained with a correlation coefficient (r) of 0.995 for the follow curve calibration:
S(Zr4+U6) = (0.220 )[Zr] ± 0.012 – (0.031 ± 0.008) (3) Where S(Zr4+U6) is the absorbance signal measured when the sample or standard solutions passed though the reduction column, and [Zr] the unknown zirconium concentration in mgL -1
. Detection limit (DL: 3 σ criterion) and quantification limit (QL: 10 σ criterion) derived from 5 measurements of blank solution were 0.052 and 0.102 mg L-1, respectively. A Relative Standard Deviation (RSD) of 1.98 % at 0.20 mg L-1 was also derived from 5 measurements of the solution. A sampling frequency of 30 h-1 was calculated, taking into consideration a time passed between two consecutive injections.
3.4. Application
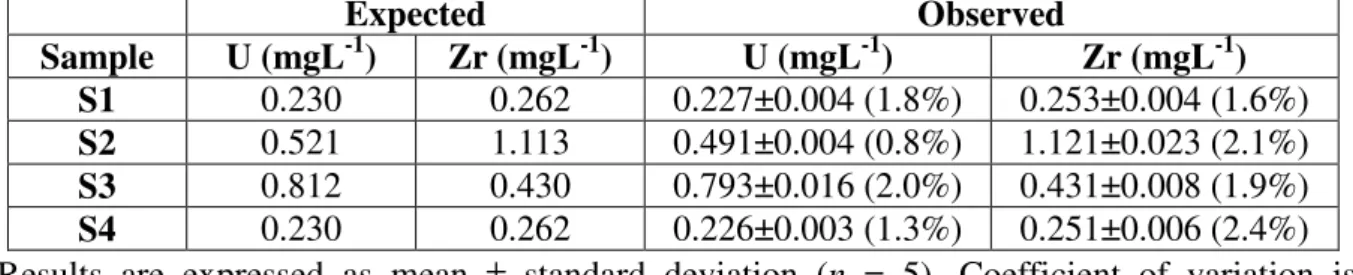
Table 1 and Table 2 show uranium and zirconium values for four samples (S1, S2, S3 and S4). S1, S2 and S3 are mix of standard solution with different proportions of uranium and zirconium. S4 are a pitchblende sample with an addition of uranium and zirconium standard solutions. The determinations were done by FIA-UVvis technique proposed. All were derived from 5 measurements. Analyzing the correlation between the values by the paired t-test, no sensible changing between the expected value and the observed value were noticed. The null hypothesis was retained the method proposed do not give significantly different values for means of uranium and zirconium concentrations.
Table 1: Uranium and zirconium determinations by the proposed method.
Expected Observed Sample U (mgL-1) Zr (mgL-1) U (mgL-1) Zr (mgL-1) S1 0.230 0.262 0.227±0.004 (1.8%) 0.253±0.004 (1.6%) S2 0.521 1.113 0.491±0.004 (0.8%) 1.121±0.023 (2.1%) S3 0.812 0.430 0.793±0.016 (2.0%) 0.431±0.008 (1.9%) S4 0.230 0.262 0.226±0.003 (1.3%) 0.251±0.006 (2.4%) Results are expressed as mean ± standard deviation (n = 5). Coefficient of variation is between parentheses.
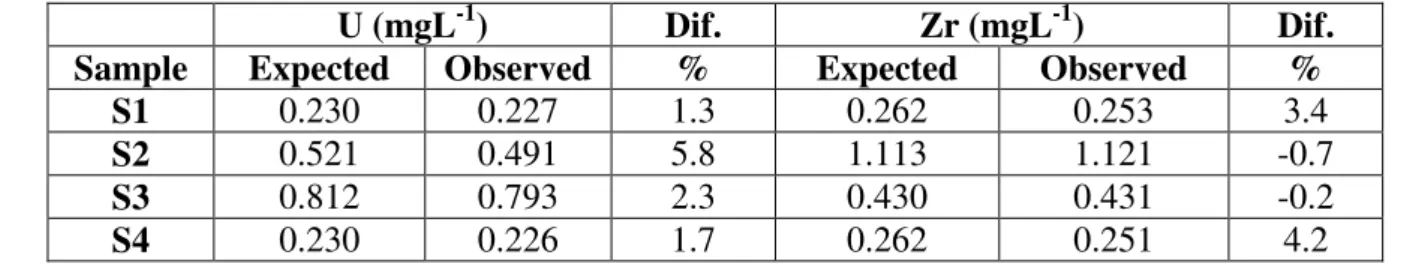
Table 2: Percentage difference between the concentrations of the observed and the expected values of uranium and zirconium obtained with the proposed method.
U (mgL-1) Dif. Zr (mgL-1) Dif. Sample Expected Observed % Expected Observed %
S1 0.230 0.227 1.3 0.262 0.253 3.4
S2 0.521 0.491 5.8 1.113 1.121 -0.7
S3 0.812 0.793 2.3 0.430 0.431 -0.2
S4 0.230 0.226 1.7 0.262 0.251 4.2
4. CONCLUSIONS
The proposed methodology developed, proved to be successful for uranium and zirconium determination in presence one of each other and no prior separation was needed. Comparison between the concentrations of the observed and the expected values for uranium and zirconium obtained with the proposed method demonstrated that there is no sensible changing. The proposed method can be used with minerals like pitchblende, since thorium is not present in its composition. The main advantages of the developed methodology are: the minimum sample treatment required, use of diluted acid, high sampling frequency (30 samples h-1), lower sample amounts and possibility of automation of all analytical process.
REFERENCES
1. H. Perkampus, UV–Vis Spectroscopy and its Applications, Springer-Verlag, Berlin, Germany (1992)
2. J. L P. Pavón, B. M. Cordero, J. H. Méndez, R. M. I. Agudo, “Application of Nested-Loop system for simultaneous determination of thorium and uranium by flow injection analysis,” Analytical Chemistry, 61, pp.1789-1791 (1989).
3. P. N. Palei, Analytical Chemistry of Uranium, Ann Arbor-Humphrey Science Publishers, Inc., London, England (1970).
4. S.B. Savvin, “Analytical use of arsenazo III – Determination of thorium, zirconium, uranium and rare earth elements,” Talanta, 8, pp.673-685 (1961).