Performance with Machine Learning
Sarah Wassermann
Université de Liège
Pedro Casas
AIT Austrian Institute of Technology [email protected]
Thibaut Cuvelier
Université de Liège [email protected]Benoit Donnet
Université de Liège [email protected]ABSTRACT
We study the problem of predicting Internet path changes and path performance usingtraceroutemeasurements and machine lear-ning models. Path changes are frequently linked to path inflation and performance degradation, therefore the relevance of the pro-blem. We introduce NETPerfTrace, an Internet Path Tracking sy-stem to forecast path changes and path latency variations. By re-lying on decision trees and using empirical distribution-based in-put features, we show that NETPerfTrace can predict(i)the remai-ning life time of a path before it actually changes and(ii)the num-ber of path changes in a certain time period with relatively high accuracy. Through extensive evaluation, we demonstrate that NET-PerfTrace highly outperforms DTRACK, a previous system with the same prediction targets. NETPerfTrace also offers path perfor-mance forecasting capabilities. In particular, our tool can predict path latency metrics, providing a system which can not only pre-dict path changes, but also forecast their impact in terms of perfor-mance variations. We release NETPerfTrace as open software to the networking community, as well as all evaluation datasets.
CCS CONCEPTS
•Networks→Network performance modeling; • Compu-ting methodologies→Supervised learning by regression; Fe-ature selection;
KEYWORDS
distributed measurements; machine learning;traceroute; M-Lab; DTRACK.
ACM Reference format:
Sarah Wassermann, Pedro Casas, Thibaut Cuvelier, and Benoit Donnet. 2017. NETPerf Trace – Predicting Internet Path Dynamics and Performance with Machine Learning. InProceedings of Big-DAMA ’17, Los Angeles, CA, USA, August 21, 2017,6 pages.
https://doi.org/10.1145/3098593.3098599
Permission to make digital or hard copies of all or part of this work for personal or classroom use is granted without fee provided that copies are not made or distributed for profit or commercial advantage and that copies bear this notice and the full cita-tion on the first page. Copyrights for components of this work owned by others than ACM must be honored. Abstracting with credit is permitted. To copy otherwise, or re-publish, to post on servers or to redistribute to lists, requires prior specific permission and/or a fee. Request permissions from [email protected].
Big-DAMA ’17, August 21, 2017, Los Angeles, CA, USA © 2017 Association for Computing Machinery. ACM ISBN 978-1-4503-5054-9/17/08. . . $15.00 https://doi.org/10.1145/3098593.3098599
The research leading to these results has been partially fun-ded by the Vienna Science and Technology Fund (WWTF) through project ICT15-129, “BigDAMA”.
1
INTRODUCTION
Internet paths change frequently due to inter/intra-domain rou-ting changes, load balancing, and even misconfigurations and failu-res [8]. Some of these changes can seriously disrupt performance, causing longer round-trip times, congestion, or even loss of con-nectivity [5]. For example, Google reports that inter-domain rou-ting changes caused more than 40% of the cases in which clients ex-perienced a latency increase of at least 100 ms [12]. These changes could not only impact the end users Quality of Experience (QoE), but also might turn to be quite costly: Amazon claims that every additional 100 ms of page load time could cost them 1% of their sales, and that a page load slowdown of just one second could turn into a $1.6 billion loss in sales each year. As such, predicting the time when a path is likely to change, as well as how such a change would impact end-to-end latency, becomes a highly relevant pro-blem in practice.
To tackle this challenge, and similar to Cunha et al. [3, 4], we predict the time when a path change would occur by relying on traceroutemeasurements and supervised machine learning pre-diction models. We introduceNETPerfTrace, an Internet Path Tracking system allowing to predict the number of path changes in a cer-tain time slot, to forecast the most likely time when these paths would actually change, as well as to predict their future path la-tency. Extensive evaluations using highly distributedtraceroute measurements from M-Lab show that NETPerfTrace nearly per-fectly predicts(i)the remaining life time of a path (i.e., the time before a path change) in about 30% of the cases,(ii)the exact num-ber of daily path changes in about 70% to 80% of the cases, and(iii) the average RTT of a path in about 50% of the cases. In addition, we show that NETPerfTrace highly outperforms DTRACK [3, 4], a previous system conceived to predict Internet path changes.
NETPerfTrace relies on a standard random forest model for pre-diction, which provides accurate results with very low computati-onal overhead as compared to other evaluated machine learning models; readers may refer to [9] for benchmarking results. We per-form extensive evaluation on the impact of different input features by studying the correlations between the inputs and the prediction
targets, as well as by using feature selection techniques. NETPerf-Trace and the datasets used in this paper are freely available1, ma-king results fully reproducible. We are currently extending our tool DisNETPerf [11] by adding an automatic approach todynamically adapt the sampling rate of a path based on the remaining time until a next path change, similar to [3].
The remainder of this paper is organized as follows: Section 2 briefly reviews the related work. Section 3 describes the main con-cepts behind NETPerfTrace. Section 4 reports prediction results for NETPerfTrace using M-Labtraceroutemeasurements, inclu-ding an evaluation on the impact of different input features, using feature selection techniques. Section 5 reports the results obtai-ned in the comparative evaluation of NETPerfTrace and DTRACK. Section 6 concludes this work.
2
RELATED WORK
There is a very rich literature on usingtraceroutemeasurements to track Internet path dynamics and performance. Since the early work of Paxson on the analysis of end-to-end Internet routing be-havior [8], multiple research efforts have targeted the study of Internet paths at a large scale. Systems such as DisNETPerf [11], iPlane [7], Reversetraceroute[6], and Sibyl [1] are all distribu-ted measurement systems relying ontraceroutemeasurements to track and predict Internet paths performance. DisNETPerf and Reversetracerouteparticularly target the problem of measuring paths from arbitrary selected sources. iPlane and Sibyl both offer a service for predicting the performance of Internet paths, by buil-ding a structural model of the Internet usingtracerouteand op-portunistic measurements.
While the problem of analyzing path changes at the Internet scale has attracted important attention in the past, only few papers have focused on predicting such path changes [3–5, 12], which is the target of this paper. Papers such as [5, 12] study the potential causes leading to Internet path changes, particularly those causing higher latencies [12]. Close to our work, authors in [3, 4] study the problem of predicting path changes using bothtraceroute me-asurements and machine-learning-based predictors. In particular, they develop a model based onk-nearest neighbors to predict both the remaining time of an established path before a change and the number of changes experienced by a path during a certain time period. Our work builds on these papers, using different modeling techniques and different input features for prediction.
This paper is an extension of our early work on path dynamics and performance prediction [10], presenting preliminary results of the techniques described next. A more complete report of the studies conducted in this work is available in [9].
3
PROBLEM STATEMENT
We define a pathPas the connectivity from a sourcesto a desti-nationd. At any timet, pathP(t)is realized by a specific router: this route consists of a specific sequence of links connectingstod. Routerhas an associated initial timet0when it becomes active or
in-place, and a final timetf which corresponds to the time when
Pchanges to another route realization, i.e., when the actual route changes. From now on, we therefore refer to route changes instead
1https://github.com/SAWassermann/NETPerf Trace
of path changes. As such, a pathP(t)can be considered as a sta-tistical time process, composed of a set of time-contiguous routes ri(t0i,t
i
f).ri ∈Pindicates thatri realizes pathP.
We additionally define the duration of a routerasD(r)=tf−t0,
its current life time orroute ageat timetasLr(t)=t−t0, and its
remaining life (i.e., time before a route change) at timetasRr(t)=
tf−t. Finally, we definercP(t)as the total number of route changes
observed so far at timet for pathPandrcPT(t)as the number of
route changes observed so far at timet for pathPin the current time slotT.
Given a newtraceroutemeasurement at timet, the prediction
problem solved by NETPerfTrace includes three prediction targets:
(i)the remaining life time of router, namelybRr(t),(ii)the number
of route changes a pathPexperiences over a specific future time window of lengthT, defined asrcbPT, and(iii)the average RTT that
pathPwill experience in the nexttraceroutemeasurement,
de-noted byavдRTTP(t+ε), whereεrepresents the duration until the
next measurement. The first two targets correspond to path dyn-amics prediction, whereas the third target consists of path perfor-mance forecasting. In practice, whenbRr(t)becomes closer to zero,
we would increase the sampling rate to better monitor the path performance in case of a route change. PredictingrcbPT allows to
dynamically identify which paths are more prone to frequent chan-ges, and thus to better allocate newtraceroutemeasurements.
Based on previous results on route stability [2, 8] and similar to [3], we focus on predicting the number of daily route changes for the next day, i.e.,T =24 hours. At last, predicting the average RTT
that a certain pathP would experience next becomes highly re-levant for dynamic traffic engineering purposes: when combined with the prediction of route changes, it can provide a very powerful approach to forecast those performance-harmful route changes.
In order to predict these three targets, we use a rich set of input features describing the statistical properties of route dynamics and path latency. Table 1 describes these features, separated into three different groups. Note that we compute all these statistical features from thetraceroutemeasurements performed in an observation
periodTl e ar n of the monitored paths for learning purposes. The
first group of features, referred to asFA, includes 11 features
rele-vant to the prediction ofRr(t). These features describe the
statis-tical properties of the route durationD(r)observed for each path P.FAalso includes information about the currently active router
at timet, namely its route ageLr(t). The second group of features,
referred to asFB, includes 14 features relevant to the prediction of
rcPT.FBfeatures take into account the statistical properties ofrcPT.
In addition to that,FBcontains information about the number of
route changes observed for pathPand a binary feature indicating whether a route change occurred forPin the current time slotT. The third group of features, referred to asFC, includes 44 features
relevant to the prediction ofavдRTTP(t+ε).FC features account
for the statistical properties (average, minimum, maximum, and percentiles) of the four RTT metrics reported intraceroute
me-asurements, namely the average, minimum, maximum, and stan-dard deviation of the end-to-end RTT. In addition,FCalso includes
the current value of end-to-end RTT metrics at timet. As we show next, these features are highly correlated to the corresponding pre-diction targets, resulting in a strong forecasting power.
Residual Life TimeRrfeature set (FA) 11 average, minimum, and maximum ofD(ri),∀ri ∈P 3
5-, 10-, 25-, 50-, 75-, 90-, 95-percentiles ofD(ri),∀ri ∈P 7
route age of routerat timetforP 1
# Route Changesr cPT feature set (FB) 14
average, minimum, and maximum ofr cPT inP 3
5-, 10-, 25-, 50-, 75-, 90-, 95-percentiles ofr cPT inP 7
total number of route changes inP 1
total number of route changes inPinT 1 number of route changes inPat timetinT 1 binary indication of a route change inT 1
Path LatencyavдRT TPfeature set (FC) 44 average ofRT Tmetrics inP:mean(avд/max/min/dev RT T) 4 minimum ofRT T metrics inP:min(avд/max/min/dev RT T) 4 maximum ofRT Tmetrics inP:max(avд/max/min/dev RT T) 4
5-, 10-, 25-, 50-, 75-, 90-, 95-percentiles
28 ofRT Tmetrics (avд/max/min/dev RT T) inP
currentRT T metrics (avд/max/min/dev RT T) at timet 4
Table 1: Feature set used by NETPerfTrace.
NETPerfTrace uses random forest (RF) as the underlying pre-diction model. In particular, we select a RF model with 10 trees (RF10). In [9], we present an in-depth benchmark comparing se-veral machine learning models for NETPerfTrace. We based our preference for RF10 on both prediction performance and computa-tional speed; see [9] for full insights.
4
NETPERFTRACE EVALUATION
In this section, we study the performance achieved by NETPerf-Trace. Firstly, we introduce the evaluation dataset and study the correlation among input features and prediction targets. Next, we assess the prediction power of NETPerfTrace by comparing the real and predicted values for the three targets. Finally, we analyze the relevance of the input features in terms of prediction power, and apply feature selection techniques to select the best ones for each target. To avoid biased results, all evaluations in this paper are done on a 10-fold cross-validation basis.
4.1
M-Lab Data Description
For the purpose of this study, we analyze a full week of
Paris-traceroutemeasurements performed through the M-Lab open
Internet measurement initiative2. The M-Lab infrastructure con-sists of a high number of servers distributed globally in multiple provider networks and geographic regions. M-Lab makes all data available, including packet traces and supplementary path measu-rements data. The raw data files are accessible through Google’s BigQuery and Cloud Storage3.
The analyzed dataset corresponds to the first week of January 2016. During this week, we observe more than 450,000 different
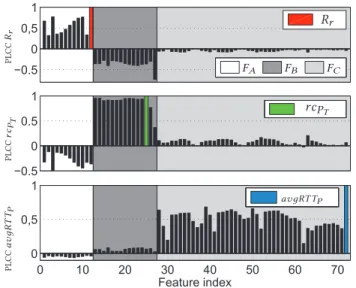
2https://www.measurementlab.net/ 3https://console.cloud.google.com/storage/browser/m-lab/ −0.5 0 0,5 1 0 10 20 30 40 50 60 70 0 0,5 1 Feature index −0.5 0 0.5 1 FA FB FC Rr r cP T avдRT TP P L C C Rr P L C C r cP T P L C C a v д R T TP
Figure 1: Linear correlation between features and prediction targets, for feature setsFA,FB, andFC.
paths, sampled through Paris-traceroutemeasurements from more
than 180 geo-distributed servers. Unfortunately, not all of these paths are periodically sampled during this week, as M-Labtraceroute
measurements are normally triggered as part of other experiments; traces are therefore known to be sporadic. Indeed, when analyzing the number oftraceroutemeasurements for each of these paths,
we found that only 15,725 paths have been sampled more than 10 times, and only 2,346 paths have at least 100traceroute
me-asurements during the analyzed week. We use 100 as threshold to avoid reducing the useful dataset even more, but naturally, the moretraceroutemeasurements or samples we have for a path,
the higher the visibility on potential route changes. Having 100 samples in a week means an average path sampling rate of one
tracerouteevery 100 minutes, which is quite low but still a good
starting point for the different analyses. In fact, the time between
traceroutemeasurements in the resulting dataset is below 14
mi-nutes for more than 50% of the measurements, and for more than 40% of the paths, the sampling rate is above onetracerouteevery
20 minutes. The total number oftraceroutemeasurements in the
resulting filtered dataset is above 550,000. Regarding path topology, the resulting 2,346 paths are issued from 82 different sources, dis-tributed in 33 different ASes, and leading to about 2,000 different destinations in 125 different ASes. These paths traverse more than 260 different ASes, and have an average length of ten hops and four ASes. As such, we believe the used dataset is rich and representa-tive of current Internet paths.
For each of these 2,346 pathsP, we compute the distribution of
the aforementioned input features during an observation period
T
l e ar n =1 week. As we mentioned before, while we use the full
week of measurements to compute the input features for NETPerf-Trace, evaluations are done on a 10-fold cross-validation basis, li-miting potential bias.
0 10 20 30 40 50 60 70 80 90 100 0 10 20 30 40 50 60 70 80 90 100
relative prediction errors (%)
% sa mp le s 0 10 20 30 40 50 60 70 80 90 100 0 10 20 30 40 50 60 70 80 90 100
relative prediction error (%)
% sa mp le s 0 10 20 30 40 50 60 70 80 90 100 0 10 20 30 40 50 60 70 80 90 100
relative prediction error (%)
%
sa
mp
le
s
(a)Rr(t)relative prediction errors. (b)r cPT relative prediction errors. (c)avдRT TPrelative prediction errors.
Figure 2: Relative prediction errors for (a)Rr(t), (b)rcPT(t), and (c)avдRTTP(t), using input feature setsFA,FB, andFC.
4.2
Feature Correlation
Let us start by analyzing the correlations among input features and prediction targets. This would let us perform a first raw selection of features for each prediction target. Figure 1 depicts the Pearson linear correlation coefficients (PLCCs) between the full set of input features and the three prediction targets, discriminated by the
fea-ture setsFA,FB, andFC. The set is extended by adding the three
prediction targets, which are flagged by PLCC = 1 in the
corre-sponding plot. As expected, features from each set present high positive correlation to the corresponding prediction target.
Featu-res from setsFAandFB are inversely correlated to targetsrcPT
andRr, respectively, which is coherent with the fact that more
sta-ble paths with smaller number of changes have longer life times. In addition, there is negligible correlation between path stability
and path performance. Indeed, features from setFC are very
we-akly correlated to targetsRr andrcPT, and features from setsFA
andFB are very weakly correlated toavдRTTP. Based on these
initial observations, we consider each set of featuresFA,FB, and
FC as individual inputs to predictRr,rcPT, andavдRTTPnext. In
Section 4.4, we show that a more careful feature selection can im-prove the performance of NETPerfTrace.
4.3
NETPerf Trace Performance
Figure 2 reports the prediction performance achieved by
NETPerf-Trace using input features setsFA,FB, andFC for predictingRr,
rcPT, andavдRTTP, respectively. Performance is measured in terms
of relative prediction errors (RE), i.e., RE =|Xˆ−X|/X, whereXand
ˆ
X are real and predicted values, respectively. Note that in the case
ofrcPT prediction, we might have time slots for whichrcPT =0.
In-deed, about 25% of the 24-hours time slots correspond to zero route change slots in the studied dataset. Therefore, RE values are
repor-ted separately when it comes to the estimation ofrcPT. A first
ge-neral observation is that predicting bothRr andavдRTTPis more
challenging than predictingrcPT. Indeed, REs are much higher, and
according to Figure 1, PLCCs are much smaller. In particular, and
as already pointed out by previous work [3, 4], predictingRr is
difficult and error-prone.
Figure 2 (a) reports the distribution of the obtained REs forRr(t).
NETPerfTrace correctly predictsRrfor only about 20% of the
sam-ples, and achieves relative errors below 100% for more than 70% of the samples. Results are therefore quite disappointing, but as
we show in Section 5, NETPerfTrace actually highly improves
pre-vious work forRrprediction. Finally, we found that NETPerfTrace
underestimatesRrfor about 40% of the samples, and that prediction
errors tend to be higher for shorter residual life times.
Figure 2 (b) reports the distribution of the obtained REs forrcPT.
Relative prediction errors are small, with about 70% of the non-zero route-change time slots being perfectly predicted and more than 90% of them with relative errors below 50%. The model correctly predicts 38% of the zero route-change slots, achieving an overall perfect prediction for 60% of the samples.
Finally, Figure 2 (c) reports the distribution of the obtained REs
foravдRTTP. In this case, relative prediction errors are almost zero
for about 50% of the samples, and below 30% for almost 90% of
them. Given thatavдRTTPvalues are in general very low – below
130 ms for more than 75% of the samples –, such small relative prediction errors are highly satisfactory.
4.4
Feature Selection
Based on the initial feature correlation results reported in Figure 1,
there is a strong correlation between features of groupFAandFB
for the prediction of bothRr(t)andrcPT. This could be exploited
to improve prediction performance. We therefore explore now the performance of NETPerfTrace when using as input the full set of
69 input featuresFA∪FB∪FC, and perform wrapper-based
fea-ture selection on top of this full set. Wrapper-based selection ranks features based on their prediction power for a specific prediction model. We use RF10 in this case.
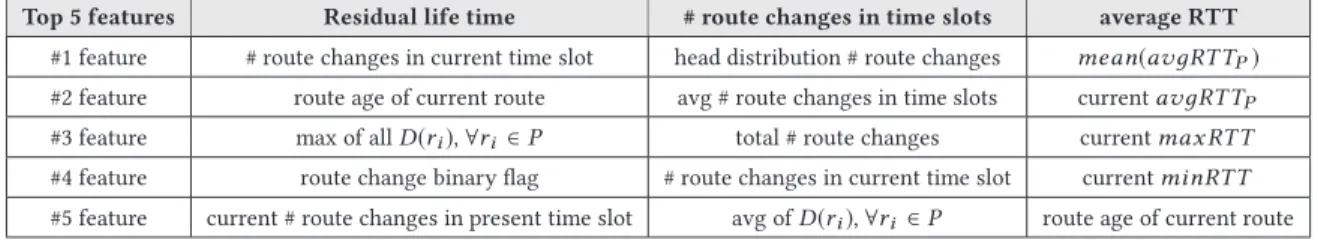
Table 2 reports the top five features selected by wrapper-based selection out of the full set of features – we refer to these as 5/69 features – for the three prediction targets. We can easily spot out that the most important features are not necessarily the ones
inclu-ded in the subsetsFA,FB, andFC. A striking example are the top
five features selected for predictingRr(t): only two out of the five
features were already in the subsetFA. The other three are related
to the number of route changes, included inFB. We can see that
features inFAalso help estimatingrcPT. However, as expected,
fe-atures in setFC play a significant role only for the prediction of
avдRTTP.
To verify the prediction properties of the selected features, we
computed the relative prediction errors forRr(t),rcPT, andavдRTTP
Top 5 features Residual life time # route changes in time slots average RTT
#1 feature # route changes in current time slot head distribution # route changes mean(avдRT TP)
#2 feature route age of current route avg # route changes in time slots currentavдRT TP
#3 feature max of allD(ri),∀ri ∈P total # route changes currentmax RT T
#4 feature route change binary flag # route changes in current time slot currentminRT T
#5 feature current # route changes in present time slot avg ofD(ri),∀ri ∈P route age of current route
Table 2: Feature selection for the three prediction targets when considering all the 69 features.
FB, andFC),(ii)the full set of 69 features, and(iii)the 5/69 features
reported in Table 2.
The performance increase for the prediction ofRr(t)with respect
to the one achieved withFAfeatures is impressive: simply by using
the 5/69 features, we observe a major reduction in the relative pre-diction errors. Indeed, the relative prepre-diction errors are almost zero for about 30% of the samples with 5/69 features (versus 20% with
FA), and below 100% for almost 90% of the samples (about 70% with
FA). Using the full set of 69 features has no significant changes in the relative prediction errors with respect to theFAset.
Regarding the estimation ofrcPT, the 5/69 features do not
pro-vide any relevant improvement with respect toFB features. Ho-wever, in this case, there is a significant improvement when con-sidering the full set of 69 features. The overall perfect prediction performance increases from 60% to more than 80%, and the distri-bution of relative prediction errors shows an important decrease. Still, for the sake of reducing the model complexity and the num-ber of input features, the final release of NETPerfTrace uses the 5/69 features as input.
Finally, and as expected, there are no significant changes in the prediction performance ofavдRTTP when using either the 5/69 or the full set of features. As a general conclusion of the feature selection analysis, the final implementation of NETPerfTrace uses the 5/69 features reported in Table 2 as input for the prediction of the three corresponding targets.
5
NETPERFTRACE VERSUS DTRACK
We now compare the performance of NETPerfTrace with the state of the art, using RF10 as underlying model and the previously se-lected 5/69 features as input. In particular, we compare NETPerf-Trace to DTRACK [3, 4]. DTRACK predicts only path dynamics and not path performance, as its focus is on the prediction ofRr(t) andrcPT. The system uses a Nearest Neighbors (NN)-based model
as underlying prediction model, and takes as input the following four features:(i)route age of router,(ii)prevalence of routerin the current time slotT(i.e., proportion of timeris active),(iii) num-ber of previous occurrences of routerinTfor pathP, and(iv)the total number of route changes inT for pathP, i.e.,rcPT. In [3, 4],
Cunha et al. also evaluate the usage of another prediction model for DTRACK, called RuleFit. However, the model was finally only used for feature selection, as its computational complexity and run-ning time make it inapplicable in an operational deployment. The RF10 model used by NETPerfTrace is extremely fast [9], even faster than the ones tested for DTRACK. Cunha et al. named DTRACK’s underlying algorithm NN4 (detailed in [3, 4, 9]), as it works on top of the four aforementioned features.
0 10 20 30 40 50 60 70 80 90 100 0 10 20 30 40 50 60 70 80 90 100
relative prediction error (%)
% sa mp le s DTRACK NPT−NN5 0 10 20 30 40 50 60 70 80 90 100 relative prediction error (%) 0 10 20 30 40 50 60 70 80 90 100 % sa mp le s DTRACK NPT-NN5
(a) NPT-NN5 vs. DTRACK:Rr(t). (b) NPT-NN5 vs. DTRACK:r cPT. Figure 3: NETPerfTrace-NN5 vs. DTRACK.
The comparison of NETPerfTrace and DTRACK is performed along three distinct dimensions: features, models, and systems. Fir-stly, we compare the input features used by both systems, using a NNXmodel (X =4 for DTRACK andX =5 for NETPerfTrace) and a RF10 model. Secondly, we compare the performance of the un-derlying prediction models, by using NETPerfTrace input features and the two different prediction models – NN5 and RF10. Finally, we directly compare NETPerfTrace and DTRACK systems on the dataset presented in Section 4.1, using their default configurations (i.e., models and input features).
5.1
NETPerf Trace vs. DTRACK: Features
Figure 3 compares the performance of NETPerfTrace and DTRACK using their corresponding input features and NNX as underlying prediction model. Figure 3 (a) reveals only a slight reduction on the relative prediction errors forRr(t)when using NNXwith NETPerf-Trace top 5/69 input features (NPT-NN5) as compared to DTRACK features. Figure 3 (b) shows that the performance improvement is much more relevant when considering the prediction ofrcPT.NPT-NN5 correctly predicts more than 25% of the non-zero-change time slots, while DTRACK does it for only 10%. The overall perfect pre-diction rate for NPT-NN5 rounds 47%, whereas it reduces to only 2% for DTRACK. Repeating the same evaluations by using RF10 as underlying prediction model shows better results for both input fe-ature sets, but without relevant comparative difference. As a first conclusion, the 5/69 features used by NETPerfTrace provide in ge-neral much better results than those used by DTRACK, for both NNX and RF10.
5.2
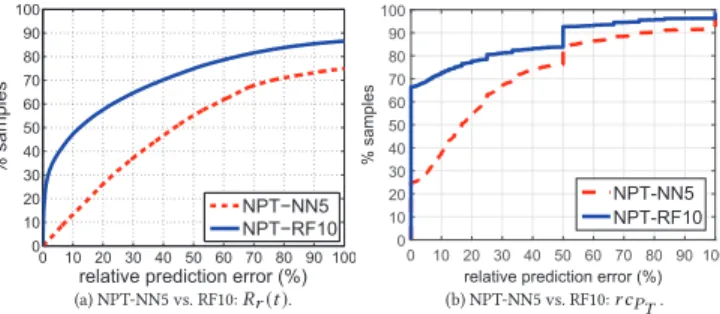
NN5 vs. RF10 with NETPerf Trace
We now compare the prediction power of the two underlying mo-dels used by NETPerfTrace and DTRACK, using as input the 5/69 features used by NETPerfTrace by default. Figure 4 shows a sig-nificant performance improvement when using the RF10 model
0 10 20 30 40 50 60 70 80 90 100 0 10 20 30 40 50 60 70 80 90 100
relative prediction error (%)
% sa mp le s NPT−NN5 NPT−RF10 0 10 20 30 40 50 60 70 80 90 100 relative prediction error (%) 0 10 20 30 40 50 60 70 80 90 100 % sa mp le s NPT-NN5 NPT-RF10 (a) NPT-NN5 vs. RF10:Rr(t). (b) NPT-NN5 vs. RF10:r cPT. Figure 4: NETPerfTrace using NN5 vs. RF10.
as compared to DTRACK’s NN5 model. For example, Figure 4 (a) shows that about 30% of the relative prediction errors are close to 0% when using RF10, whereas almost no zero relative prediction er-rors are observed for NN5. Figure 4 (b) shows that for nearly 70% of the samples, RF10 predicts the correct number of non-zero route changes, which drops to only 25% for NN5. As a second conclusion, the prediction model used by NETPerfTrace clearly outperforms the one used by DTRACK.
5.3
NETPerf Trace vs. DTRACK: Wrap-up
To conclude, we now focus on the performance of both NETPerf-Trace and DTRACK systems using their default configurations in terms of model and input features. Figure 5 shows that NETPerf-Trace largely outperforms DTRACK for predicting path dynamics. According to Figure 5 (a), NETPerfTrace can predictRr(t) with
relative errors below 10% for about 50% of the samples, whereas DTRACK only does so for 10% of the samples. In addition, almost 30% of the predictions with NETPerfTrace yield a relative error close to 0%, whereas almost no zero relative prediction errors are observed for DTRACK. In terms of daily number of route chan-ges, Figure 5 (b) shows that NETPerfTrace correctly predicts al-most 70% of the non-zero route changes, whereas DTRACK cor-rectly forecasts only 10% of the changes. Overall, NETPerfTrace predicts the correct number of route changes for about 65% of the samples (including the zero route changes), whereas DTRACK cor-rectly does so for only 8% of the samples.
As a general conclusion, presented results evidence that NET-PerfTrace largely outperforms DTRACK when forecasting both
Rr(t)andrcPT, by using only one additional feature to tackle both
prediction problems. On the one hand, this is explained by the bet-ter prediction power of the selected features. Note that we have selected specific feature sets for the prediction ofRr(t)andrcPT,
respectively, whereas DTRACK uses the same set of features for predicting both targets. On the other hand, NETPerfTrace relies on a much more powerful prediction model than DTRACK, which greatly contributes to the overall higher accuracy of the system.
6
CONCLUDING REMARKS
We have addressed the problem of predicting Internet path chan-ges and path performance usingtraceroutemeasurements and
machine learning models. We have introduced and evaluated NET-PerfTrace, an Internet Path Tracking system allowing to forecast the remaining life time of a path before it actually changes, the daily number of path changes in the next day, and the average RTT
0 10 20 30 40 50 60 70 80 90 100 0 10 20 30 40 50 60 70 80 90 100
relative prediction error (%)
% sa mp le s DTRACK NETPerfTrace 0 10 20 30 40 50 60 70 80 90 100 0 10 20 30 40 50 60 70 80 90 100
relative prediction error (%)
% sa mp le s DTRACK NETPerfTrace
(a) NPT vs. DTRACK:Rr(t). (b) NPT vs DTRACK:r cPT. Figure 5: NETPerfTrace vs. DTRACK.
of the nexttraceroutemeasurement, with relatively high
accu-racy. By carefully engineering the model behind NETPerfTrace and input features, we have shown that NETPerfTrace highly out-performs DTRACK, a previous system with the same prediction targets. Finally, we have released NETPerfTrace as open software to the community.
REFERENCES
[1] I. Cunha, P. Marchetta, M. Calder, Y. Chiu, B. Schlinker, B. Machado, A. Pescapè, V. Giotsas, H. Madhyastha, and E. Katz-Bassett. 2016. Sibyl: A Practical Internet Route Oracle. InProceedings of the 13th Usenix Conference on Networked Systems Design and Implementation (NSDI’16). USENIX Association, Berkeley, CA, USA, 325–344.
[2] I. Cunha, R. Teixeira, and C. Diot. 2011. Measuring and Characterizing End-to-end Route Dynamics in the Presence of Load Balancing. InProceedings of the 12th International Conference on Passive and Active Measurement (PAM’11). Springer-Verlag, Berlin, Heidelberg, 235–244.
[3] I. Cunha, R. Teixeira, D. Veitch, and C. Diot. 2011. Predicting and Tracking In-ternet Path Changes. InProceedings of the ACM SIGCOMM 2011 Conference (SIG-COMM ’11). ACM, New York, NY, USA, 122–133.
[4] I. Cunha, R. Teixeira, D. Veitch, and C. Diot. 2014. DTRACK: A System to Predict and Track Internet Path Changes.IEEE/ACM Trans. Netw.22, 4 (Aug. 2014), 1025– 1038.
[5] U. Javed, I. Cunha, D. Choffnes, E. Katz-Bassett, T. Anderson, and A. Krishna-murthy. 2013. PoiRoot: Investigating the Root Cause of Interdomain Path
Chan-ges. InProceedings of the ACM SIGCOMM 2013 Conference on SIGCOMM
(SIG-COMM ’13). ACM, New York, NY, USA, 183–194.
[6] E. Katz-Bassett, H. Madhyastha, V. Adhikari, C. Scott, J. Sherry, P. Van Wesep, T. Anderson, and A. Krishnamurthy. 2010. Reverse Traceroute. InProceedings of the 7th USENIX Conference on Networked Systems Design and Implementation (NSDI’10). USENIX Association, Berkeley, CA, USA, 15–15.
[7] H. Madhyastha, T. Isdal, M. Piatek, C. Dixon, T. Anderson, A. Krishnamurthy, and A. Venkataramani. 2006. iPlane: An Information Plane for Distributed Ser-vices. InProceedings of the 7th Symposium on Operating Systems Design and Im-plementation (OSDI ’06). USENIX Association, Berkeley, CA, USA, 367–380. [8] V. Paxson. 1996. End-to-end Routing Behavior in the Internet. InProceedings of
the ACM SIGCOMM 1996 Conference (SIGCOMM ’96). ACM, New York, NY, USA. [9] S. Wassermann, P. Casas, T. Cuvelier, and B. Donnet. 2017. Predicting Internet
Path Dynamics and Performance with Machine Learning. Technical Report. [10] S. Wassermann, P. Casas, and B. Donnet. 2016. Machine Learning based
Pre-diction of Internet Path Dynamics. InProceedings of the CoNEXT Student Works-hop 2016.
[11] S. Wassermann, P. Casas, B. Donnet, G. Leduc, and M. Mellia. 2016. On the Analysis of Internet Paths with DisNETPerf, a Distributed Paths Performance Analyzer. In2016 IEEE 41st Conference on Local Computer Networks Workshops (LCN Workshops). 72–79.
[12] Y. Zhu, B. Helsley, J. Rexford, A. Siganporia, and S. Srinivasan. 2012. LatLong: Di-agnosing Wide-Area Latency Changes for CDNs.IEEE Transactions on Network and Service Management9, 3 (September 2012), 333–345.