Development of Maximum Power Extraction
Algorithms for PV system With Non-Uniform
Solar Irradiances
Dissertation submitted in partial fulfillmentof the requirements of the degree of
Doctor of Philosophy
in
Electrical Engineering
by
Satyajit Mohanty
(Roll No: 512EE1015)
based on research carried out under the supervision of
Prof. Bidyadhar Subudhi
Prof. Pravat Kumar Ray
DEPARTMENT OF ELECTRICAL ENGINEERING NATIONAL INSTITUTE OF TECHNOLOGY ROURKELA
Roll Number : 512EE1015
Name: Satyajit Mohanty
Title of Dissertation: Development of Maximum Power Extraction Algorithms for PV System With Non-Uniform Irradiances
We the below signed, after checking the dissertation mentioned above and the official record book(s) of the student, hereby state our approval of the dissertation submit-ted in partial fulfillment of the requirements of the degree of Doctor of Philosophy in Electrical Engineering at National Institute of Technology Rourkela. We are satisfied with the volume, quality, correctness, and originality of the work.
Prof. S.Karmakar (Member, DSC) Prof. U. C. Pati (Member, DSC) Prof. S.Gopalkrishna (Member, DSC) Prof. P.K Ray (Co-Supervisor) Prof. B. Subudhi (Supervisor) (External Examiner)
Prof. A.K Panda (Chairman,DSC)
CERTIFICATE
This is to certify that the work presented in the dissertation entitled “Development of Maximum Power Extraction Algorithms for PV system with Non-Uniform Solar Irradiances” submitted by Satyajit Mohanty, Roll Number 512EE1015, is a record of original research carried out by him under the supervision and guidance in partial fulfillment of the requirements of the degree of Doctor of Philosophy in Electri-cal Engineering. Neither this dissertation nor any part of it has been submitted earlier for any degree or diploma to any institute or university in India or abroad.
Prof. Pravat Kumar Ray (Co-Supervisor)
Prof. Bidyadhar Subudhi (Supervisor)
I, Satyajit Mohanty, Roll Number 512EE1015 hereby declare that this dissertation entitled “Development of Maximum Power Extraction Algorithms for PV system with Non-Uniform Solar Irradiances” presents my original work carried out as a doctoral student of NIT Rourkela and, to the best of my knowledge, contains no material previously published or written by another person, nor any material pre-sented by me for the award of any degree or diploma of NIT Rourkela or any other institution. Any contribution made to this research by others, with whom I have worked at NIT Rourkela or elsewhere, is explicitly acknowledged in the dissertation. Works of other authors cited in this dissertation have been duly acknowledged under the sections Reference or Bibliography. I have also submitted my original research records to the scrutiny committee for evaluation of my dissertation.
I am fully aware that in case of any non-compliance detected in future, the Senate of NIT Rourkela may withdraw the degree awarded to me on the basis of the present dissertation.
ACKNOWLEDGEMENT
First and foremost, I am truly indebted to my supervisors Prof. Bidyadhar Subudhi and Prof. Pravat Kumar Ray for their guidance and unwavering confidence through my study, without which this thesis would not be in its present form. I also thank them for gracious encouragement throughout the work.
I express my gratitude to the members of Doctoral Scrutiny Committee for their suggestion to improve the work. I am also very much obliged to Head of the Depart-ment of Electrical Engineering, NIT Rourkela for providing possible facilities.
Thanks to Murli,Om prakash, Subhasish, Raja, Soumya and Rajendra and all the research scholars of Electrical Department for their enjoyable and helpful company.
I also want to thank Biraja Sir,Srikant Sir and Alok Sir for their advice and en-couragement at every moment. I also thank Bag Sir & Bhauja, my lovely Angel, Pradosh Bhai & Bhauja, Mrutyunjay Sir and all other SSB Hall roommates in making my stay enjoyable during this Ph.D. duration. I also thanks my friends Debasis, Su-chit, Sameer, Shashi, Swayam, Tapas, Tapaswini, Debashish, Alokesh, Rama, Atulya, Tanmay & Deepalok for their encouragement and support.
My wholehearted gratitude to my beloved family members, Sarat kumar Mohanty & Namita Patnaik, Bijay Mohanty & Krishna Mohanty, my grandmother Late.Renuka Mohanty, my Uncle Late.Babubichitraa Mohanty, my Uncle Sri.Saroj kumar Mohanty, my wife.Sangita Mohanty, Kishan & Bikram, Bhai, Pinku and Monu for keeping faith on me and always shower me with their unconditional love. Thank you for believing in me.
This thesis addresses the problem of extraction of maximum power from PV arrays subjected to non-uniform solar irradiances e.g partial shading. In the past, a number of maximum power point tracking algorithms (MPPTs) such as Perturb & Observe, Hill climbing, Incremental Conductance,etc. have been proposed. These are exten-sively used for obtaining maximum power from a PV module to maximize power yield from PV systems under uniform solar irradiance. However, these techniques have not considered partial shading conditions and the stochastic nature of solar insola-tion. In the event of non-uniform solar insolation, a number multiple maximum power points(MPPs) appear in the power-voltage characteristic of the PV module. In the present thesis, the stochastic nature of the solar insolation is considered to obtain the global MPP of a PV module with a focus on developing global optimization techniques for MPPT that would handle the multiple MPPs. Thus, the thesis will address the above problem by developing a number of global MPPT algorithms.
In this thesis, an extensive review on MPPT algorithms for both uniform and non-uniform insolation levels is presented. Subsequently, an analysis with respect to their merits,demerits and applications have been provided in order to design new MPPTs to achieve higher MPPT efficiency under non-uniform solar irradiances.
Firstly, PV modules are modelled with and without bypass diodes for handling Partial shading conditions(PSCs). Then, a new Ring pattern(RP) configuration has been proposed which is compared with different existing configurations such as Series-parallel(SP),Total cross tied(TCT) and Bridge linked(BL) configurations on the basis
ii
of maximum power and fill factor.
As described earlier, under non-uniform irradiances the MPPT problem boil down to determining the global MPP. Thus, the MPPT problem can be cast as a global optimization problem. It may be noted that evolutionary computing approaches are extensively used for obtaining global optimum solutions. One of the most recent evo-lutionary optimization techniques called grey wolf optimization technique has gained enormous popularity as an efficient global optimization approach. In view of this,Grey wolf optimization is employed to design a global MPPT such that maximum power from PV modules can be extracted which will work under partial shading conditions. Its performance has been compared with two existing MPPTs namely P&O and IPSO based MPPT methods. From the obtained simulation and experimental results, it was found that the GWO based MPPT exhibits superior MPPT performance as compared to both P&O and IPSO MPPTs on the basis of dynamic response, faster convergence to GP and higher tracking efficiency.
Further, in order to scale down the search space of GWO which helps to speed up for achieving convergence towards the GP,a fusion of GWO-MPPT with P&O MPPT for obtaining maximum power from a PV system with different possible patterns is developed. An experimental setup of 600W solar simulator is used in the laboratory having characteristics of generating partial shading situation. Firstly,the developed algorithms were implemented for a PV system using MATLAB/SIMULINK. Subse-quently,the aforesaid experimental setup is used to implement the proposed global MPPT algorithms. From the obtained simulation and experimental results it is ob-served that the Hybrid-MPPT converges to the GP with least time enabling highest possible maximum power from the solar PV system.
In this thesis, analytical modeling of PV modules for handling non-uniform irra-diances is pursued as well as a new RP configuration of PV modules is developed to achieve maximum power and fill factor. In order to extract maximum power from PV panels subjected to non-uniform solar irradiances, two new MPPT algorithms are
developed namely Grey wolf optimization based MPPT(GWO-MPPT) and GWO as-sisted PO(GWO-PO).
Keywords:
PV, MPPT, GWO, DC-DC Boost Converter, Partial Shading Con-ditions.Contents
Abstract i
List of Acronyms viii
List of figures xiii
List of tables xiv
1 Introduction 1
1.1 Photovoltaic Power Generation . . . 1
1.2 Photovoltaic Energy Conversion . . . 2
1.3 Types of PV System . . . 5
1.4 Maximum Power Extraction Algorithms . . . 5
1.5 Partial Shading Conditions . . . 10
1.6 Motivation of the Thesis . . . 14
1.7 Organization of the Thesis . . . 14
2 Literature Review on Maximum Power Extraction Algorithms and Problem Formulation 16 2.1 MPPT for Uniform Insolation . . . 16
2.1.1 Advantages and Disadvantages of Different MPPT Techniques . . . 23
2.2 MPPT for Non-Uniform Insolation levels . . . 28
2.3 Review Remarks . . . 31
2.4 Objectives of the Thesis . . . 32
2.5 Problem Formulation . . . 32
2.6 Chapter Summary . . . 34
3 Development of an Experimental Setup for a PV System subjected to Non-Uniform Solar Irradiances 35 3.1 Introduction . . . 35
3.2 Experimental Setup using Solar Panels . . . 36
3.2.1 Solar Panel . . . 37
3.2.2 DC-DC Boost Converter . . . 38
3.2.3 Hall Effect Sensor . . . 38
3.2.4 DS1104 . . . 38
3.3 Experimental Setup using Agilent Simulator . . . 39
3.3.1 Agilent Solar Array Simulator . . . 40
3.3.2 Solar Array Simulator(SAS) Mode: . . . 41
3.4 Chapter Summary . . . 43
4 Analytical Modeling and Experimental Prediction of Global Peak under Partial Shading of PV modules for a Photovoltaic System 44 4.1 Abstract . . . 44 4.2 Introduction . . . 45 4.3 Chapter Objectives . . . 46 4.4 Modeling of PV System . . . 47 4.4.1 PV Cell Modeling . . . 47 4.4.2 PV Module Modeling . . . 48
4.4.3 Characteristics of PV System under Partial Shading . . . 49
CONTENTS vi
4.5.1 Array composed of n-multiple modules . . . 51
4.5.2 Array composed of partially shaded module without bypass diode 53 4.6 Different possible configurations of PV cells . . . 54
4.6.1 Series-Parallel configuration (SP configuration) . . . 54
4.6.2 Total Cross Tied Configuration (TCT configuration) . . . 56
4.6.3 Bridge Linked Configuration (BL-Configuration) . . . 57
4.6.4 Proposed Ring Pattern Configuration (RP-Configuration) . . . . 59
4.7 Performance Evaluation . . . 60
4.8 Chapter Summary . . . 63
5 A New MPPT Design Using Grey Wolf Optimization Technique for Photovoltaic System Under Partial Shading Conditions 64 5.1 Abstract . . . 64
5.2 Introduction . . . 65
5.3 Chapter Objectives . . . 67
5.4 Characteristics of a PV System under Partial Shading Conditions . . . 68
5.4.1 Basic Characteristics of a PV cell . . . 68
5.4.2 System Description . . . 69
5.5 GWO and its Application in MPPT Design . . . 69
5.5.1 Grey Wolf Optimization . . . 69
5.5.2 Application of GWO for MPP Tracking . . . 73
5.6 Results and Discussion . . . 75
5.6.1 Simulation Results . . . 75
5.6.2 Experimental Results . . . 81
5.7 Chapter Summary . . . 85
6 A Grey Wolf Assisted Perturb & Observe Maximum Power Point Tracking Algorithm for a PV System 86 6.1 Abstract . . . 86
6.2 Introduction . . . 87
6.3 Chapter Objectives . . . 88
6.4 PV System under Partial Shading Conditions . . . 89
6.4.1 PV System Modeling . . . 89
6.4.2 System Description . . . 91
6.5 Problem Formulation . . . 92
6.6 Overview of the Proposed MPPT Method . . . 92
6.6.1 Grey Wolf Optimization (GWO) application to MPPT Design . 92 6.6.2 Perturb and Observe (P&O) MPPT . . . 93
6.6.3 Proposed Hybrid-MPPT . . . 94
6.7 Simulation Case Studies . . . 95
6.7.1 Partial Shading Conditions . . . 97
6.7.2 Rapidly Changing Insolation levels . . . 98
6.7.3 Extreme Rapidly Changing Insolation levels . . . 100
6.8 Experimental Results . . . 102
6.9 Chapter Summary . . . 105
7 Conclusion and Suggestions for Future Work 106 7.1 Overall Summary of the Thesis . . . 106
7.1.1 Contributions of the Thesis . . . 108
7.2 Suggestions for the future work . . . 109
References 110
List of Acronyms
List of Acronyms
PV : Photovoltaic
STC : Standard Test Conditions
MPP : Maximum Power Point
MPPT : Maximum Power Point Tracker
PSCs : Partial Shading Conditions
GP : Global Peak
LP : Local Peak
SP : Series Parallel
TCT : Total Cross Tied
BL : Bridge Linked
RP : Ring Pattern
GWO : Grey Wolf Optimization
4S : Four Series
2S2P : Two Series Two Parallel
3S : Three Series
3S2P : Three Series Two Parallel
PSO : Particle Swarm Optimization
PI : Proportional Integral
P&O : Perturb & Observe
FOCV : Fractional Open Circuit Voltage
FSCI : Fractional Short Circuit Current
RCC : Ripple Correlation Control
OCC : One Cycle Control
FO : Forced Oscillation
FLC : Fuzzy Logic Controller
ANN : Artificial Neural Network
IPSO : Improved Particle Swarm Optimization
GWO-PO : Grey Wolf Optimization-Perturb & Observe
CdTe : Cadmium Telluride
CIGS : Copper Indium Gallium Selenide
CIS : Copper Indium Selenide
PWM : Pulse Width Modulation
List of Figures
1.1 PV growth world scenario [1] . . . 2
1.2 Conversion mechanism of solar light into electricity [2] . . . 3
1.3 Types of Solar Cells [3] . . . 3
1.4 Relationship between cell, module and array [3] . . . 4
1.5 Types of PV system (a) Grid connected, (b) Stand-alone (c) Hybrid . . 6
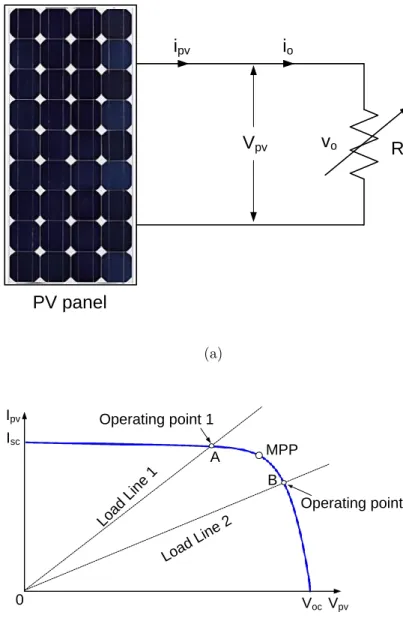
1.6 (a) PV panel with directly connected load and, (b) Operating point of a PV system with direct coupled load . . . 8
1.7 Standalone PV with MPPT . . . 9
1.8 MPPTs under (a) Uniform Insolation, (b) Non-uniform Insolation . . . 9
1.9 P-V characteristics curve exhibiting single MPP under uniform insola-tion level . . . 10
1.10 Possible Shading Scenarios [4] . . . 11
1.11 Effect of Bypass and Blocking diode under PSCs . . . 13
1.12 P-V characteristics curve exhibiting multiple peaks . . . 13
1.13 Hotspot occurrence [5] . . . 14
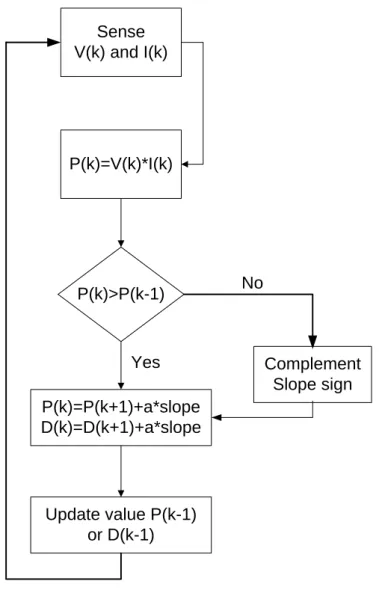
2.1 Flowchart of Perturb & Observe/ Hill Climbing MPPT . . . 17
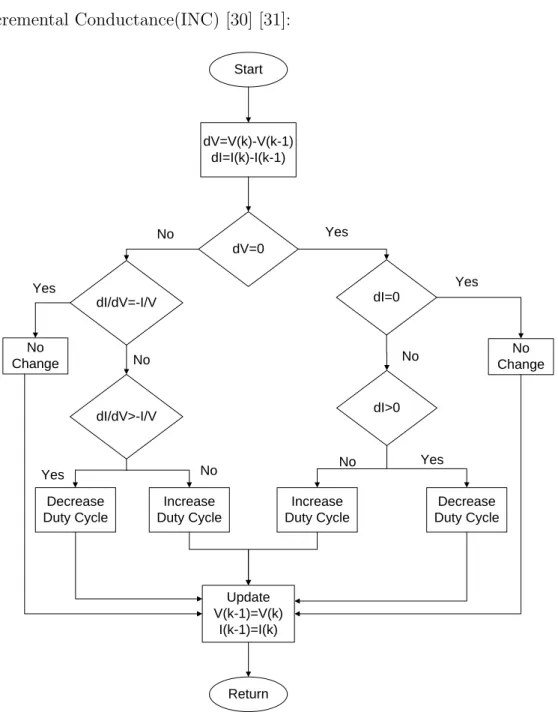
2.2 Flowchart of Incremental Conductance MPPT . . . 18
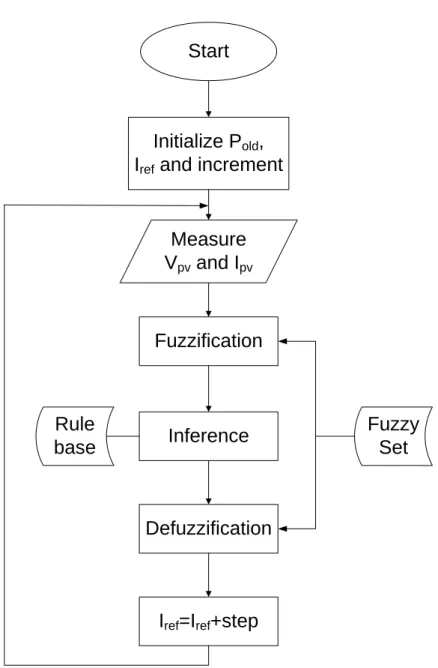
2.3 Flowchart of Fuzzy logic controller MPPT . . . 20
2.4 Classification according to Control Strategies . . . 22
3.1 (a) Block Diagram (b) Photograph of experimental setup with solar
array . . . 36
3.2 Sukam make solar panel . . . 37
3.3 (a) DC-DC Boost Converter (b) Hall Effect Sensor . . . 38
3.4 DS1104 Board . . . 39
3.5 (a) Block Diagram (b) Photograph of experimental setup with simulator 40 3.6 (a)Solar Array Simulator (b) Front view (c) Rear view . . . 42
3.7 (a) SAS Mode (b) Fixed Mode . . . 43
4.1 Equivalent circuit of a PV cell [6] . . . 47
4.2 PV output characteristics of a PV module under normal conditions(a) I-V characteristics, (b) P-V characteristics . . . 49
4.3 Possible shading by cloud on a PV system . . . 50
4.4 P-V characteristics curve with and without Bypass diode . . . 50
4.5 Equivalent circuit of a PV array with n-modules in series . . . 52
4.6 Equivalent circuit of a partially shaded module without bypass diode . 53 4.7 SP configuration . . . 55
4.8 TCT configuration . . . 56
4.9 BL configuration . . . 58
4.10 RP configuration . . . 59
4.11 Solar Array Simulator . . . 61
4.12 Experimental P-V characteristics curve of a PV array(a) SP, (b) TCT, (c) BL, (d) proposed RP configuration . . . 62
5.1 Equivalent circuit of a PV cell [6] . . . 68
5.2 4S configuration under different shading patterns (a) Pattern 1, (b) Pattern 2, (c) P-V curves under PSCs . . . 70
5.3 2S2P configuration under different shading patterns (a) Pattern 3, (b) Pattern 4, (c) P-V curves under PSCs . . . 71
LIST OF FIGURES xii
5.4 Hunting behavior of grey wolves:(A-C) chasing and tracking prey (D)
encicling prey (E) attacking prey . . . 72
5.5 Block diagram of the proposed MPPT method . . . 73
5.6 Flowchart of the proposed algorithm . . . 74
5.7 Tracking curves for 4S Configuration (a) GWO based MPPT (b) IPSO based MPPT (c) P&O based MPPT . . . 77
5.8 Tracking curves for 2S2P Configuration (a) GWO based MPPT (b) IPSO based MPPT (c) P&O based MPPT . . . 78
5.9 Tracking curves for pattern 1 showing response of proposed MPPT hav-ing R and R-L load under PSCs . . . 81
5.10 Experimental results for 4S configuration (a) P-V curves, Tracking curves using (b) GWO (c) IPSO (d) P&O . . . 82
5.11 Experimental results for 2S2P configuration (a) P-V curves, Tracking curves using (b) GWO (c) IPSO (d) P&O . . . 83
5.12 Experimental results for pattern 5 showing response of proposed MPPT under R-L load . . . 84
6.1 Equivalent circuit of a PV cell [7] . . . 89
6.2 (a) 3S Configuration, (b) 3S2P Configuration . . . 90
6.3 P-V curves exhibiting multiple peaks for (a) 3S Configuration, (b) 3S2P Configuration . . . 91
6.4 Movement of a wolf during search process . . . 93
6.5 Flowchart of the Hybrid-MPPT Algorithm . . . 96
6.6 Block diagram of the proposed Hybrid-MPPT Algorithm . . . 97
6.7 Tracking curves for 3S configuration (a) PV power of proposed Hy-brid MPPT compared with other techniques like GWO,PSO+PO based MPPT, (b) zoomed view of Area A . . . 98
6.8 Tracking curves for 3S2P configuration (a) PV power of proposed Hy-brid MPPT compared with other techniques like GWO,PSO+PO based MPPT, (b) zoomed view of Area B . . . 98 6.9 Tracking curves for 3S configuration for rapid changes in insolation . . 99 6.10 Tracking curves for 3S2P configuration for rapid changes in insolation . 99 6.11 Tracking curves for 3S configuration for extreme rapid changes in
inso-lation . . . 100 6.12 Experimental Results for 3S Configuration for extreme rapidly changing
insolation patterns (a) Hybrid-MPPT (b) GWO-MPPT (c) PSO-PO MPPT . . . 103 6.13 Experimental Results for 3S2P Configuration for rapidly changing
List of Tables
1.1 Types of PV Cell [8] . . . 4
2.1 Comparison of different MPPT Techniques . . . 23
4.1 Experimental comparison of peak power and fill factor . . . 63
5.1 Parameters of KC200GT PV module at 250C and 1000W/m2 . . . 76
5.2 Parameters of IPSO and GWO Algorithms . . . 76
5.3 Performance Comparison of the Proposed MPPT with P&O and IPSO MPPTs for 4S Configuration . . . 79
5.4 Performance Comparison of the Proposed MPPT with P&O and IPSO MPPTs for 2S2P Configuration . . . 79
5.5 Qualitative Comparison of the Proposed with P&O and IPSO MPPT Techniques . . . 80
6.1 Performance Evaluation of the proposed MPPT method for 3S and 3S2P Configuration . . . 101
6.2 Characteristics Comparison of the proposed Hybrid MPPT method with other MPPT Methods . . . 102
Introduction
1.1
Photovoltaic Power Generation
With increase in demand and growing prices of fossil fuels together with concern about environmental issues have generated massive interest in the exploitation of renewable energy sources such as solar, wind, hydro, geothermal, etc. for electrical power gener-ation [9].Among the different renewable sources, Photovoltaic (PV) Energy genergener-ation has become increasingly essential as a non-conventional source since it unveils advan-tages such as
• Solar insolation is freely available
• No pollution and waste products
• Low maintenance cost
• Absence of rotating parts
• Generates energy, without the need of long transmission lines
The word photovoltaic is a combination of the two words photo, which means light,and voltaic, which implies the production of electricity. PV technology is con-cerned with generation of electricity from solar irradiance. A solar PV cell is a device
1.2 Photovoltaic Energy Conversion 2
that converts the energy in the sunlight directly into electricity using the photovoltaic effect [10] [11]. Fig.1.1 shows the statistics of world scenario of growth of PV energy.
Global cumulative PV capacity in MW since 1992
M e g a w a tt s
Figure 1.1: PV growth world scenario [1]
1.2
Photovoltaic Energy Conversion
When a photon of light falls on a PV cell [12], it has enough energy to knock an electron loose, allowing it to flow freely as shown in Fig.1.2. Each PV cell has two layers of silicon; namely one is positive and other is negative. When a photon of light is absorbed by one of these atoms in the N-Type silicon it will dislodge an electron, creating a free electron and a hole. The free electron and hole have sufficient energy to jump out of the depletion zone and flow through an external load. The PV cell behaves as a current source [13]. The greater the intensity of the solar insolation, the greater is the generation of current in this PV cell. Usually,a typical PV cell produces 0.5V which is very small,therefore several PV cells are connected in series and parallel according to the requirement of output power. When this PV panel is connected to a load, electrons starts moving in a particular direction, resulting in flow of current through the load.
Figure 1.2: Conversion mechanism of solar light into electricity [2]
(a) Monocrystalline (b) Polycrystalline (c) Thin-film Figure 1.3: Types of Solar Cells [3]
The PV cell can be of three types such as Mono-crystalline, Poly-crystalline and thin-film and is shown in Fig.1.3. These three different PV cells are compared in Table 1.1. PV cells are connected in series and parallel according to the requirement of voltage and current ratings of load. These PV arrays are made by connecting many
1.2 Photovoltaic Energy Conversion 4
PV modules in series and parallel as shown in Fig.1.4. The power output of a PV array depends on the power output of individual PV modules [14]. By choosing appropriate sized and series-parallel combinations of PV modules, PV array of given power rating can be obtained.
Table 1.1: Types of PV Cell [8]
Sl.No Types of
PV Cell
Properties
1 Monocrystalline
Made up of single silicon material. Highly efficient in good weather conditions.
Energy conversion efficiency is 12-15%.
2 Polycrystalline
Made up of small silicon crystals. Efficient in good light conditions. Energy conversion efficiency is 11-14%.
3 Thin-film
Made up of materials like CdTe,CIGS,CIS. Efficient in poor light conditions. Energy conversion efficiency is 6-12%.
Cell
Module
Array
1.3
Types of PV System
Fig.1.5 shows the three different connections of PV system [15].
Grid Connected: It is the most popular type of PV system which is connected to
the local electricity network allowing the surplus amount of the generated solar electric-ity to be sold to the utilelectric-ity. Such systems typically consist of one or more photovoltaic panels, a DC/AC power converter/inverter, racks, and electrical interconnections. Ad-ditionally, such systems could also include maximum power point trackers (MPPT), battery systems and chargers, solar trackers, software for energy management, solar concentrators etc.
Stand-alone: Stand-alone PV systems are designed to operate independent of
the utility grid, and are generally designed and sized to supply certain DC and/or AC electrical loads. An inverter can be used to convert AC power from DC power generated by the PV array of the PV system, enabling the use of normal appliances without mains power.
Hybrid System: The hybrid system is a combination of one or more sources like
photovoltaic (PV) array, wind turbine, and battery storage via a common dc bus to ensure a consistent supply of electricity. A hybrid system can be stand-alone or grid connected PV system [16].
1.4
Maximum Power Extraction Algorithms
The conversion of PV energy into electrical energy is one of the rapidly growing tech-nology across the globe, PV system has some limitations like high installation cost, low energy conversion efficiency and irregularity in power generation due to dependency on environmental changing conditions [17]. As the output characteristic of the PV panel is non-linear,fluctuation in its output power is affected by solar insolation and temperature. Therefore, some maximum power point algorithms are to be developed
1.4 Maximum Power Extraction Algorithms 6 Distribution Panel Inverter PV Array AC Loads Electric Utility (a) DC Load Inverter PV Array AC Loads Charge Controller (b) DC Load Inverter PV Array AC Loads Charge Controller Wind Turbine Generator/ Battery Rectifier Battery (c)
which can extract maximum possible power from PV panels and deliver it to load. Hence, research on MPPT is of great importance for maximizing the power extraction from PV panels [18] [19] [20].
A lot of research has been carried out in the past to improve the efficiency and power quality of PV system [21]. PV systems have low energy conversion efficiency due to their nonlinear and time-varying I-V and P-V characteristics with respect to variation in solar insolation and temperature. Hence, the PV systems need to be operated at their MPPs because at the MPP, a PV panel operates most efficiently as it delivers the maximum power. To track the MPP, a maximum power point tracker (MPPT) [22] [23] is usually used in the PV system.
There exists a single point called MPP (Vmp, Imp) at which output power of a PV
panel is the maximum. When a load is directly connected to the PV panel as shown in Fig.1.6(a), then the operating point of load is defined by the intersection of its I-V characteristics with the load line as in Fig.1.6(b). There are two operating points A and B for two different values ofRL. Powers at these points A and B are definitely less
than the MPP as they are not aligned with MPP. This means that the operating point of PV panel with direct coupled load is defined by the load and maximum possible power is delivered. When load varies, then the operating point of PV system also changes which is undesirable.
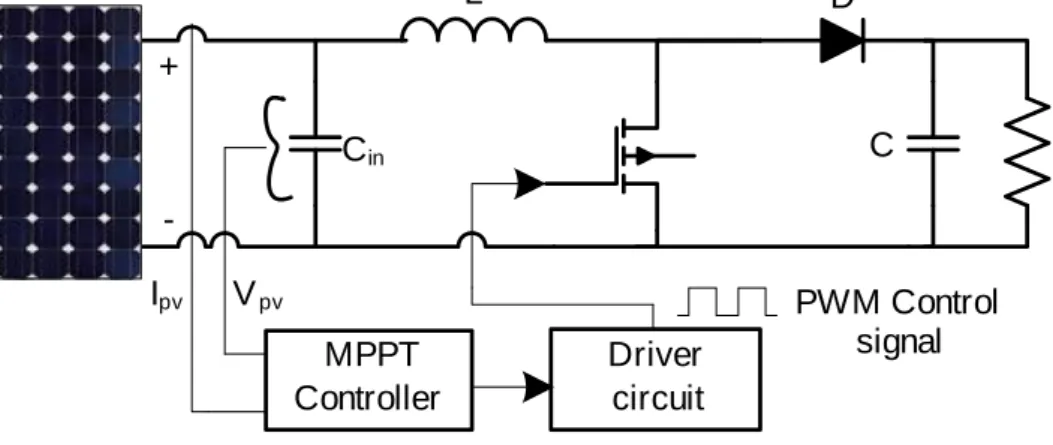
Therefore, a method is to be developed which will move the operating point of the load towards MPP which can be achieved by connecting an intermittent between source and the load i.e. a DC-DC converter along with the MPPT algorithm as shown in Fig.1.7. The MPPT algorithm calculates the reference operating point (Vref) at which
power is maximum and then the DC/DC converter forces the PV system to operate at that reference point. The PV system with MPPT is an efficient system because it changes the operating point along MPP of the PV module and gives maximum power at changing insolation conditions and is shown in Fig.1.7. The behavior of P-V characteristics curve under uniform and non-uniform insolation conditions is shown in
1.4 Maximum Power Extraction Algorithms 8 Vpv vo io ipv RL PV panel (a) Vpv Voc Ipv Isc Operating point 1 Operating point 2 A B MPP Load Lin e 1 Load Line 2 0 (b)
Figure 1.6: (a) PV panel with directly connected load and, (b) Operating point of a PV system with direct coupled load
Fig.1.8. L Cin D R + -MPPT Controller Driver circuit PWM Control signal Vpv Ipv C
Figure 1.7: Standalone PV with MPPT
Ppv Vpv MPP 1 MPP 2 (a) MPP 1 Ppv Vpv MPP 2 (b)
Figure 1.8: MPPTs under (a) Uniform Insolation, (b) Non-uniform Insolation
PV systems with MPPT techniques are used in many applications like water pump-ing, satellite power supply, grid-tied, household appliances etc. throughout the globe.
1.5 Partial Shading Conditions 10
The MPPT efficiency(η) [3] can be calculated as
η= V pv ∗Ipv
IA (1.1)
whereI,Aare the irradiance levels and the area of the cell,Vpv,Ipv are the PV voltage
and current. The quality of the cell is measured by a calculation called Fill Factor(FF). FF can be defined as the ratio of actual maximum power output to the ideal maximum power output. FF can be written as
F F = VmIm
VocIsc
(1.2)
1.5
Partial Shading Conditions
Under uniform irradiance, there exists a single MPP in the Power-Voltage character-istics curve as shown in Fig.1.9.
MPP Ppv
Vpv
Figure 1.9: P-V characteristics curve exhibiting single MPP under uniform insolation level
But such system becomes complicated, when the PV power system receives non-uniform irradiance resulting in partial shading which is an unavoidable complication that significantly reduces the efficiency of the overall system. When one(or many) of
the module in a solar array comes under the effect of shading(which can be due to trees, neighboring buildings, clouds and many more circumstances can be as shown in Fig.1.10), its voltage drops, so, it works as a load instead of working as a generator resulting in multiple peaks with several local and one global peak (GP). Thus, this peaks leads to a great challenge for designing an appropriate MPP tracker [24] [25] for a PV system. A Bypass Diode(BD) is connected to ensure that particular shaded module does not get damaged. Voltage mismatch can occur in parallel connected modules. So, a blocking diode is connected for providing protection under such conditions.
Under Partial shading (when some part of module is under shading), BD starts conducting as shown in Fig.1.11. So, in P-V curve we do not get a single maximum power point (MPP) but receive several local peaks(LP) and one global peak(GP) as shown in Fig.1.12. BD can be uninstalled from the system to simplify the complications of multiple peaks, but as a result power is reduced which significantly increase the cost of solar power generation.
(a) (b)
Figure 1.10: Possible Shading Scenarios [4]
Mismatch loss : Mismatch loss(ML) is a serious problem in PV modules and arrays under some conditions because the output of the entire PV module under worst case conditions is determined by the solar cell with the lowest output. For example, when one solar cell is shaded while the remaining in the module are not, the power being generated by the good solar cells can be dissipated by the
1.5 Partial Shading Conditions 12
lower performance cell rather than powering the load. This in turn can lead to highly localised power dissipation and the resultant local heating may cause irreversible damage to the module. Mismatch in PV modules are mainly of two types:
Internal ML: It occurs due to the variation in PV source parameters of a mod-ule due to changes of its physical conditions.
External ML: It occurs due to change of solar irradiation i.e., partial shading.
M L=P1 −P2 (1.3)
where P1 and P2 are the changes in insolation levels.
The impact and power loss due to mismatch depend on:
• the operating point of the PV module
• the circuit configuration
• the parameter which are different from the remainder of the solar cells
Hotspot situation :Hot-spot occurs in a module when its operating current exceeds the reduced short-circuit current (Isc) of a shadowed or faulty cell or group of cells
as shown in Fig.1.13. When such situation occurs, the affected cell or group of cells is forced into reverse bias and must dissipate power. If the power dissipation is more, the reverse biased cell can overheat resulting in melting of solder and/or silicon and deterioration of the encapsulant and backsheet.
To avoid such situation, a BD is connected in parallel, but with opposite polarity, to a solar cell. Under normal operation, each solar cell will be forward biased and therefore the BD will be reverse biased and will effectively be an open circuit. However, if a solar cell or panel becomes faulty or open-circuited, the BD provides a current path, thereby allowing the current from the good solar cells to flow in
the external circuit rather than forward biasing each good cell. Similarly,if a group of modules connected in parallel to another group or a battery, in order to avoid reverse current flow from one to another, a blocking diode is connected. The importance of bypass and blocking diode in a PV panel/array is clearly shown in Fig.1.11 and its effect on P-V characteristics curve can be seen in Fig.1.12. + -+ + + + -Bypass Diode Blocking Diode Shaded Module
Figure 1.11: Effect of Bypass and Blocking diode under PSCs
GP
LP Ppv
Vpv
1.6 Motivation of the Thesis 14
Hot spot occuring
in a PV module
Figure 1.13: Hotspot occurrence [5]
1.6
Motivation of the Thesis
• P-V characteristics curve under PSCs exhibits multiple peaks i.e the problem is transferred from single global problem into multimodal problem i.e. no. of local minima and one GP.
• The determination of global MPPs depend on the stochastically varying shading pattern, as well as the configuration of the PV modules within a PV array. Global MPPT algorithms should be implemented considering the stochastic nature of changing solar irradiance to track the global MPP.
• Therefore, there is an opportunity to employ an efficient evolutionary computing technique to address the aforementioned optimization problem.
1.7
Organization of the Thesis
• Chapter 2 presents the literature review on maximum power extraction algo-rithms that have been reported in both uniform and non-uniform solar irradia-tion situairradia-tions. Subsequently,the problem formulairradia-tion is highlighted.
• Chapter 3 discusses about the experimental setup used in the subsequent chap-ters for validating the proposed MPPT controller.
• Chapter 4 presents modeling of a PV module with and without BD and also provides detailed analysis of different configurations for finding global peak of PV arrays under PSCs.
• Chapter 5 presents the development of a new maximum power point algorithm in view of tracking the GP under partial shading conditions. The proposed MPPT scheme overcomes the limitations of some of the existing MPPTs such as lower tracking efficiency, steady-state oscillations, and transients as encountered in conventional MPPT techniques.
• Chapter 6 proposes a Hybrid MPPT algorithm which is able to track GP under rapidly changing insolation patterns. The proposed technique is able to scale down the search space of GWO which helps to speed up for achieving faster convergence towards the GP.
• Chapter 7 provides the general conclusion of the thesis together with the contri-butions and scope of future work.
Chapter 2
Literature Review on Maximum
Power Extraction Algorithms and
Problem Formulation
2.1
MPPT for Uniform Insolation
Numerous MPPT techniques are presented in literature such as
1) Curve Fitting Technique [26]:The curve fitting defines an appropriate curve to fit the measured values and uses a curve function to analyze the relationship between the variables.
2) Fractional Short Circuit Current(FSCI) Technique [27]:This method uses the ap-proximately linear relationship between the MPP current (Impp) and the short
circuit current (Isc), which varies with the irradiance and temperature.
Impp ≈KscIsc (2.1)
3) Fractional Open Circuit Voltage(FOCV) Technique [27]:This method uses the ap-proximately linear relationship between the MPP voltage (Vmpp) and the open circuit voltage (Voc), which varies with the irradiance and temperature.
Vmpp ≈KocVoc (2.2)
It is found that the value of Koc varies between 0.78 and 0.92.
4) Perturb & Observe Technique/Hill Climbing Technique [28] [29]:
Sense V(k) and I(k) P(k)=V(k)*I(k) P(k)>P(k-1) P(k)=P(k+1)+a*slope D(k)=D(k+1)+a*slope Update value P(k-1) or D(k-1) Complement Slope sign No Yes
2.1 MPPT for Uniform Insolation 18
Hill-climbing involves a perturbation on the duty cycle of the power converter and P&O a perturbs the operating voltage of the DC link between the PV array and the power converter. The flowchart of P&O and duty cycle control is shown in Fig.2.1. 5) Incremental Conductance(INC) [30] [31]: dV=V(k)-V(k-1) dI=I(k)-I(k-1) dV=0 Decrease Duty Cycle No Yes Start dI=0 dI/dV=-I/V dI/dV>-I/V dI>0 Decrease Duty Cycle Increase Duty Cycle Increase Duty Cycle Update V(k-1)=V(k) I(k-1)=I(k) Return No Change No Change Yes Yes Yes Yes No No No No
The incremental conductance algorithm is based on the fact that the slope of the curve power vs. voltage (current) of the PV module is zero at the MPP, positive (negative) on the left of it and negative (positive) on the right. The flowchart of the Incremental Conductance MPPT is shown in Fig.2.3.
6) Ripple Correlation Control (RCC)Technique [32]:RCC uses the ripple imposed by the power converter on the PV array to track the MPP. It correlates dp/dt with di/dt or dv/dt, to drive the power gradient to zero, which happens when the MPP is reached.
7) Look-up Table Technique [33]:This method requires real time data or data obtained from more accurate model which mimics the behavior of the actual PV module.
8) Steepest Decent MPPT Technique [34]:The MPPT tracking problem considers the maximization of power(P), which can be achieved by dP/dV=0.
9) Differentiation(DF) Technique [35]:This technique determines MPP of a PV system on solving dP dT = d(IV) dT =I dV dT +V dI dT = 0 (2.3)
But, this technique is very difficult because at least eight measurements and calculations are required.
10) One Cycle Control(OCC) Technique [36]:OCC is a nonlinear control technique based on the integration of a switched variable (voltage or current) to force its average value to be equal to some control reference.
11) Forced Oscillation(FO) Technique [37]:This technique is based on injecting a small-signal sinusoidal perturbation into the switching frequency and compar-ing the ac component and the average value of the panel terminal voltage.
12) Linearization(Linr)Based MPPT Technique [38]: Both PV module and converter demonstrate nonlinear and time-variant characteristics,which make the MPPT
2.1 MPPT for Uniform Insolation 20
design difficult. Based on that relationship of voltage and current, a linear approximation of the MPP locus is derived, whose parameters are simply related to those of the electrical parameters of a PV cell.
13) Intelligent MPPT Techniques
(i) Fuzzy Logic(FLC) Based MPPT Technique [39]:
Start
Initialize P
old,
I
refand increment
Measure
V
pvand I
pvFuzzification
Inference
Defuzzification
I
ref=I
ref+step
Fuzzy
Set
Rule
base
In FLC, basic control action is determined by a set of linguistic rules which are determined by the system. Since the numerical variables are converted into linguistic variables, mathematical modeling of the system is not re-quired in FLC. The FLC comprises three parts: fuzzification, rule base table lookup, and defuzzification.
(ii) Artificial Neural Network(ANN)Based MPPT Technique [40]:Neural net-works commonly have three layers: input, hidden,and output layers. The number of nodes in each layer vary and are user-dependent. The input vari-ables can be PV array parameters like Voc and Isc, atmospheric data like irradiance and temperature, or any combination of these.
15) Sliding Mode Controller(SMC) based MPPT Technique [41]:The same concept of INC is used here. The dc/dc converter is designed such that its switching control signal(u) is generated as shown as
u= 1, if h <0 0, if h ≥0 (2.4)
where u=0 implies the converter switch is open otherwise the switch is closed. In this way, the converter is forced to operate at MPP.
14) DC Link Capacitor Droop Control (DLCDC) Technique [42]:DC-link capacitor droop control is a MPPT technique that is specifically designed to work with a PV system that is connected in parallel with an ac system line.
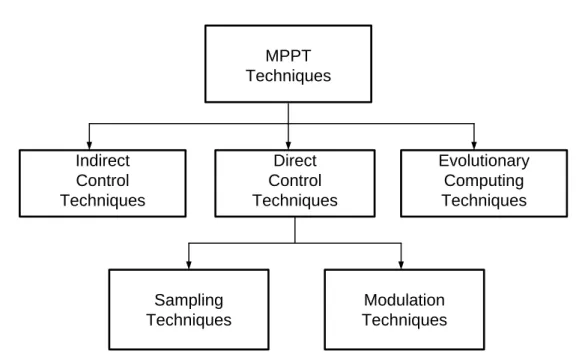
It is very difficult to analyze all of these MPPT techniques by studying their struc-tures,because each MPPT technique has its own pros and cons. Control strategies adapted are one of the ways to analyze the MPPTs which can be classified as indirect control, direct control and evolutionary computational methods.
2.1 MPPT for Uniform Insolation 22 MPPT Techniques Indirect Control Techniques Direct Control Techniques Evolutionary Computing Techniques Sampling Techniques Modulation Techniques
Figure 2.4: Classification according to Control Strategies
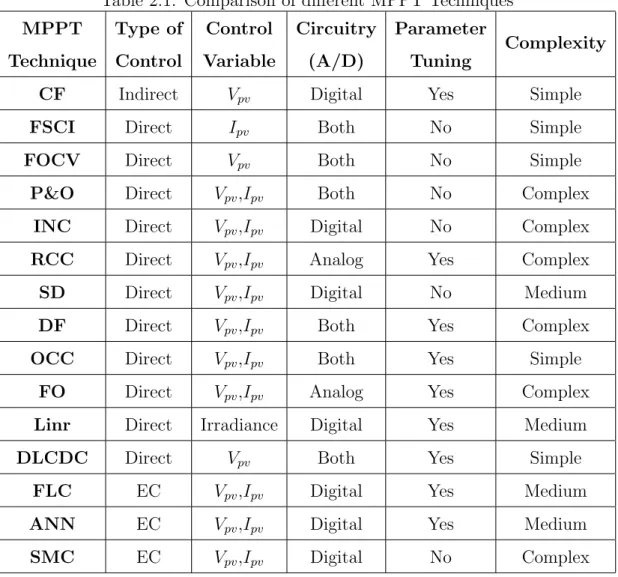
Indirect control techniques are based on use of a database that includes parameters and data such as characteristics curves of the PV panel for different irradiance and temperature or on using some mathematical empirical formula to estimate MPP. Di-rect control strategies can seek MPP diDi-rectly by taking the variations of the PV panel operating points without any prior knowledge of the PV panel parameters. MPPT schemes can be further classified into two types based on, sampling methods and mod-ulation methods. In sampling methods, at each sampling instant, past and previous information Vpv and Ipv are captured which are used to track the MPP location. In modulation methods, the MPP can be tracked by generating oscillations automatically by the feedback control. Fuzzy logic inference and artificial neural network methods do not necessiate exact mathematical model of a system to evaluate which still pro-vide necessary decision outputs and can handle nonlinearities. A broad classification of MPPT control techniques is presented in Fig.2.4. Further, a comparison of different MPPT techniques according to the classification is also provided in Table 2.1.
Table 2.1: Comparison of different MPPT Techniques MPPT Technique Type of Control Control Variable Circuitry (A/D) Parameter Tuning Complexity
CF Indirect Vpv Digital Yes Simple
FSCI Direct Ipv Both No Simple
FOCV Direct Vpv Both No Simple
P&O Direct Vpv,Ipv Both No Complex
INC Direct Vpv,Ipv Digital No Complex
RCC Direct Vpv,Ipv Analog Yes Complex
SD Direct Vpv,Ipv Digital No Medium
DF Direct Vpv,Ipv Both Yes Complex
OCC Direct Vpv,Ipv Both Yes Simple
FO Direct Vpv,Ipv Analog Yes Complex
Linr Direct Irradiance Digital Yes Medium
DLCDC Direct Vpv Both Yes Simple
FLC EC Vpv,Ipv Digital Yes Medium
ANN EC Vpv,Ipv Digital Yes Medium
SMC EC Vpv,Ipv Digital No Complex
2.1.1
Advantages and Disadvantages of Different MPPT
Techniques
Curve-Fitting Technique: Advantages:
• Cost effective and simple
• No sensors required for measurement of voltage and current during MPP track-ing.
2.1 MPPT for Uniform Insolation 24
Disadvantages:
• Requires accurate information of the PV system.
• Not universal.
FOCV and FSCI Techniques: Advantages:
• Simple and inexpensive.
Disadvantages:
• Not suitable for environmental changing conditions.
Perturb & Observe: Advantages:
• Easy to implement and produce accurate results.
• Tracks maximum power under uniform insolation
Disadvantages:
• Accuracy is dependent on the size of perturbation.
• Output voltage and current of PV panel oscillates at steady state.
Incremental Conductance: Advantages:
• Efficiency is same as P&O.
• Good yield under rapidly changing atmospheric conditions.
Disadvantages:
• Sensors are needed to complete MPPT action.
Ripple Correlation Control(RCC)Technique: Advantages:
• Artificial perturbation is not required as it is inherited by DC/DC converter.
• Accurate result for a wide range.
Disadvantages:
• Very complex.
• Time consuming technique.
Steepest Decent MPPT Technique: Advantages:
• Fast MPPT performance.
• Less complex than that of Gauss-Newton because double derivative terms not present in algorithm.
Disadvantages:
• Accuracy, speed and stability are dependent on initial conditions and perturba-tion step-size.
Differentiation(DF) Technique: Advantages:
• Fast MPP tracking.
Disadvantages:
2.1 MPPT for Uniform Insolation 26
One Cycle Control(OCC) Technique: Advantages:
• Constant switching frequency operating mode.
• Does not require any digital signal processors or multipliers.
Disadvantages:
• MPPT tracking performance is not good at changing weather conditions.
Forced Oscillation(FO)Technique: Advantages: • Adaptive in nature. • Easy to implement. Disadvantages: • Difficult to control.
• Variable operating frequency and related complex filters.
Linearization(Linr)Based MPPT Technique: Advantages:
• MPP estimated through a set of simple linear equations.
Disadvantages:
• Limited range of operating conditions.
DC Link Capacitor Droop Control (DLCDC) Technique: Advantages:
Disadvantages:
• Needs a DC-link.
• Limited applications.
FLC Based MPPT Technique: Advantages:
• Fast response, no overshoot and less steady state error.
Disadvantages:
• Rules based technique.
ANN Based MPPT Technique: Advantages:
• On-line tracking is possible.
• Accurate and fast once it is tuned.
• Independent of environmental conditions.
Disadvantages:
• Tuning and MPP calculation takes large time.
Sliding-Mode Based MPPT Technique: Advantages:
• Simple control laws and fast MPP tracking.
• Guaranteed stability.
Disadvantages:
• Applicable to limited range, tuning takes large time.
2.2 MPPT for Non-Uniform Insolation levels 28
2.2
MPPT for Non-Uniform Insolation levels
When one (or many) of the module in a solar array gets shaded due to some inter-mittent between sun and the PV arrays like trees, neighboring buildings, clouds and many other circumstances. Such situation results in voltage drops, resulting to act as a load instead of a generator. Unfortunately, the power-voltage characteristic curve of the PV array becomes complicated resulting in multiple peaks i.e. various local peaks and one global peak. Owing to the occurrence of multiple local peaks i.e. MPPs,the conventional MPPTs are not appropriate in providing maximum power tracking. Be-cause Partial Shading Conditions(PSCs) frequently occur due to passing clouds,trees, or buildings, it is necessary to develop different MPPT schemes that can track global peak(GP) under PSCs. The mismatch occurrence of non-uniform irradiance which leads to decrease of the output power, even generates hot-spot and causes damage to those cells. Such situations can be avoided by using bypass and blocking diodes. While some techniques have been proposed in [43] [44] such as MPPT that work well under partially shaded conditions but many of these suffer from limitations such as lower tracking efficiency and oscillations in the output power. Since the dynamics of the PV system under partial shading is time-varying, MPPT design for PV power system should possess following features: global MPP tracking ability for different conditions (shade, degradation, fault, etc.), adaptability to P-V characteristics change of PV array, smooth and steady MPPT algorithms [45] [46] [47].
As the partial shading is difficult to handle, their is a need for finding an appropriate MPPT technique which could locate the global MPP(GMPP) under any mismatching conditions [48] [49] [50]. Patel et al. [7] presented about I-V and P-V characteristics of a PV array under non-uniform insolation due to partial shading which results in multiple peaks.Some critical observations [50] such as the peaks on the PV curve occurring nearly at multiples of 80% of open-circuit voltage of the module and the minimum displacement between successive peaks being nearly 80% of Voc of the module are
presented.In [51], the proposed algorithm incorporates an online current measurement and periodic interruptions to address problems related to shading conditions. In [48] and [49], global MPPT techniques based on the measurements of the PV array open-circuit voltage and short-open-circuit current is discussed. In [52] [53], relationship between the load line and the MPP locus is discussed for a fast converging MPPT algorithm. A control loop is introduced in [52] to ensure the PV system operates in accordance with the MPP resulting in reduction of MPP search time.
Many researchers have worked on Real MPPT(RMPPT) under PSCs [54] [55] [56] [45] [46] [47] [43] [44]. The real MPPT method [57] first detects the variations in the PV voltage and current to identify the occurrence of partial shading. Then, the operating point is changed according to a predetermined linear function and then the conventional MPPT is applied to track the real MPP. In [54], a two-stage MPPT com-bined with the instant on-line measurement of Voc and Isc was proposed. In [55] [56],
authors have discussed about the relationship between changing weather conditions i.e. array configuration, irradiance and module temperature and output power of the PV array and further complications due to multiple peaks. The authors have shown experimentally about the behaviour of MPPT under the uniform and non-uniform irradiance conditions. A new method to track the GMPP of PV array under PSC is reported by controlling converter voltage by using improved P&O [58] [59]. In [60], an adaptive MPPT (AMPPT) scheme is developed which proved to track the global MPP effectively, fast and smoothly. In [61], the MPPT algorithm is developed using a Fibonacci sequence which does not provide accurate GMPP. Also, different possi-ble ways of modeling under partial shading and different orientation of photovoltaic modules are discussed in [62] [63]. Experimental study of shading hazards in the IV characteristic of a photovoltaic module is discussed in [64]. In [65], modeling the reverse characteristics of PV cells is discussed.
A few improved IC algorithms were also proposed to improve the MPP tracking capability during fast changing irradiance level and load [66] [66]. In [66], a new
2.2 MPPT for Non-Uniform Insolation levels 30
duty cycle control is proposed to track GMPP which eliminates the use of sensor circuits at the output of dc-dc converter. In [66], a method is proposed which responds accurately during increase in insolation level resulting in zero oscillation and introduces new tracking steps to detect the change in insolation level. To achieve a fast MPP tracking response, a simple trigonometric rule has been presented in [67] to establish relationship between the load line and I-V curve. The method eliminates need of an extra control loop and intermittent disconnection which provides fast convergence towards the MPP. An analytical modeling of PV system under PSC is discussed in [68] where a multidimensional PV array configuration correlating to different degrees of partial shading is presented. This model is able to emulate the behavior of different patterns of a PV system during both uniform and non-uniform insolation levels through the multidimensional PV structure. A dynamic MPPT controller for PV systems under fast varying insolation and PSCs is proposed in [69] which uses a scanning technique to determine the maximum power deliver capacity of the panel at a given operating condition.
Currently, a number of evolutionary computing techniques such as particle swarm optimization (PSO) [70] [71] [72], firefly [73],ant colony [74],cuckoo search [75] are of great interest for developing MPPT techniques to track the GP under PSCs. In [70],an improved maximum power point tracking (MPPT) method for the photovoltaic(PV) system using a modified particle swarm optimization (PSO) algorithm is discussed which reduces the steady state oscillation (to practically zero) once the maximum power point (MPP) is located. In [70] [71] [72], a new technique is proposed which replaces the PI control loop with direct duty cycle control method which makes the system more simpler. A new technique is discussed in [73] having advantages like simple computational steps,faster convergence and implementation on a inexpensive microcontroller. In [74], a new control scheme is proposed which ensures the ability to find the global MPP, but also gives a simpler control scheme and lower system cost. A cuckoo search [75] based MPPT is found to be advantageous in terms of
faster convergence, higher efficiency is proposed which outlines the concept of cuckoo search by highlighting the significance of the levy flight by influencing the algorithm’s convergence.
Also, different hybrid MPPT techniques are developed which is a fusion of two techniques which guarantees to achieve faster convergence are discussed in [76] [77] [78] [79]. A highly efficient MPPT having high speed tracking by means of a fast estimate of the maximum power voltages of the PV modules and of the inverter is discussed in [76]. The combination of two basic techniques i.e. P&O and Fractional Open Circuit Voltage (FOCV) technique is discussed to overcome the inherited deficiencies found in P&O technique in [77]. In [78],a hybrid approach is discussed having the global search ability of ant-colony optimization (ACO) and local search capability of P&O method to yield faster and efficient convergence. The integration of swarm intelligence with P&O algorithm is discussed in [79] to yield faster convergence to the global peak(GP). Here,the methodology has been first simulated in two different PV configurations under varying shading patterns and experimentally verified using a microcontroller based experimental system.
2.3
Review Remarks
• Most of the MPPT algorithms reported in the literature is discussed in Section2.1 considering uniform solar irradiances. Also, different MPPT algorithms which can handle non-uniform solar irradiances are discussed in Section2.2.
• In order to handle conditions such as fast weather variations of PV module and partial shading where multiple peaks occur in the P-V characteristics curve, there a challenge lies to develop global MPPTs in order to extract maximum power from PV arrays under the above non-uniform solar irradiances.
2.4 Objectives of the Thesis 32
but they do not consider the stochastic nature of solar irradiance and also a lot of voltage and current ripples are observed in the PV output power.
2.4
Objectives of the Thesis
• To model PV modules analytically under partial shading conditions for a Pho-tovoltaic(PV) power system.
• To develop MPPT control algorithms in order to extract maximum power output from the PV system with changing insolation levels, temperature variations and other environmental conditions.
• To develop MPPT algorithms for a PV system under different shading conditions i.e. partial shading, complete shading, inter row shading situations.
• To develop MPPT algorithms for rapidly changing insolation levels for a PV system.
• To propose new adaptive controllers for MPPT considering the uncertainties of the PV system dynamics due to changing solar irradiance at different weather conditions.
• To simulate the proposed MPPT algorithms in MATLAB/SIMULINK and val-idate using an Experimental set-up.
• To evaluate the efficacy of the proposed MPPT algorithms.
2.5
Problem Formulation
Consider the power-voltage characteristics of a PV array which is subjected to different shading conditions which are more complex in the multiple local MPPs and only one global MPP. Thus,this situation is much different than the case of uniform solar
irradiances, where there is only one MPP. In view of this, there is a need of determining the global MPP. The GMPPT algorithm should be able to develop which will locate the global MPP by using different optimization techniques for maximizing the power extraction from a PV array under non-uniform solar irradiances.
L Cin D R + -MPPT Controller Driver circuit PWM Control signal Vpv Ipv C
Figure 2.5: A PV system with MPPT
Fig.2.5 shows a proposed topology of MPPT scheme in which Grepresents irradi-ance level in W/m2,T is absolute temperature in degree Kelvin,V
pv andIpv are voltage
and current of PV arrays respectively. Thus, the MPPT control problem in case of non-uniform solar irradiance turns out as a global optimization problem resulting in a global MPPT algorithms.
The objective here is to maximize the power extraction from the PV arrays under PSCs. The optimization problem can be stated as follows. Let a solution vector of duty cycles with Np wolves is given by:
xik =dg = [d1, d2, ...., dj] (2.5)
2.6 Chapter Summary 34
The objective function is defined as
P(dki) > P(dki−1) (2.6)
where P= V ∗I for any instant is the operating power of PV array for the tracking problem.
2.6
Chapter Summary
This chapter provides a comprehensive review of MPPT algorithms for both uniform and non-uniform solar irradiances. Although a vast literature is available on MPPTs for uniform solar irradiances but very few algorithms are reported on MPPTs to work under non-uniform solar irradiances. The conventional MPPT algorithms such as P&O and Incremental Conductance etc. are not appropriate to provide maximum power extraction from PV arrays under PSCs due to presence of multiple peaks ap-pearing around the Power-Voltage characteristics curve. Hence, Global optimization techniques are to be developed for MPPT that would handle the multiple MPPs for stochastically varying solar irradiance.
Development of an Experimental
Setup for a PV System subjected
to Non-Uniform Solar Irradiances
3.1
Introduction
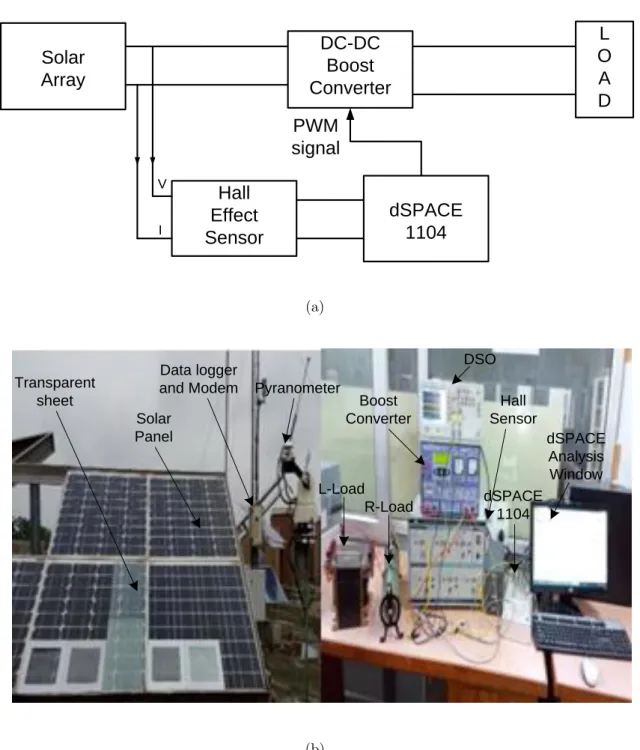
This chapter presents the development of an experimental setup to experiment the per-formance of newly developed MPPTs for handling partial shading conditions. Here, two different methodologies are discussed in this chapter. One is by using solar pan-els which depends on insolation which comes directly from the sun and the other is by using solar simulator in order to provide a controllable indoor test facility un-der laboratory conditions. This chapter addresses the development of experimental setup for verifying the proposed techniques implemented in a PV system using MAT-LAB/SIMULINK software. The selection of the hardware configuration such as sen-sors, controller platform, DSO and loads used in the experimentation are discussed here. This chapter helps to implement the developed control algorithms presented in subsequent chapters.
3.2 Experimental Setup using Solar Panels 36
3.2
Experimental Setup using Solar Panels
Solar Array DC-DC Boost Converter Hall Effect Sensor dSPACE 1104 L O A D PWM signal I V (a) R-Load L-Load Transparent sheet Solar Panel Pyranometer dSPACE Analysis Window dSPACE 1104 DSO Hall Sensor Data logger and Modem Boost Converter (b)
To validate the effectiveness of the proposed GWO based MPPT, experiments were carried out on real PV array for both 4S and 2S2P configurations. To create partial shading, transparent sheets of different shapes were placed on PV modules. Fig.3.1 shows the block diagram and experimental setup of the proposed system.
3.2.1
Solar Panel
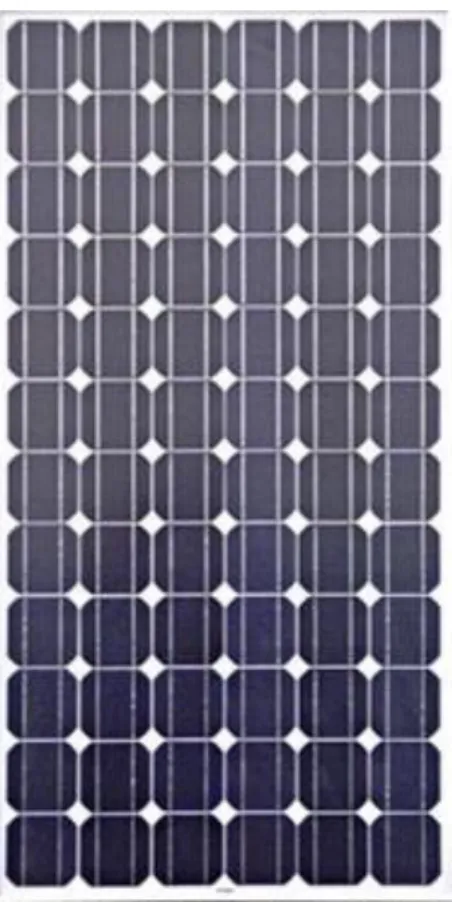
The solar panel used in the experimentation is of Sukam make having rating of each panel as power tolerance=5%, Vmp =17.15V, Imp=2.33A, Voc =21.2V, Isc=2.55A,
KI(V /0C)=-2, KI(mA/0C)=4.7, KV(mV /0C)=-2, KP(%/0C)=-0.4, maximum
sys-tem voltage=600V andns=36 respectively. The photograph of solar panel is shown in Fig.3.2.
3.2 Experimental Setup using Solar Panels 38
3.2.2
DC-DC Boost Converter
The DC-DC boost converter used in the experiment is IGBT(Model no:SKM75)driven and the components for the designed converter used in experimental set up are chosen asfs=25kHz, Output voltage ripple= ∆V0/V0,L=10mH,C=33µF,Vin=(0-130)V and Vout =300V. The photograph of DC-DC Boost converter is shown in Fig.3.3(a).
3.2.3
Hall Effect Sensor
The photograph of hall effect sensor having three voltage and current sensors is shown in Fig.3.3(b). Hall effect sensor is used to sense the voltage and current of the PV array before sending it to the controller.
(a) (b)
Figure 3.3: (a) DC-DC Boost Converter (b) Hall Effect Sensor
3.2.4
DS1104
The DS1104 R&D Controller Board upgrades a PC for rapid control prototyping. The board can be installed virtually in any PC with a PCI slot. It is fully programmable from the SIMULINK block diagram environment and all I/O can be configured graph-ically. Here, DS1104 is used as a controller having various 8-ADC and 8-DAC channels
to generate PWM signals which are based on 603 power PC floating point processor running at 250MHz and a slave DSP subsystem based on TMS320F240 DSP. In the experimentation, the Slave I/O ports as well as the ADC channels are used. The ADC signal senses the voltage and current from the sensors and supply the values after multiplication of scaling factor to the SIMULINK environment and then the PWM signals are generated. The photograph of the DS1104 board is shown in Fig.3.4.
Figure 3.4: DS1104 Board
3.3
Experimental Setup using Agilent Simulator
The block diagram and experimental set up is shown in Fig.3.5. A solar array simu-lator (SAS), Agilent (E4360A) is used to emulate the PV source power with various situations such as rapidly changing solar insolation. It is a current source with 600W dc output source in which it is possible to generate I-V and P-V curves of PV arrays under shading conditions. The chosen I-V curve is conveniently generated using the Table mode which is fast and accurate for generating different I-V curves for partial shading conditions. dSPACE 1104 is used for implementing MPPT algorithm having 8-ADC and 8-DAC channels to produce PWM signals which is based on a 603 power PC floating point processor and a slave DSP subsystem. A Hall sensor (PEC16DSMO1) is used to sense the voltage and current of the solar simulator and a DC-DC boost converter is used as an intermittent between the source and load to extract maximum possible power.
3.3 Experimental Setup using Agilent Simulator 40
Agilent
Simulator
DC-DC
Boost
Converter
Hall
Effect
Sensor
dSPACE
1104
L
O
A
D
PWM
signal
I V (a) Load dSPACE Analysis Window dSPACE 1104 DSO Hall Sensor Boost Converter Agilent Simulator (E4360A) Window for Agilent Simulator (b)Figure 3.5: (a) Block Diagram (b) Photograph of experimental setup with simulator
3.3.1
Agilent Solar Array Simulator
The Agilent E4360 Modular Solar Array Simulator (SAS)is a dual output programmable dc power source that simulates the output characteristics of a solar array as shown in
Fig.3.6. The E4360 SAS is primarily a current source with very low output capacitance and is capable of quickly simulating the I-V curve of different arrays under different conditions (ex. temperature, age etc.). It provides up to 2 outputs and up to 1200W in a small 2U-high mainframe. The dynamic properties of a solar array simulator are:
1. Consists of 2 outputs of 600W per output in 2U of rack space.
2. Perform remote programming via GPIB, LAN and USB interfaces with SCPI command set (drivers available).
3. Program I-V curves from the front panel without a need for a controller.
3.3.1.1 Multiple Simulation Modes
The E4360 SAS provides three operating modes, Simulator,Table and Fixed modes. To accurately simulate the I-V cure of a solar array, use simulation or table modes. When a standard power supply is needed,use fixed mode.
3.3.2
Solar Array Simulator(SAS) Mode:
In SAS mode,the output has an I-V characteristics that follows an exponential model of a solar array as shown in Fig.3.7(a). The E4360 SAS internally generates a 4,096 I-V point table. An internal algorithm is used to approximate an I-V curve. This can be done via the I/O interfaces or from the front panel where a PC is not needed.
3.3.2.1 Table Mode:
The SAS mode provides a Table mode for a fast and accurate I-V simulation of solar arrays. In this mode,a table of I-V oints specifies the curve. Tables are allocated in a non-volatile memory and can be easily stored and recalled. A table can have a minimum of 3 points, up to a maximum of 4000 I-V points.
3.3 Experimental Setup using Agilent Simulator 42 (a) On/Off switch and LED System keys Numeric keys Display Navigation keys Output keys (b) 5-pin Output connector 5-pin Analog
connector Chassisground Fuse 3-pin IEC 320 AC input connector LAN connector USB connector GPIB connector 8-pin digital connector (c)
3.3.2.2 Fixed Mode:
This is the default mode when the unit is powered on. The unit has the rectangular I-V characteristics of a standard power supply as shown in Fig.3.7(b). It has excellent high speed constant current characteristics and low output capacitance. The main usage of fixed mode is while calibrating or verifying any instrument.
Vmp Voc Imp Isc I V Pmax (a) Vrated Irated I V Pmax (b)
Figure 3.7: (a) SAS Mode (b) Fixed Mode
3.4
Chapter Summary
To verify the different MPPT control algorithms for maximum power extraction for a PV system subjected to partial shading conditions is necessary. So in this chapter details of development of experimental facility for the above is presented in details for verifying the algorithms in subsequent chapters.
Chapter 4
Analytical Modeling and
Experimental Prediction of Global
Peak under Partial Shading of PV
modules for a Photovoltaic System
4.1
Abstract
Partial shading is a commonly encountered issue in a PV system. Analytical modeling of a photovoltaic (PV) system for studying the effects of partial shading with and with-out bypass diode as well as different orientation of PV modules is discussed here. In this work a new RP configuration is proposed and compared with Series Parallel(SP), Total cross tied(TCT), Bridge linked(BL) and examined under same shading pattern on the basis of maximum power and fill factor. Those models are studied and their performances were compared on the basis of global peak under partial shading condi-tions(PSCs). Each network connection was analyzed taking care of the non-linearity of the PV cell which is evaluated by using Kirchhoffs voltage and current laws. The
simulation and experimental study conclude that the proposed RP configuration ex-hibits superior performance over SP, TCT and BL configurations in terms of maximum power and fill factor.
4.2
Introduction
Operation of photovoltaic (PV) power generators is greatly influenced by environmen-tal conditions such as solar insolation and temperature [80]. Under uniform irradiance conditions, the electrical characteristics such as I-V and P-V characteristics of the PV generators have only one single MPP (maximum power point) at which the maximum power can be extracted by employing a suitable MPPT algorithm.However,under non-uniform irradiance conditions, such as partial shading, the P-V characteristics curve generates multiple MPPs in the electrical characteristics of PV generators. Partial shading conditions can have a significant effect on the PV panel operation and in turn on the energy yield of the PV generators [81] [82].Partial shading may arise due to snow, tree shadow, dirt or ageing.
Partial shading causes mismatch losses resulting in degradation of performances of the PV cells [83]. Not only the power of the shaded cells reduces, but the unshaded cells also get affected due to electrical connection exist with the shaded ones. Such situation results in reverse flow of current which yields power flow across the cells resulting in hotspots. Such adverse effect can be overcome by using bypass diodes in parallel across each module [84]. The P-V curve with and without bypass diode is shown in Fig.4.4 [42] [85] [86].
In view of extracting maximum PV power under non-uniform irradiance, the MPP extraction problem leads to finding out the global MPP rather than a single MPP in case of uniform irradiance condition.To implement a global MPP tracking strategy, the mismatch losses can be minimized by introducing alternative configurations to avoid the series connection of shaded and unshaded module within a PV array. Basically,
![Figure 1.2: Conversion mechanism of solar light into electricity [2]](https://thumb-us.123doks.com/thumbv2/123dok_us/10957705.2984165/22.892.258.689.174.600/figure-conversion-mechanism-solar-light-electricity.webp)